US Dollar Index (DXY) Chart AnalysisUS Dollar Index (DXY) Chart Analysis
The addition of the US Dollar Index (DXY) to FXOpen’s suite of instruments offers traders potential opportunities. This financial instrument:
→ serves as a measure of the overall strength of the US dollar;
→ is not tied to a single currency pair but reflects the value of the USD against a basket of six major global currencies, including the EUR, JPY, and GBP;
→ allows traders to capitalise on price fluctuations in the currency market;
→ is used in more advanced strategies for hedging risks in portfolios sensitive to sharp movements in the US dollar.
In today’s environment of heightened volatility, this instrument becomes particularly valuable. The active stance of US President Donald Trump — through the implementation of trade tariffs, sanctions, and unpredictable geopolitical rhetoric — gives traders even more reason to closely monitor the DXY chart.
Technical Analysis of the DXY Chart
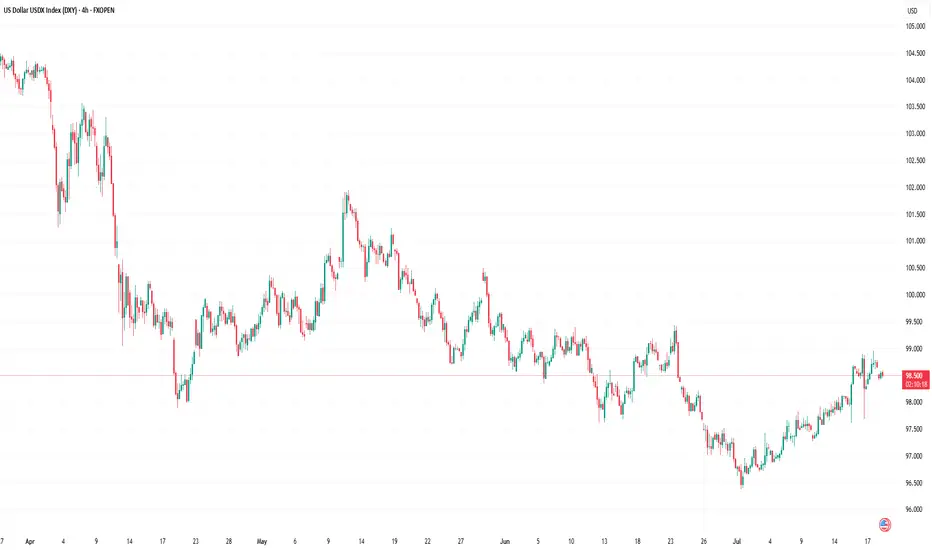
Moving averages show that the US Dollar Index displayed a predominantly bearish trend during the first half of 2025.
However, the picture shifted in July: the index began rising steadily (already up approximately +1.9% since the beginning of the month), highlighted by the blue ascending trend channel.
This suggests that the DXY may have found support following a prolonged decline, and a shift in market sentiment could be underway: after a bearish phase, a period of consolidation may follow. If this scenario plays out, we could see DXY oscillating between the 97.65 and 99.30 levels – both of which show signs of acting as support and resistance (as indicated by the arrows).
This article represents the opinion of the Companies operating under the FXOpen brand only. It is not to be construed as an offer, solicitation, or recommendation with respect to products and services provided by the Companies operating under the FXOpen brand, nor is it to be considered financial advice.
Usdollarindexsignals
A Closer Look at the Role and Recent Volatility of the (DXY)A Closer Look at the Role and Recent Volatility of the US Dollar Index (DXY)
We don’t even need to say that the US Dollar Index (DXY) is one of the most influential benchmarks in global currency markets. The index, which measures the value of the US dollar against a basket of six major currencies, experiences heightened volatility and presents potential opportunities.
Understanding the DXY: A Macro Lens on the Dollar
The DXY tracks the relative strength of the US dollar versus a weighted currency basket including the euro, Japanese yen, British pound, Canadian dollar, Swedish krona, and Swiss franc. Although the euro comprises nearly 58% of the index, the DXY reflects broad USD strength or weakness across global markets, not just against a single currency.
Traders and analysts use the DXY as a key macro indicator—to track policy divergence between central banks, to hedge USD exposure, and to assess broader market sentiment. Rising DXY levels often signal tightening US policy or global risk aversion, while declines may reflect weakening growth expectations, dovish Fed policy, or geopolitical stress. In volatile environments like 2025, the DXY serves as a real-time barometer of global confidence in the US economy and dollar-based assets.
Recent Price Swings: Tariffs & Policy Uncertainty Shake the Dollar
Since April, the US Dollar Index has faced one of its most volatile stretches in years, driven by a convergence of Federal Reserve policy uncertainty and new trade tariffs announced by President Trump.
April: “Liberation Day” Tariffs Trigger Market Shock
On 2 April, the announcement of sweeping “Liberation Day” tariffs—10% on nearly all imports, with higher duties on selected countries—jolted currency markets. The DXY fell over 2% in a single day. In the following weeks, the index continued to decline as business confidence deteriorated and early signs of recession risk emerged.
May–June: Policy Headwinds Compound Dollar Weakness
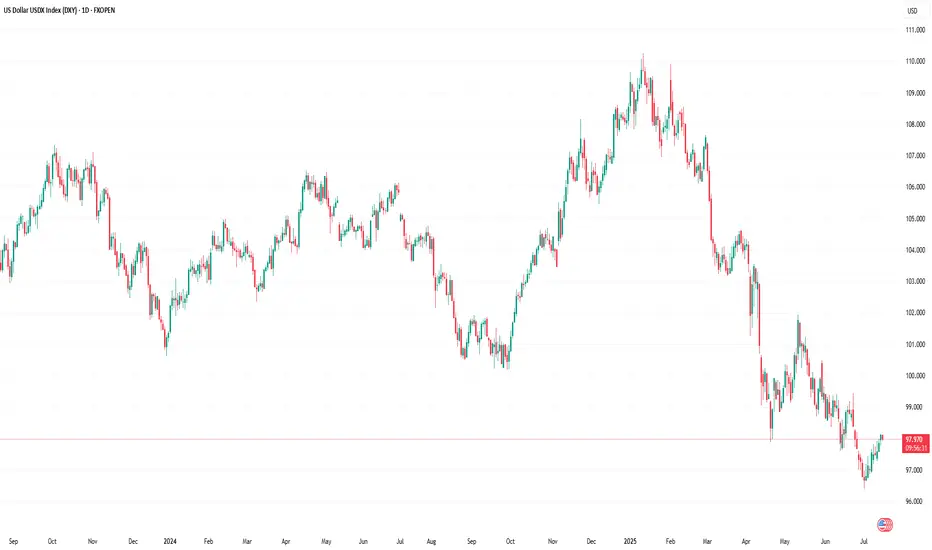
As the tariff package took effect, the dollar extended its slide—marking a ~10% drop from its late‑2024 peak, the worst first-half performance in over 50 years. Investors reassessed US growth prospects amid the pressures of trade friction. The Fed responded with a hawkish pause, while President Trump publicly urged for rate cuts, further muddying the policy outlook and pressuring the dollar.
July: Uncertainty Builds
By early July, the DXY had fallen below 97, tallying an approximate 11% year-to-date decline. Analysts cite a “perfect storm” of expanding fiscal deficits, erratic trade decisions, and growing doubts over US policy credibility as key reasons for the dollar’s fall from favour.
Why DXY Matters Now More Than Ever
The DXY has become a real-time gauge of market confidence in US policy stability. The dollar’s sharp decline in 2025 underscores how fragile that confidence can be in the face of aggressive trade measures and uncertain monetary direction.
The introduction of Trump’s tariffs has raised structural concerns among investors:
- Growth expectations have been cut due to higher input costs and supply chain friction.
- The so-called safe-haven appeal of the USD has eroded, with flows shifting to the euro, Swiss franc, and gold.
- Foreign demand for dollar assets has softened, as fears of a prolonged trade conflict and fiscal indiscipline mount.
In this climate, the DXY has evolved into a barometer for geopolitical tension, inflation fears, and investor sentiment towards US leadership.
Bottom Line
The DXY is not just a tool for dollar specialists—it's a key reference for any trader dealing with macro-sensitive instruments. As the global rate environment continues to shift and the US economy shows mixed signals, the DXY may become one of the most revealing indicators to watch and trade in the second half of 2025.
This article represents the opinion of the Companies operating under the FXOpen brand only. It is not to be construed as an offer, solicitation, or recommendation with respect to products and services provided by the Companies operating under the FXOpen brand, nor is it to be considered financial advice.
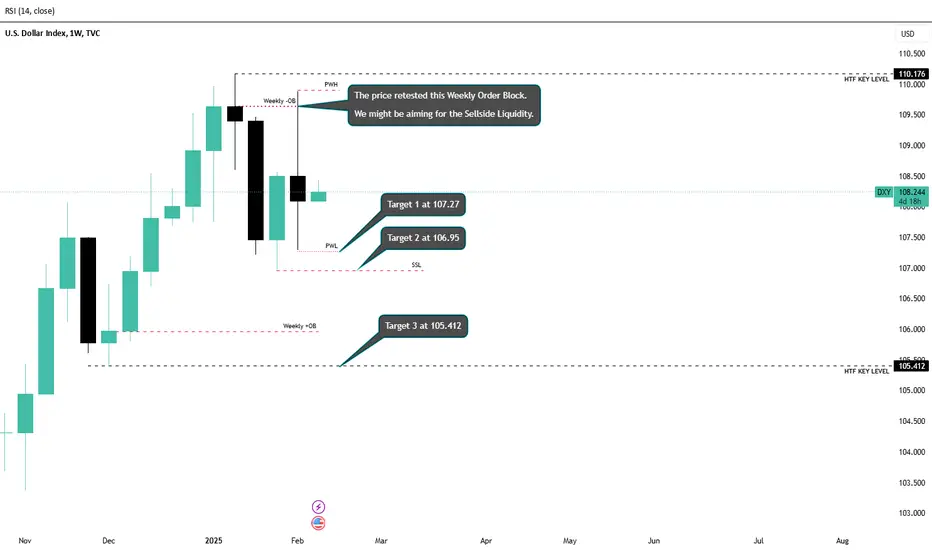
DXY Weekly BiasMy bias for this index is bearish considering that we retested and confirmed the Weekly Bearish Order Block at 109.65.
I do anticipate that the index might be attracted towards Sellside Liquidity at 107.27, 106.95 ,and 105.4.
Our daily setup will further give us the best entry and stop loss.
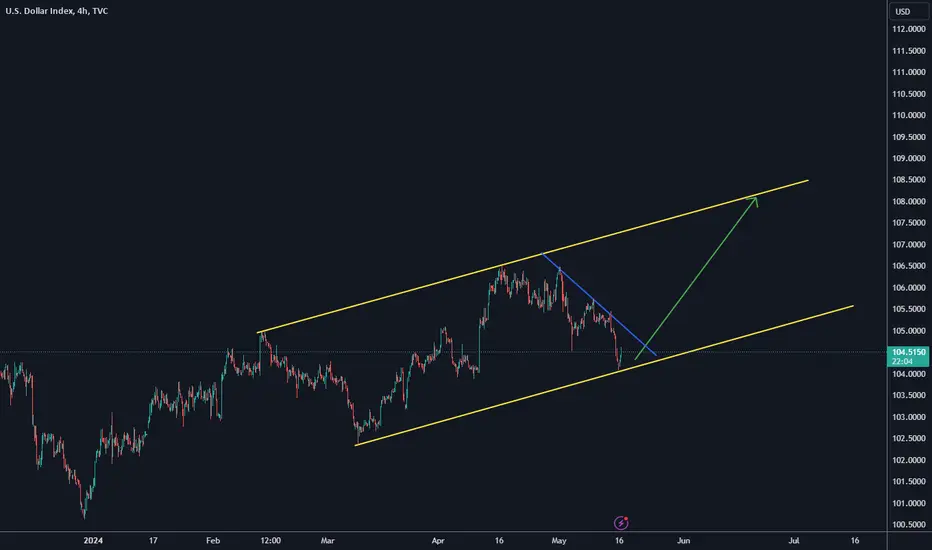
U.S. Dollar Index Upward Price Movement Until End of September?Here’s my analysis of the chart: I anticipate an upward movement in the U.S. Dollar Index until the end of September. Please note, this is based solely on time analysis, so the bar charts displayed do not predict future price levels.
The trade is still in its early stages, making it relatively low-risk. However, if the price falls below the current candle (first vertical line), this analysis will no longer be valid.
Let's see how it plays out, but be prepared to reassess if the price action invalidates the analysis.
SpaceIchimoku

US Dollar Index Short Term Sell IdeaH4 - Bearish trend pattern
Strong bearish momentum
Until the strong resistance zone holds I expect the price to move lower further after pullbacks.

Long From SupportUS Dollar Index (DXY) is reacting off the support level and could rise to the upside.

US Dollar Index (DXY) Update- Small pump then Dump.
- Keep it simple.
- Everything in graph.
- Older analysis. 👇👇
Happy Tr4Ding !
US Dollar Index - Looking To Sell Pullbacks In The Short TermH4 - Bearish trend pattern.
Lower lows.
Currently it looks like a pullback is happening.
Until the two strong resistance zones hold my short term view remains bearish here.

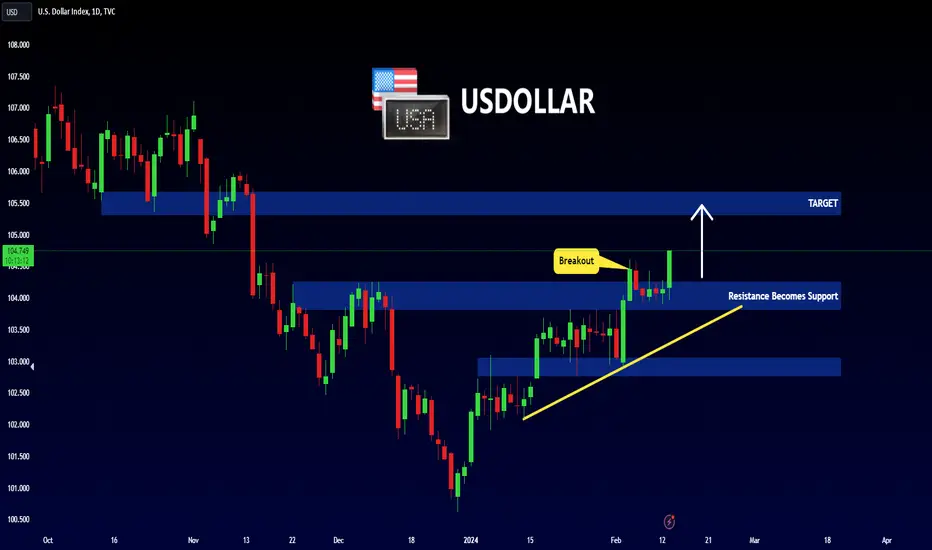
DXY - BULLISH MOVE 📈Hello Traders !
On The Daily Time Frame, The US Dollar Index Price Broke The Resistance Level (103.817 - 104.262).
This Key Level Becomes a New Support Level.
So, I Expect a Bullish Move.
-------
TARGET: 105.320🎯
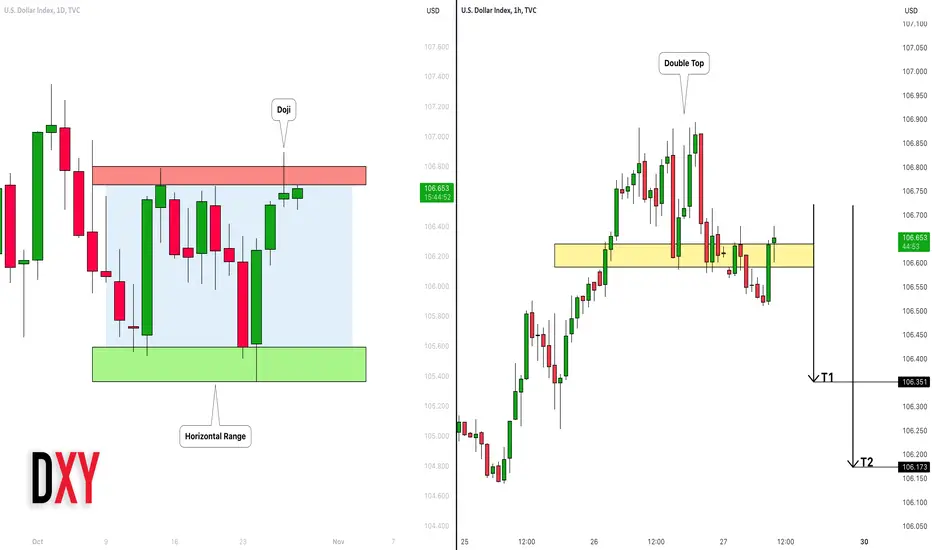
DOLLAR INDEX (DXY): Consolidation & Bearish Bias Explained 💵
Dollar Index is trading within a horizontal trading range on a daily.
The price tested the resistance of the range yesterday
and formed a doji candle on that.
As an extra bearish confirmation, I spotted a double top formation
on an hourly time frame.
I think that the Index will most likely retrace from the underlined
red resistance.
Targets: 106.35 / 106.17
❤️Please, support my work with like, thank you!❤️
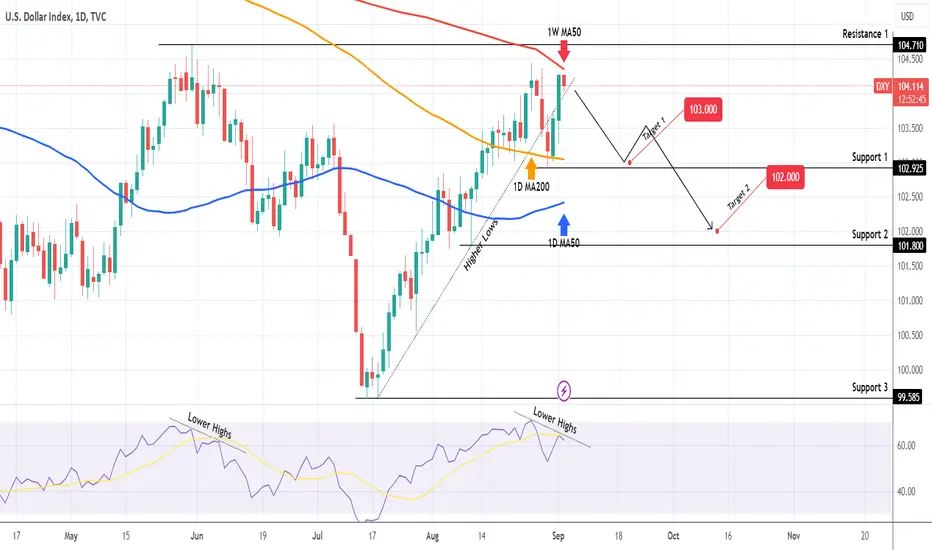
DXY First 1W MA50 test since March. Bullish or bearish?The U.S. Dollar Index (DXY) has come the closest it's been to the 1W MA50 (red trend-line) in 6 months (since March 09 2023). So far the price action has shown a bearish reversal sentiment as the Higher Lows trend-line of the rally since the July 14 bottom, broke last week, but the 1D MA200 (orange trend-line) supported. This bearish sentiment will be confirmed however if the price gets rejected on the 1W MA50, i.e. test it and close the 1W candle below it.
In that case we will open a sell on the spot and target the 1D MA200 again and Support 1 at 103.000. If after that the price closes a 1D candle below, we will sell again towards Support 2 (102.000).
-------------------------------------------------------------------------------
** Please LIKE 👍, FOLLOW ✅, SHARE 🙌 and COMMENT ✍ if you enjoy this idea! Also share your ideas and charts in the comments section below! **
-------------------------------------------------------------------------------
💸💸💸💸💸💸
👇 👇 👇 👇 👇 👇
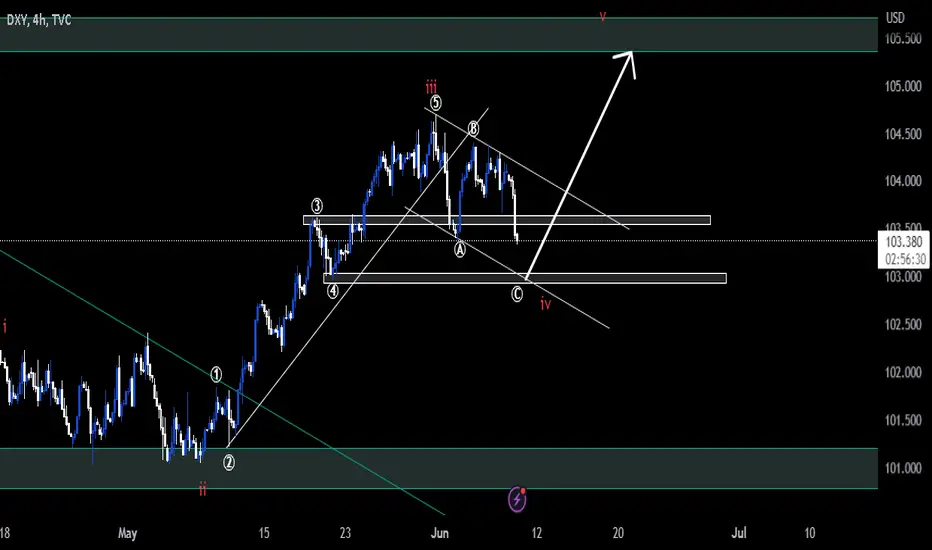
DXY REBOUND....waiting for the market to drop down to our zone where we will be looking for long position as the #dxy completes its fourth wave
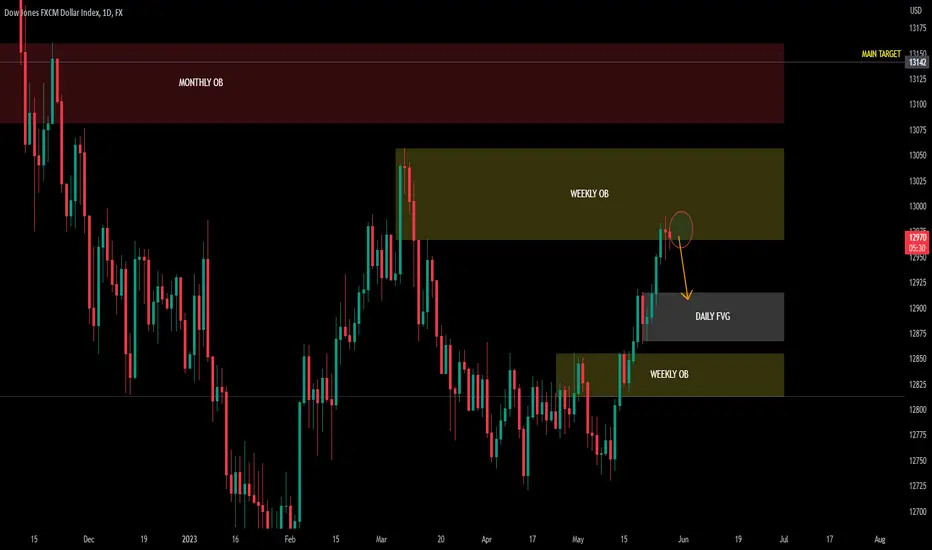
US DOLLAR INDEX ____ WHY YOU SHOULD PAY ATTENTIONHey Traders,
Long time no see. If you follow me already, you will notice that I draw my bias to trade USD pairs from the dollar index.
My bias as you can see for this week is bearish. However, I expect a longer-term bullish move for the dollar.
As the price has entered a weekly order block, I expect it to help force the retracement from the bullish rally.
Based on this view, I will be posting a few pairs on my radar to trade accordingly.
Follow for more.
Cheers,
David
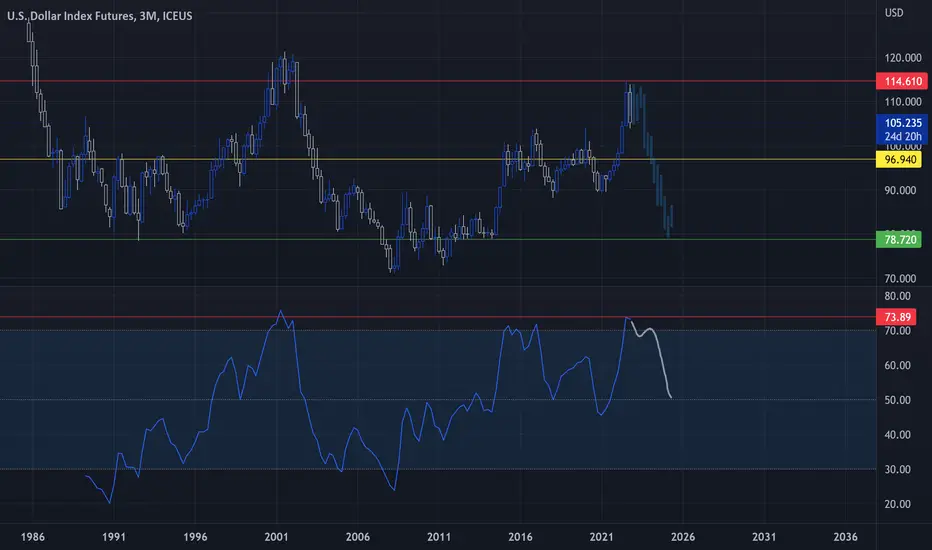
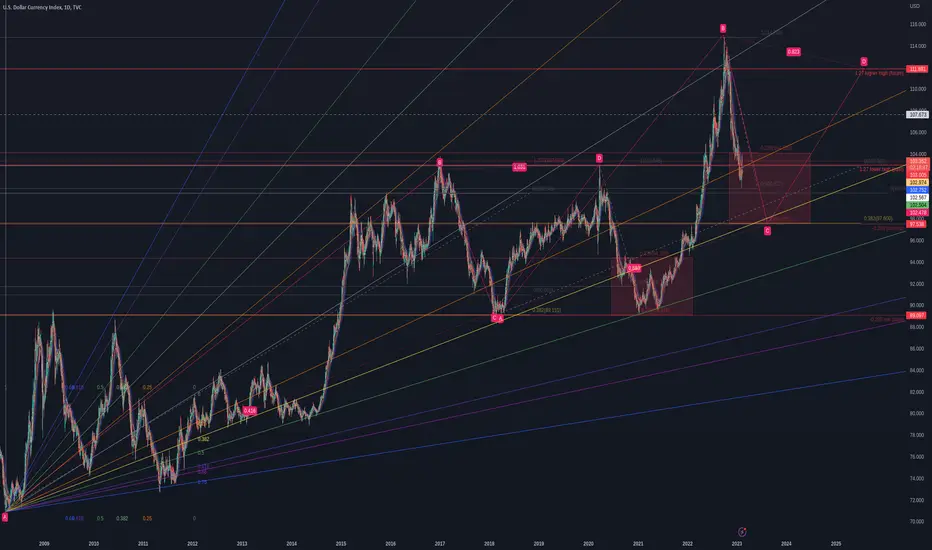
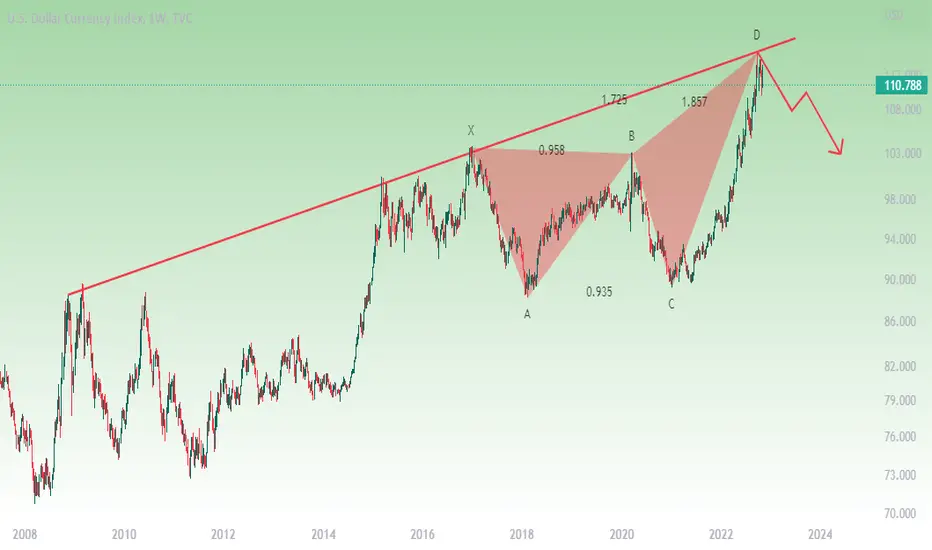
US DOLLAR Currency Index - Possible Bottom and Top LevelsABCD Pattern with 0.382 Fibs and 1.27 past fib high, current probable 1.27 fib high, -0.236 past fib low and probable current -0.236 fib low. Interesting fibs.
Target bottom approx 97.50 target top approx 111.80
Added the Speed Resistance Fan for confluence. Pretty much made up based on High and Low, not sure about this, but it does have confluence against the current predicted low. I like it.
📉✌DXY Down --> Bitcoin Up?✌📈TVC:DXY
CAPITALCOM:DXY
💥As DXY starts a downtrend, Euro and Bitcoin can experience a few weeks of strong growth💥
First target ---> 107.8
Second target ----> 102.9
Please share ideas and leave a comment,
let me know what's your idea.
CrazyS✌
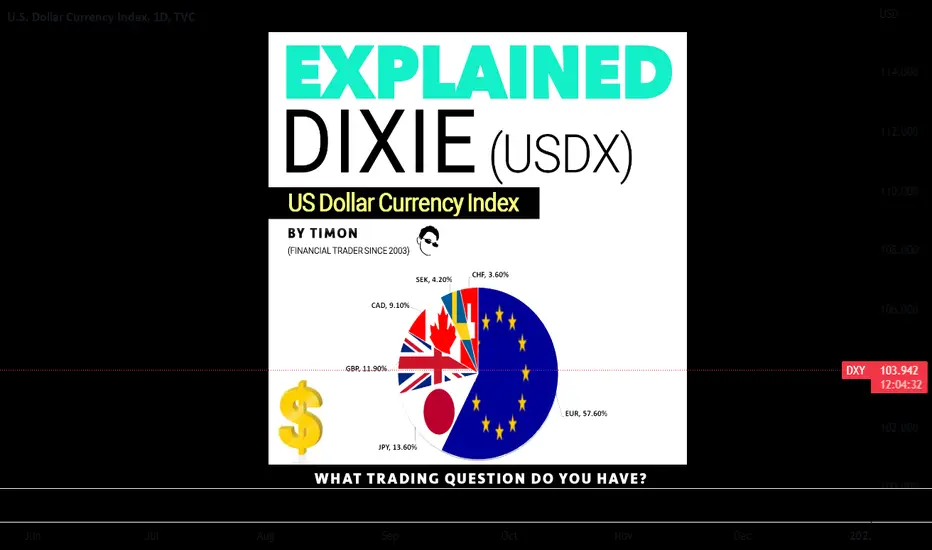
EXPLAINED DIXIE (US Dollar Currency Index) What, why where, how?The US Dollar has been in the limelight and not in a good way. In fact, he US dollar has not been dimmer since 22 September 2022 where it was trading at 114.42.
Currently it’s at 103.90 (9.19%) down…
But what does it all mean?
Why is the Dixie such a popular index to understand, and trade.
You see it in the news every time you turn on Bloomberg and you see it in the publications. So we might as well understand it for the next time they mention the Dixie.
IN this short article I’m going to answer the 6 most important questions, to help you understand the Dixie is, how it’s calculated and how to trade it…
1. WHAT IT IS?
The U.S. Dollar Index – DIXIE - (USDX) was first intrpduced in March 1973 and is a measure of the value of the U.S. dollar relative to a basket of foreign currencies.
2. HOW IT’S CALCULATED
The USDX is calculated by the Federal Reserve Bank of New York and is based on the exchange rates of six major currencies: the euro (EUR) – Accounts for 57.6% - ,Japanese yen (JPY), British pound (GBP), Canadian dollar (CAD), Swedish krona (SEK), and Swiss franc (CHF) .
3. ECONOMY GAUZE
The DIXIE is used as a barometer for the value of the US dollar to base it on the potential strength of weakness of the U.S Economy.
4. TRADED BASED ON
The USDX is traded on financial markets, and its value moves based on certain macro aspects such as: Changes in exchange rates, economic conditions, and global market trends.
5. USE
Investors and financial institutions uses the USDX is often to hedge against currency risk, as well as to speculate on changes in the value of the U.S. dollar.
6. HIGHER VERSUS LOWER VALUE
If the Dixie goes up this means the US Dollar is gaining strength against the other currencies. The more it goes up the more it appreciates which indicates a stronger US dollar – Stronger economy – more confidence in the US dollar.
If the Dixie drops, it means the US dollar is getting weaker against the other currencies in the basket for the index. As it drops more, it depreciated which tells us the US dollar is getting weaker which means – a weaker economy and less confidence in the US dollar.
If this was interesting let me know in the comments or hit the like button and let me know what else you would like to learn about in bite size information.
Trade well, live free.
Timon
MATI Trader
DXY Time to Pullback After a significant sharp drop, US dollar index approached to the support level and got rejected from it.
Currently, price is being pushed to the upside and is facing bullish pressure. It seems it is entering to the correction phase and is likely to pullback to the yellow resistance area.
I think we might see some upside retrace and strength on US dollar for a while.
I expect a pullback towards the yellow zone which is between 107.700 - 108.600

US dollar index: DXY bull trend over as inflation cools? DXY fundamental analysis
The dollar tumbled after US consumer inflation data fell more than expected in October.
Annual headline inflation ECONOMICS:USIRYY fell to 7.7% in October, from 8.2% the previous month and below the 8% predicted. The core measure of inflation ECONOMICS:USCIR , which excludes volatile energy and food costs, fell to 6.3% from 6.6%, falling short of expectations (6.5%). The monthly increase in headline inflation was 0.4% instead of the 0.6% that was expected, and the core increase in inflation was 0.3% instead of the 0.5% that was expected.
Lower-than-expected US inflation has prompted investors speculating on slower Fed rate hikes in the future.
The probabilities for the December meeting have swung in favour of a 50 basis point hike, which is currently factored with an 80% chance, up from 50% before the CPI release.
The expected terminal rate at which the Fed's rising cycle will terminate in May 2023 has decreased to 4.80% from 5.08% before to the inflation report. This means that the markets are currently pricing in an increase of just over 75 basis points until May 2023. US 2-year Treasury yields, which reflects expectations for the Fed monetary policy sunk by 26bps to 4.3%. Expectations of Fed terminal increases and rising US 2-year Treasury yields have supported the DXY bull trend throughout the year.
Reduced rate hike expectations are bad news for the dollar, but Fed Chair Jerome Powell's comments at October's FOMC meeting suggest it's premature to declare the end of the raising cycle.
Technical analysis
The DXY daily chart would suggest that we may be facing the end of the dollar's bullish trend, as the price action in the November 10th session actually broke down the bullish trendline of 2022, and lowered even further than the 50-day moving average.
However, for a confirmation of that trend reversal in the DXY, we should likely wait until major Fibonacci retracement levels are cleared by price action.
The next level of support is 107.1 (38.2% Fibonacci level of 2022 range), followed by 104.7, which would represent a 50% retracement of the 2022 dollar rally.
If bears can break through that barrier, it would mean that they will be in charge of the dollar trend.
However, if the Fed pushes back against the slowdown in the inflation rate and signals a more restrictive monetary policy than the market is actually pricing in, we might see some bulls reappear on DXY dip. This contrarian scenario, which seems less likely for the market, could effectively limit the downward movement of the USD.

US Dollar Index going shortUS Dollar index is short, which means I'm only looking for long positions on the EURUSD

USDOLLAR - Extra Bullish ScenarioSimilar Up Channels can be drawn, with the period in the middle being a period of low / no growth
Early growth can be used as an indicator of future growth?
The horizontal white line is a baseline, very strong support

USDCHF:US DOLLAR BULLS STRUGGLEThe US Dollar Index (DXY), which had risen for three days, started to decline early on Tuesday morning, reaching 111.50. The index of the US dollar versus the six major currencies, which also tracks down US Treasury rates, reflects the market's concern ahead of the crucial central bank pronouncements and the US jobs numbers.
The US dollar seems to have been under pressure due to the dismal US figures and forecasts for additional drops in oil prices and inflation.
US President Joe Biden on Monday asked oil and gas businesses to use their record profits to lower costs for Americans and increase production, or face a higher tax rate, as he battles high pump prices with elections taking place in a week.
We expect the pair to head lower

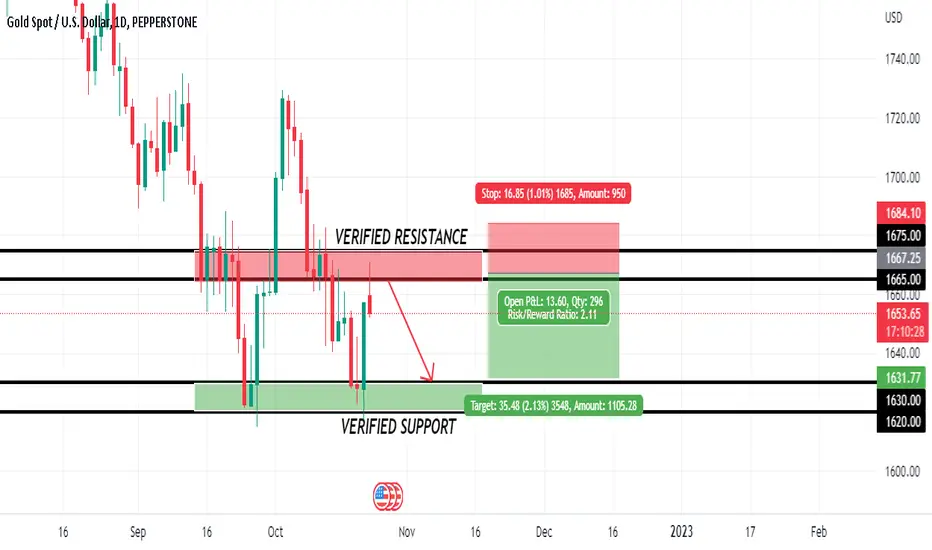
XAU/USD declines from $1,670 in the face of a turbulent DXYThe price of gold has fallen significantly since it crossed the $1,670.00 barrier.
The US dollar index (DXY) has become extremely volatile due to rumors that the Bank of Japan (BOJ) intervened in the FX markets to strengthen the Japanese yen, which has put some fair selling pressure on the precious metal.
The Federal Reserve policymakers are expected to raise interest rates by another 75 basis points at their meeting in November, according to Nick Timiraos, Chief Economics Correspondent at The Wall Street Journal (WSJ).
However, Monday's news that North and South Korea had fired warning shots at each other along their disputed western maritime border also appeared to have helped recent US dollar purchases.
Concerns that Chinese President Xi Jinping would not hesitate to intensify geopolitical issues with the US when it comes to Taiwan may be on the same lines. The third consecutive victory for Jinping at the annual Communist Party Congress may have contributed to the cause.
Future gold price declines are anticipated due to uncertain market conditions and challenges to sentiment.