Tether Dominance RENKOThese are short-term signals.
In a few days we will look at Tether Dominance (USDT.D) with RENKO on higher timeframes and go into details about the signals.
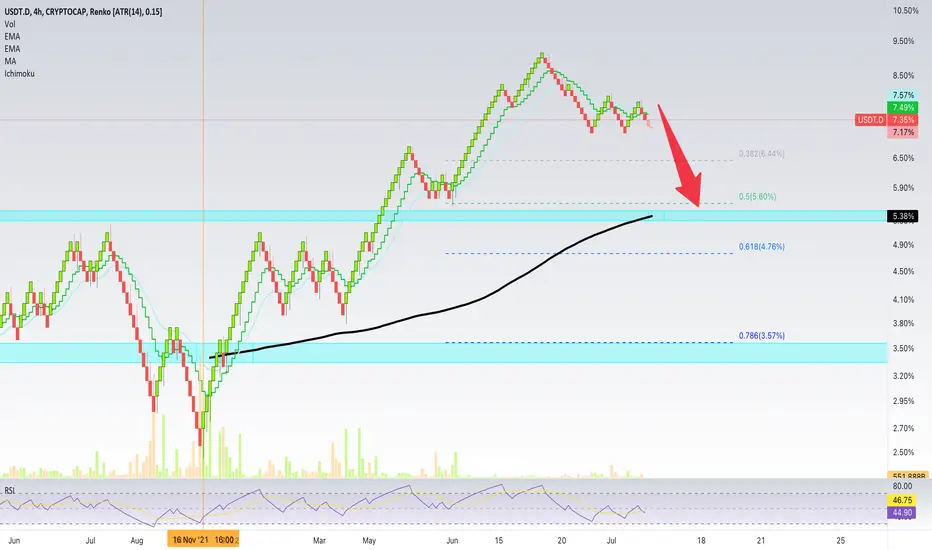
USDT.D trading below EMA10/21.
Multiple red bricks already in place.
Bearish RSI.
Here the bearish target (support) is set at 5.38% but if you look back to November 2021, we can see that this level can be broken easily on corrections.
And so we are open to seeing it go lower.
Namaste.
Usdtd
USDT.D BEST PLACE TO BUY FROM|LONG
Hello, Friends!
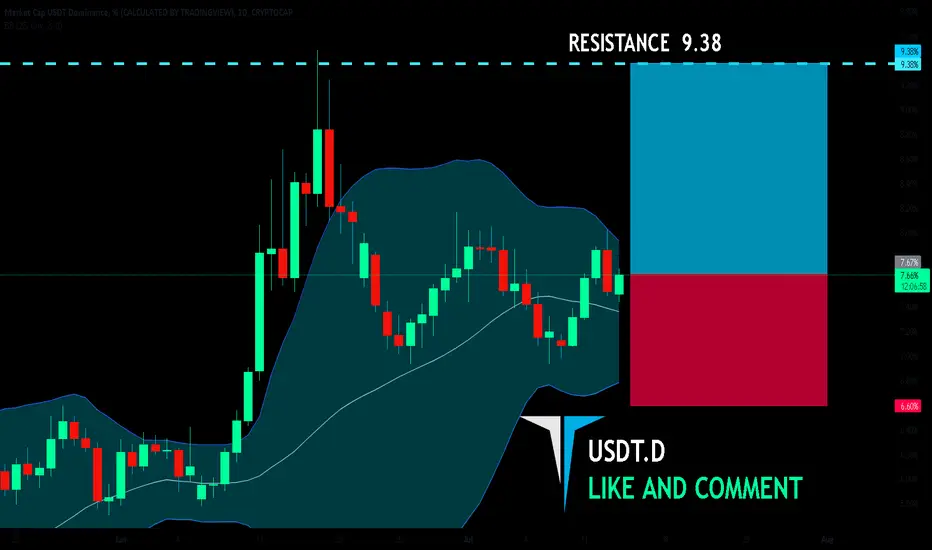
Anyone who looks at the chart of USDT.D today
Can tell that bulls will win this battle
So we are opening a long position!
BUY!
✅LIKE AND COMMENT MY IDEAS✅
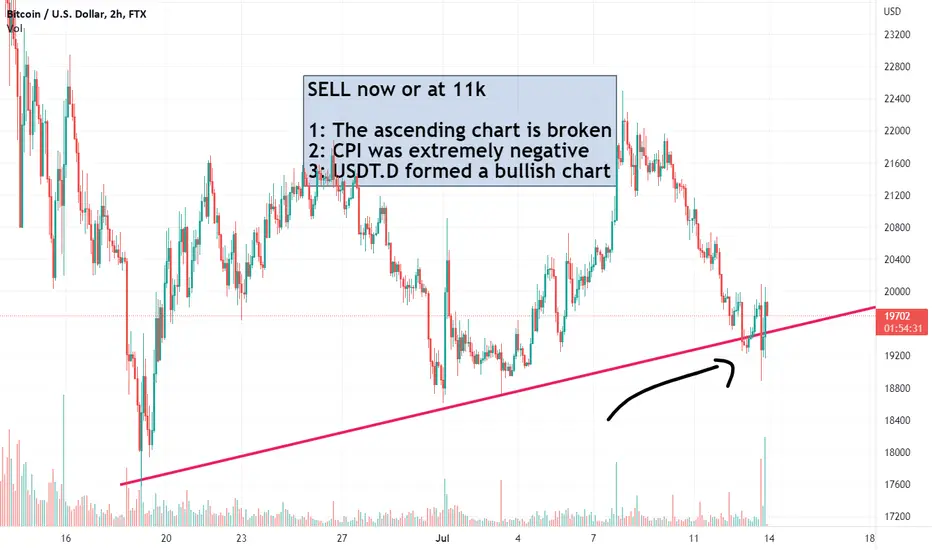
BTC OutlookSELL now or at 11k
1: The ascending chart is broken
2: CPI was extremely negative
3: USDT.D formed a bullish chart
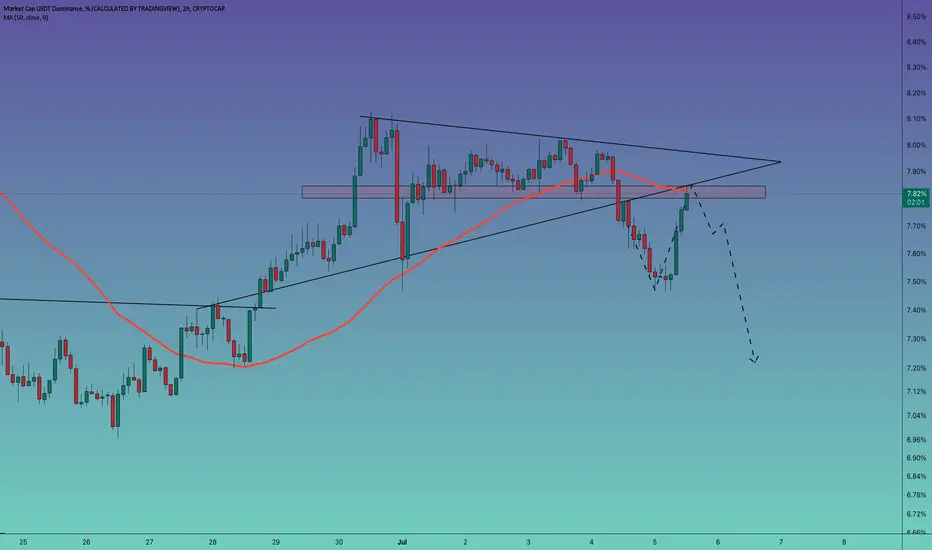
#USDTDOMINANCE 2HOUR UPDATE !!USDT DOMINANCE ANALYSIS
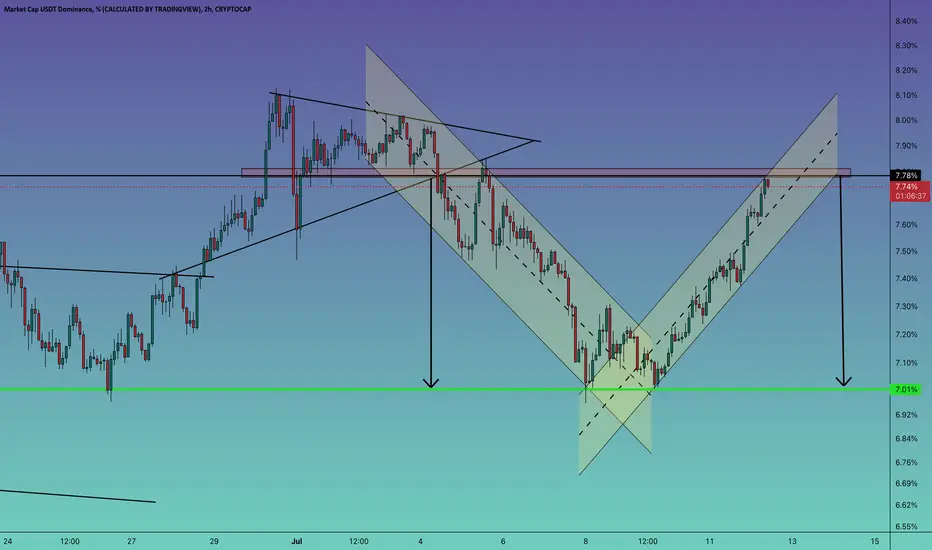
As we can see from the above-mentioned chart that USDT DOMINANCE again repeats the previous pa.
As USDT DOMINANCE currently trading below the resistance level and printing a rejection.
If we consider the previous PA then USDT DOMINANCE might move downside till the lower green support area.
The candle closing below will be the invalidation point of this chart analysis.
This is not a piece of financial advice. All investment made by me is at my own risk and I am held responsible for my own profit and losses. So, do your own research before investing in this trade.
Thanks for your time, we hope our work is good for you, and you are satisfied, we wish you a good day and big profits.
THANK YOU.
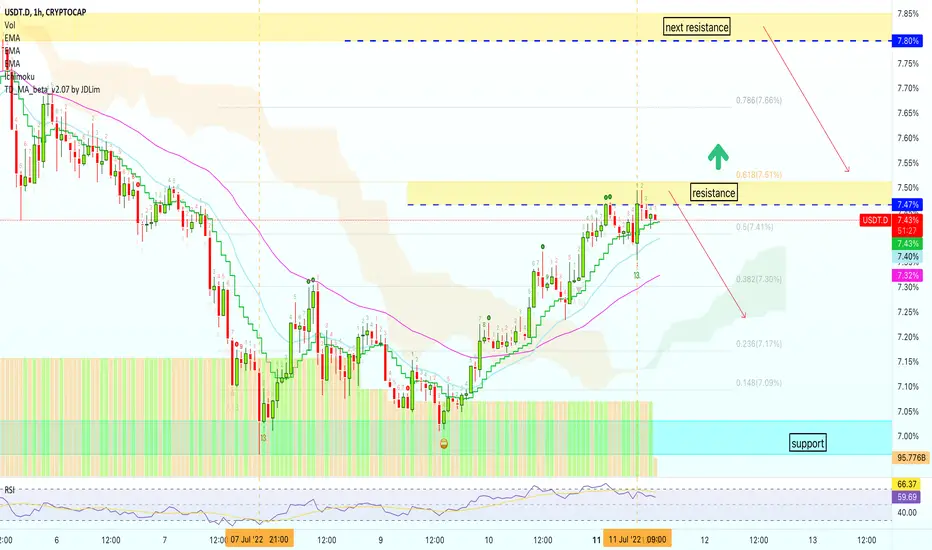
People Are Starting To Lose Patience...Next to getting rid of your losers and riding for as long as possible the winners, patience is one of the most imporatnt virtues you can have when it comes to cryptocurrency trading.
Patience is truly the key to win.
When USDT.D was oversold on the RSI, it went up.
As USDT.D gets to overbought, it is very likely to drop.
The immediate resistance on this index is set at 7.51% followed by 7.85%.
The 7.51% is the main one for us and we are bearish here.
If this level fails there is still more resistance overhead.
USDT.D and BTCUSD have an inverse correlation and that is why we track this index everyday.
It can be used for confirmation.
If you see a bullish BTC, you can confirm your bias if you also see a bearish USDT.D.
A bullish SPX supports any bullish signals found on BTCUSD, etc.
There are many different altcoins, indexes, pairs, charts that can be used in this manner, for comparison purposes.
Thanks a lot for the continued support.
Namaste.
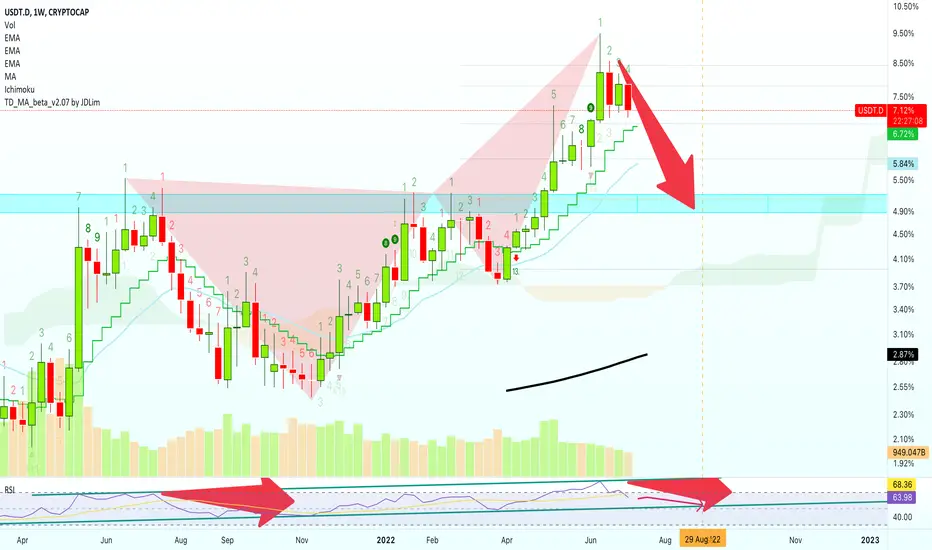
Tether Dominance Weekly Turns Full BearishWhen looking at the weekly chart for USDT.D (Tether Dominance Index), we can notice a full red/bearish candle.
We have a rising channel also breaking bearish:
Together with a bearish harmonic pattern.
The RSI is pointing straight down:
One last signal is MA200, the black line on the chart.
We can see it rising and we know that prices tend to gravitate towards this line.
As MA200 trends up, USDT.D trends down.
Namaste.
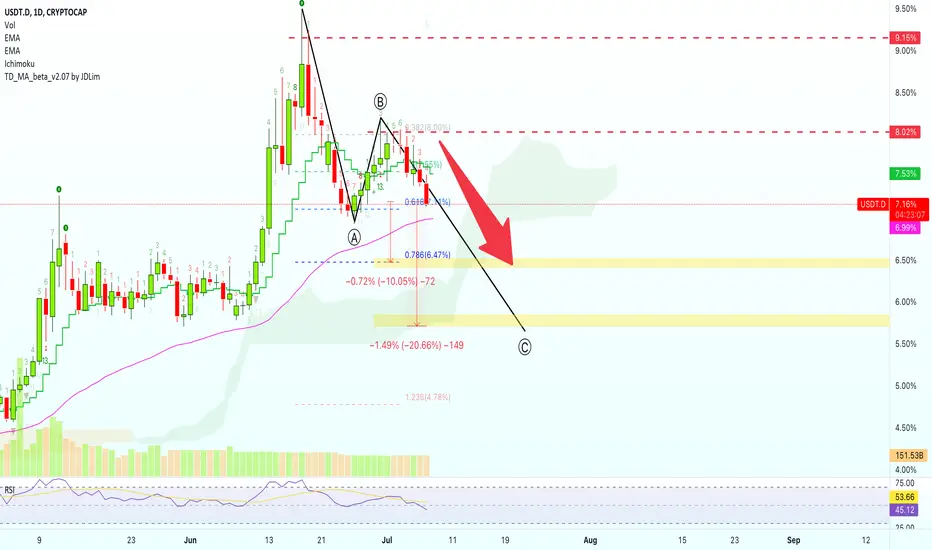
Tether Dominance Going 10% to 20% LowerHello my beloved cryptocurrency traders, supporters and readers... I hope you are having a great week.
Let's start today with the Tether Dominance (USDT.D) index chart.
Our focus now is on the next target/support.
We see a 10% drop happening firts.
A small bounce...
Followed by another drop that will end at "C" or a total of -20% from the current price.
Inversely this would signal that Bitcoin is about to speed up when it comes to price growth.
Namaste.
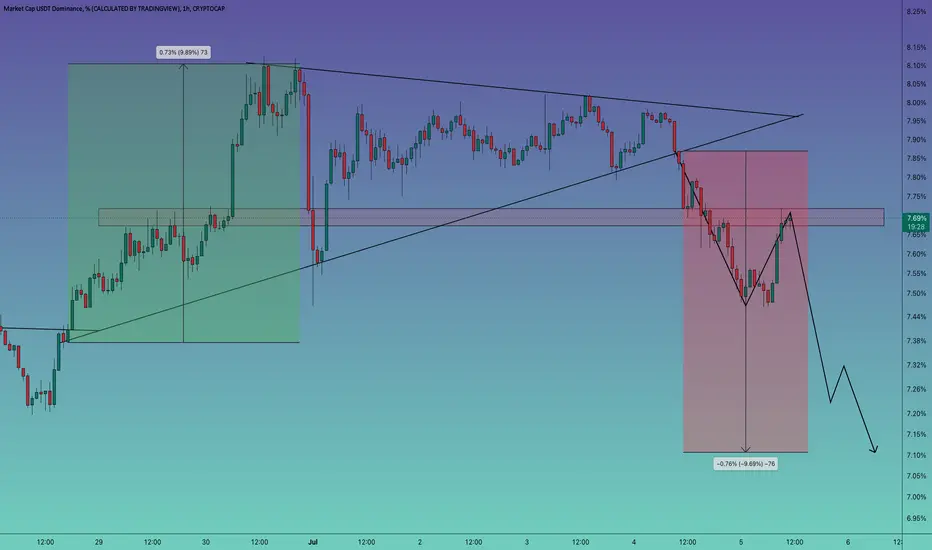
#USDT.DOMINANCE 1HOUR UPDATE !!Hello dear traders, we here new so we ask you to support our ideas with your LIKE and COMMENT, also be free to ask any question in the comments, and we will try to answer for all, thank you, guys.
# USDT. DOMINANCE UPDATE!
As I mentioned in my previous chart that USDT DOMINANCE will reject from the 7.78% level and it got rejected.
In current scenario USDT DOMINANCE is trading 3.2% below from .78% level.
IMO, USDT DOMINANCE will rally below this level to 7.10% which is the strong support zone currently.
Remember:-This is not a piece of financial advice. All investment made by me is at my own risk and I am held responsible for my own profit and losses. So, do your own research before investing in this trade.
Thanks for your time, we hope our work is good for you, and you are satisfied, we wish you a good day and big profits.
THANK YOU.

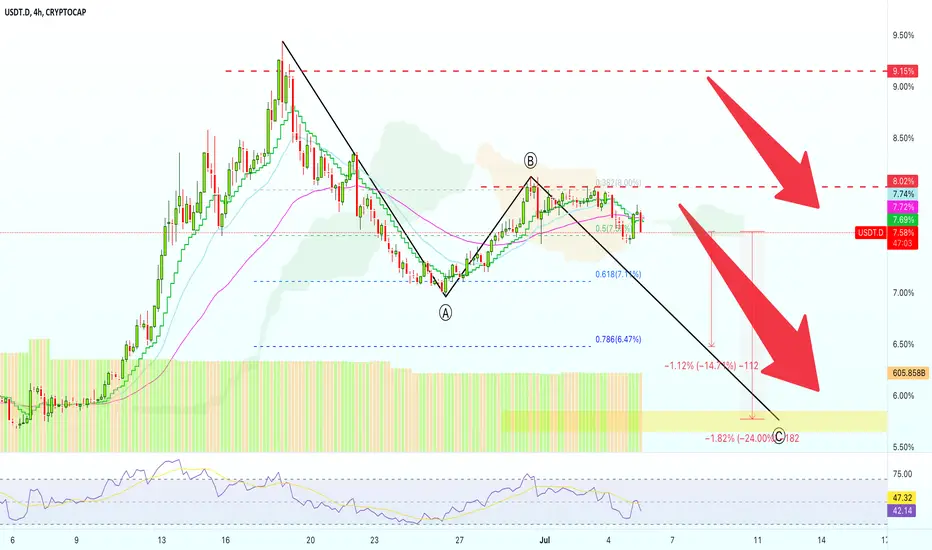
Tether Dominance vs Bitcoin (Cryptocurrency Market Bullish Wave)Bitcoin is about to go high up if we reconsider the inverse correlation between USDT.D and BTCUSD... Let's read the chart.
According to the USDT.D index, Tether Dominance is about to have another leg down; a major drop on the EW ABC correction.
This drop can take USDT.D to 6.45% or lower at around 5.70%, this would equate to a price jump on Bitcoin to around $22 to $25K.
This is how it goes.
After this next leg down, we get the classic bounce and then additional drop. (USDT.D)
As for BTC, the inverse... We get this upsurge and after the initial resistance is hit a small retrace follows and then additional growth. (BTCUSD)
The cryptocurrency trading pairs can turn and stay green all the way to end of August, late September at most.
It will be a nice bullish wave...
I hope to see you around and have your support.
Namaste.
USDTDOMINANCE 2HOUR UPDATE BY CRYPTOSANDERS !!
Hello dear traders, we here new so we ask you to support our ideas with your LIKE and COMMENT, also be free to ask any question in the comments, and we will try to answer for all, thank you, guys.
as I mentioned in my previous chart that USDT DOMINANCE will move upside till the level of 7.79% and it moved well USDT DOMINANCE is currently trading on a crucial resistance level.
It needs to get rejected from this level for bulls, rejection will again bring green candles in ALT coins, and a break above will end up things again for bulls and it will rally towards the level of upper resistance which is around 8%.
Let’s see how USDT DOMINANCE performers in upcoming hours.
Remember:-This is not a piece of financial advice. All investment made by me is at my own risk and I am held responsible for my own profit and losses. So, do your own research before investing in this trade.
Thanks for your time, we hope our work is good for you, and you are satisfied, we wish you a good day and big profits.
THANK YOU.
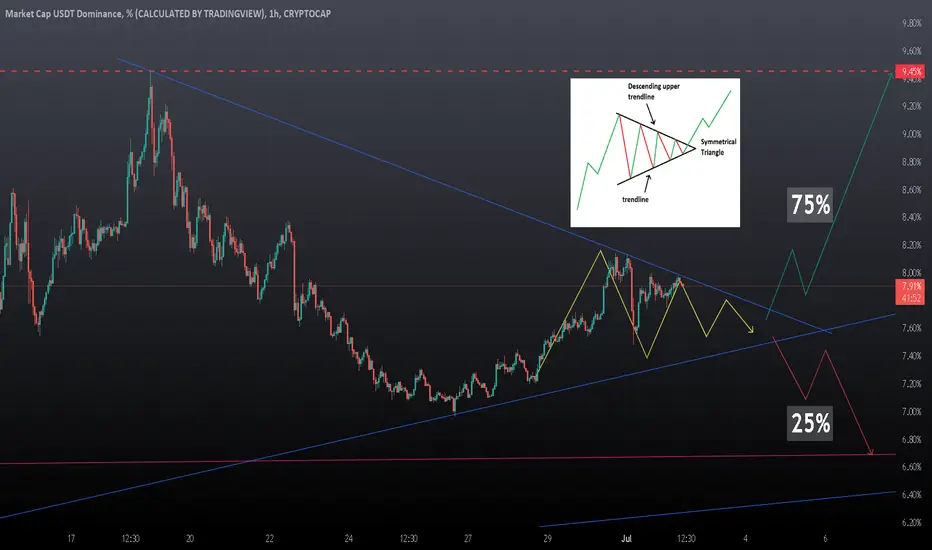
#USDT.DOMINANCE 1HOUR UPDATE !!USDT DOMINANCE ANALYSIS
USDT DOMINANCE breakout this symmetrical triangle pattern and currently it is facing 7,79% as resistance so we can expect some drop from here.
Let's see how the market will react in a few hours.
This is not a piece of financial advice. All investment made by me is at my own risk and I am held responsible for my own profit and losses. So, do your own research before investing in this trade.
Thanks for your time, we hope our work is good for you, and you are satisfied, we wish you a good day and big profits.
THANK YOU.
Tether Dominance Update (Adapt and Change)This is yesterday's chart updated...
The major resistance short-term has been defined at 8.02%, since we have an interesection of two trendlines and two rejections.
The bias remains the same as yesterday.
Bearish below 8.14%.
Bullish above.
We are bearish in general as we've been tracking this one and expecting a drop.
We adapt to market conditions...
We adapt to the charts when they change.
The charts are always changing...
We are always adapting.
Namaste.

Tether Dominance Short-Term (Lower Highs)This is the chart that I have for USDT.D (Tether Dominance).
30-June sets the high and 2-July the lower high.
This is a short-term chart.
The marked candle 2-July '22 05:00 gives out a short/sell signals.
The RSI trending lower to move below 50 gives out another bearish signal.
We can also see a loss of the 10 sessions average support price at 7.92%...
These are bearish signals but things can easily change.
Namaste.

USDT.D 1HCurrently, it is placed in a triangle pattern and it is approaching its end. In such a pattern, there is a possibility of exit from both sides, but currently, with the current conditions in the market, there are strong and close supports in Dominance Tether, economic..... It is likely to move upwards and reach new heights (personal opinion). Good luck and be profitable.
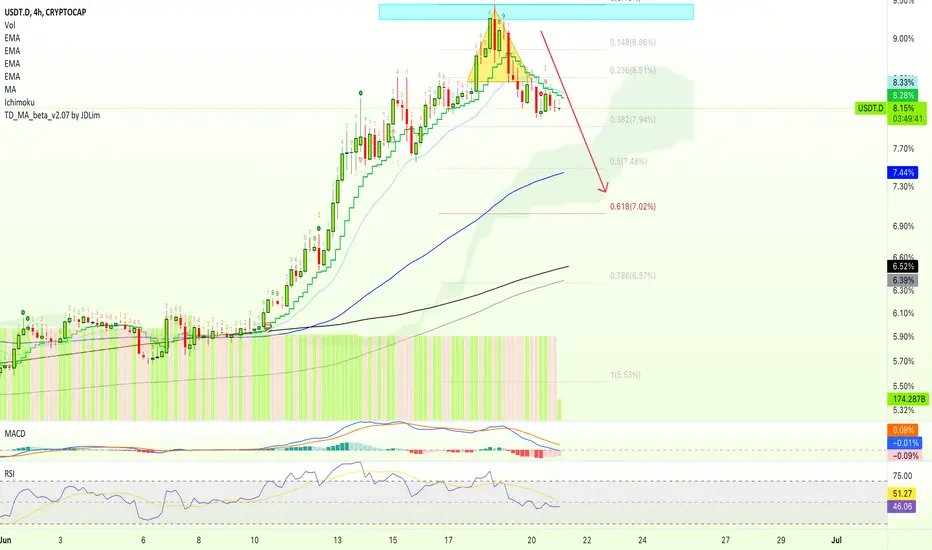
Tether Dominance Next Target Mapped (Red)Looks like we have the complete b wave of the ABC correction we mapped a few days ago.
We can see EMA50 holding as support after a higher low.
This is set at 7.58%; This level is very likely to fail.
The RSI has gone bearish (below 50) and we have a clear lower high.
The next target is set first at 7.02% followed by 6.37%.
If we see straight down, as the chart is saying, Bitcoin will move straight up.
Namaste.

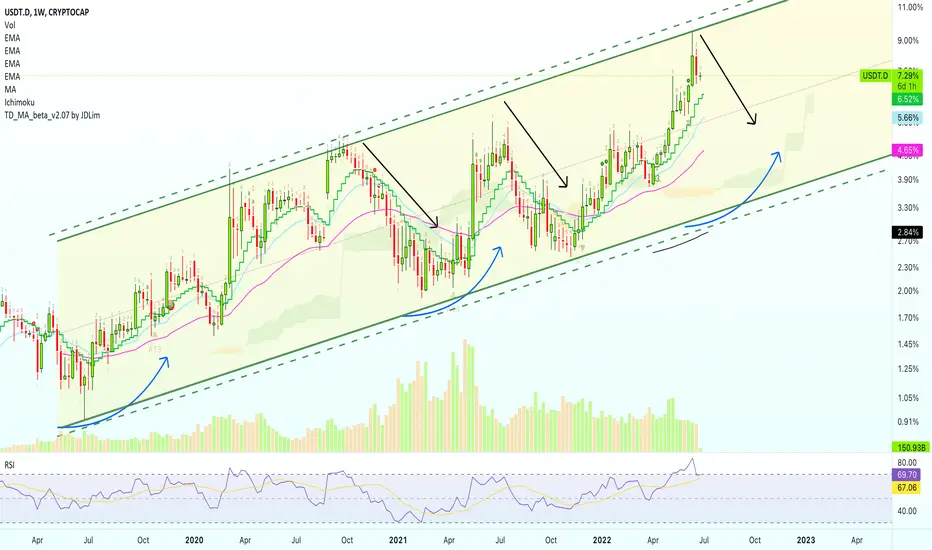
Tether Dominance Weekly OverboughtThis is the long-term chart for Tether Dominance (USDT.D) and we are looking mainly at an ascending channel.
Each time the upper-band of the channel is hit we get a retrace/correction.
The upper-band being hit coincides with an overbought RSI.
An overbought RSI has always led to a strong correction.
Just yesterday/last week, USDT.D closed with the highest RSI value ever, signaling an overbought status.
It is only a matter of time before Bitcoin starts to grow; big, fast & strong.
I meant to say, it is only a matter of time before Tether Dominances drops.
Namaste.
Long or Short? Update for Leverage traders...USDT Dominance is at a decisive point. Multiple
Rejection candles will lead to a rally across the market.
BTC could hit $23k+ and alts will follow, probably a green week.
However, a close above the resistance will lead to a correction.
Important area, stay vigilant.
CONCLUSION:- Close above 7.28% will trigger short entries across the market.
Close below 7.23% enter long position with SL.
Let me know what you think in the comment section and hit the like button if you find this update helpful.
DYOR
Thank you
#PEACE

Tether Dominance Classic ABC CorrectionWill Tether Dominance recover and Bitcoin crash fully to new lows?
Not likely...
Any recovery can be the "B wave" of a classic ABC correction.
These come after new peaks/highs just as we see with USDT.D.
Be patient.
You can see a shaky/bearish Bitcoin from Monday through Thursday and then we resume the growth.
Just one of the many possible scenarios but is better to be ready than to be taken by surprised...
Thanks for the support.
Namaste.

Tether Dominance Decline Not OverWe see Tether Dominance (USDT.D) declining slowly since 18-June... But, is it over?
Not likely.
The downtrend is only getting started and the chart signals and indicators continue pointing to lower prices.
USDT.D just hit a support level recently around ~7.10%.
After a small bounce, we are likely to test EMA300/MA200 at 6.66% - 6.75%.
Followed by 5.70% as the final target short-term.
Conditions for change
If USDT.D moves and closes above 7.56% the short-term bullish bias is compromised but not all is lost.
It needs time to develop.
Namaste.

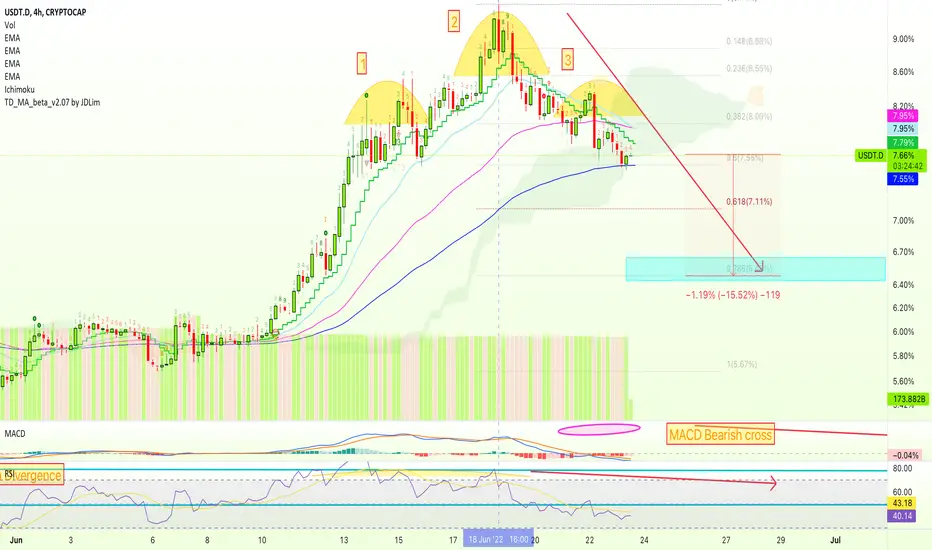
Tether Dominance Bearish Continuation (Multiple Timeframes)As long as Tether Dominance index (USDT.D) continues beairsh, we continue safe.
We can see it dropping since 18-June.
Trading below EMA50, USDT.D is aiming lower and the next target is set at EMA300 or 6.49%.
The indicators are going full bearish as well on the 4H timeframe.
---
When we look at the daily timeframe, everything becomes clearer.
The MACD is showing a full bearish cross in the making:
The RSI is showing bearish divergence after the last peak produced a lower high compared to a new All-Time High on the USDT.D chart.
We can also appreciate a full candle close below EMA10 daily, this signal confirms only when today's candle closes if it closes below 7.86%.
These are all bearish signals...
So far now, all I can say is that PATIENCE IS KEY!
Namaste.
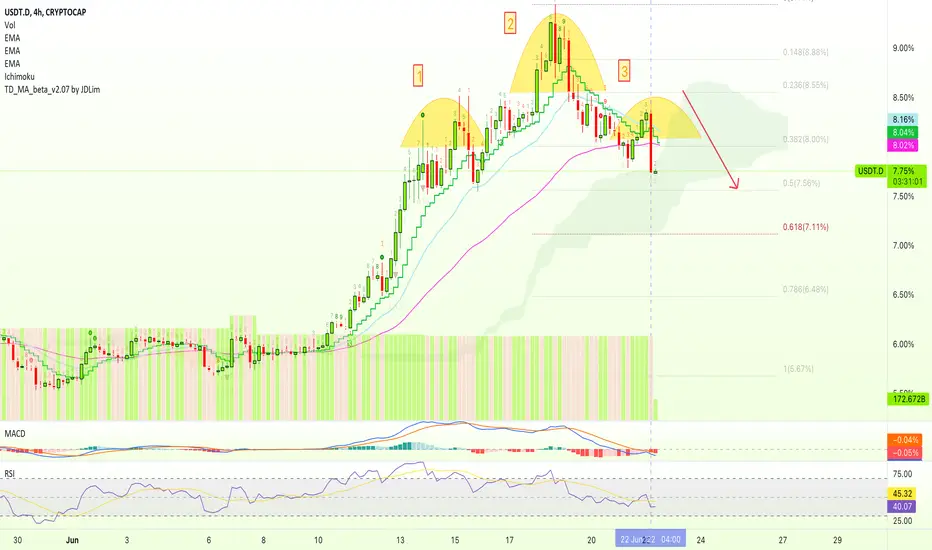
Tether Dominance | 3 Strikes & You Are Out! (Head & Shoulders) We have the 3 heads pattern on the Tether Dominance Index (USDT.D) chart.
This pattern is equivalent to the Head & Shoulders and we are all familiar with it.
It comes up at the top of a trend and signals a potential reversal.
The last candle that closed just minutes ago, marked on the chart (22 Jun '22 04:00), is very telling.
We can see a strong rejection in the form of a full bearish candle to push prices below all the main moving averages, that is EMA10, EMA21 and EMA50.
Both the MACD and RSI went from bullish to bearish, strong to weak...
And so we see a continuation of the bearish bias that we've been tracking thrgouh this index...
As USDT.D goes down, BTCUSD goes up.
Namaste.
Tether Dominance Index Top PatternWe have this triangle on the chart which is a "top pattern"; when you see this pattern or an inverted cup you have high probability of dealing with a top.
If prices topped, then we drop.
Just a quick update to let you know that we continue bearish on USDT.D.
The indicators are now also turning bearish, MACD and RSI.
It is likely to speed up, fast, if/when support breaks.
Namaste.
Have You Given Up?We say that the Tether Dominance Index (USDT.D) is set for a very strong drop very soon...
A new All-Time High was hit yesterday yet we continue to see signal after signal pointing to this rally being over-extended.
We looked at the weekly and daily timeframes in the past...
Let's take a closer look short-term, this is the 4H timeframe.
We have prices dropping after closing below EMA10.
We have bearish divergence with the MACD and RSI.
A bearish cross on the MACD while the indicator is strongly aiming lower...
It is only a matter of time...
We Never Give Up!
Namaste.
