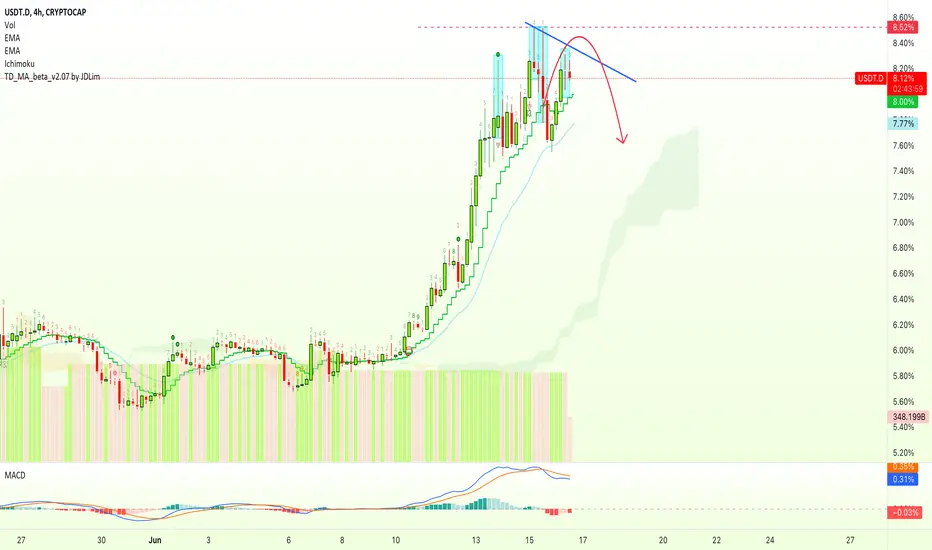
Tether Dominance Moved Higher But Bears Are ComingSince our last analysis, Tether Dominance Index (USDT.D) has broken the last resistance and gone higher... This is a "last hoorah" based on the chart candles and signals.
We have shooting stars, Dojis and hammers all at new highs/resistance.
Seeing these candles at new high prices can signal that the top is in.
What follows after a new top is a strong correction.
The MACD is also at new highs but trending lower after a bearish cross.
Sooner or later, rather very soon... USDT.D will drop strong and inversely Bitcoin will go up.
Namaste.
Usdtd
USDT Dominance may now go up, may fall below 7.66% Looks like!!Hello dear traders, we are new here so we ask you to support your ideas with your LIKE and COMMENT, feel free to ask any questions in the comments, and we will try to answer for all, thanks, Friends.
USD dominance 4 hours update looks like dominance may once be on the way and rejection from 7.66% should be considered as BTC is yet to dump around 13% so this is my view
Thank you for your time, we hope that our work is good for you, and you are satisfied, we wish you a good day and big profits.
Thank you

usdt dominance Well, the story that I was expecting was touched by friends of Trend Line, but it is possible that it will hit the ceiling again. (Beat will touch Channel 26 once again)
I look forward to returning from this area.
If the trend line is broken, it is very unlikely that I will give you a new analysis
This is just a personal view, not a buy or sell
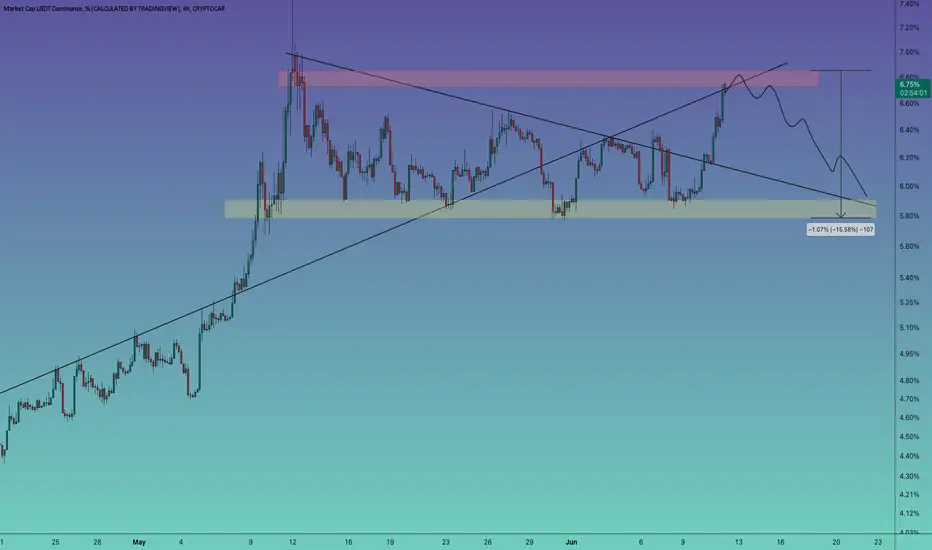
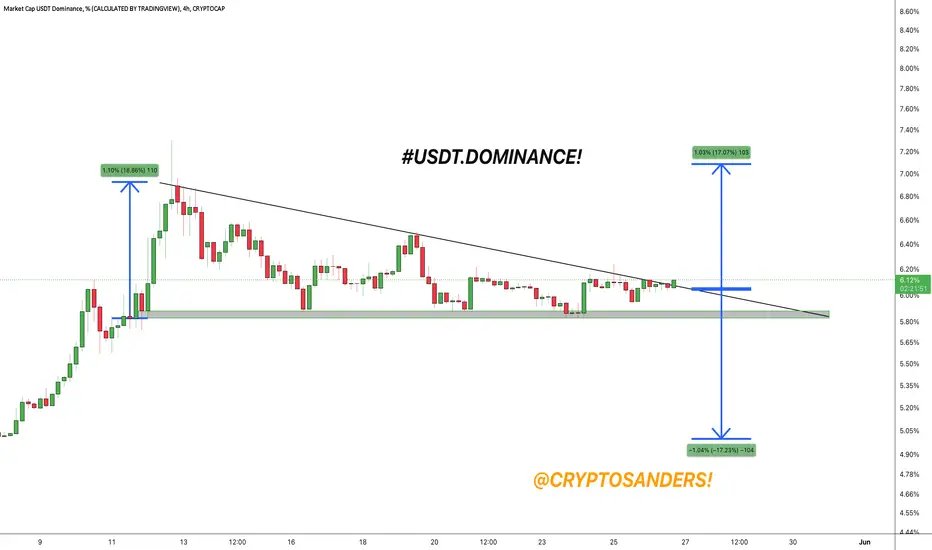
#USDT dominance may come now. Looks like it?Hello dear traders, we are new here so we ask you to support your ideas with your LIKE and COMMENT, feel free to ask any questions in the comments, and we will try to answer for all, thanks, Friends.
USDT dominance trading in its red zone area and using rejection from here is a force in dominance, so from here USDT dominance is down around 13% to 16%, which could see bullish momentum in the altcoin.
Thank you for your time, we hope that our work is good for you, and you are satisfied, we wish you a good day and big profits.
Thank you
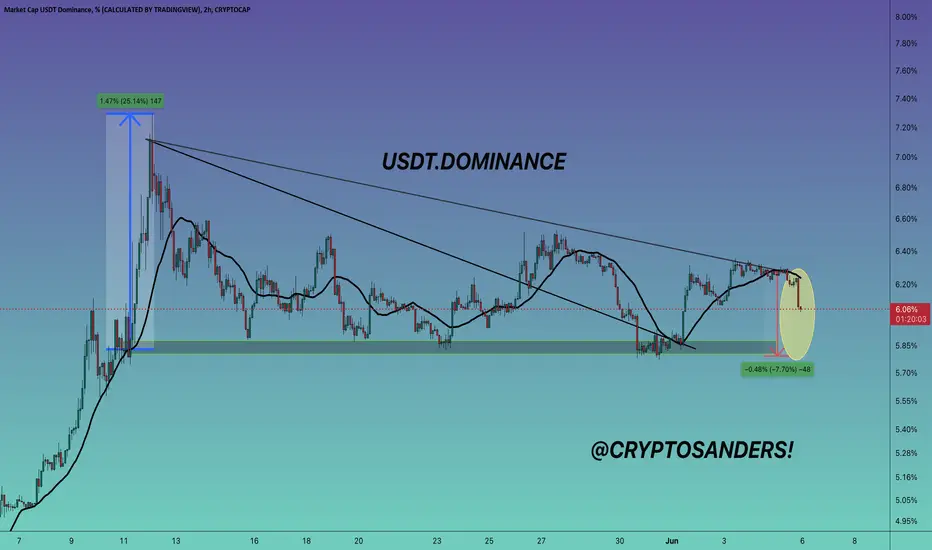
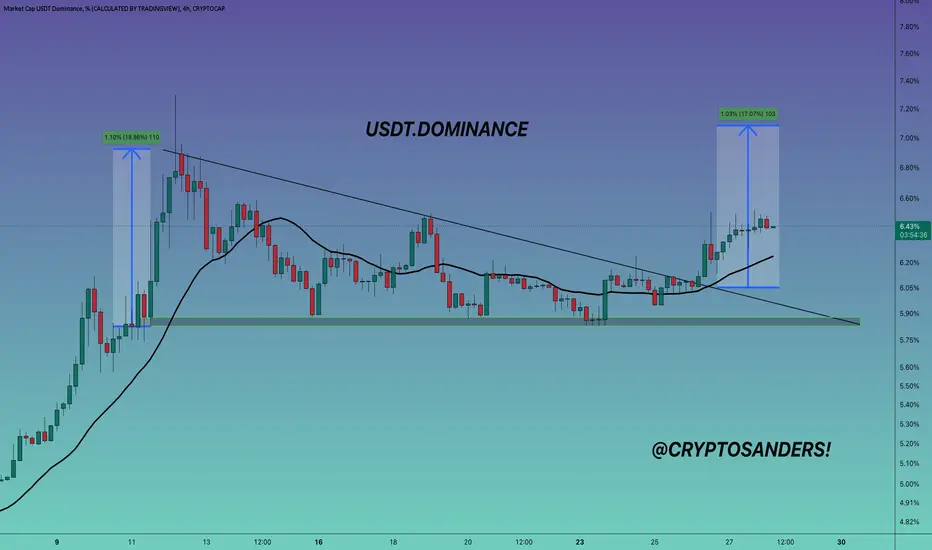
#USDT.DOMINANCE 2HOUR UPDATE BY CRYPTOSANDERS !!Hello dear traders, we are new here so we ask you to support your ideas with your LIKE and COMMENT, feel free to ask any questions in the comments, and we will try to answer for all, thanks, Friends.
Hello, dear traders welcome to this USDT.DOMINANCE 2hr chart analysis.
I have tried my best to get the best possible results in this chart.
As we can see in the chart mentioned above that USDT.D broke the upper trend line and pumped almost 6% which moved down n the altcoins 10% - 12%.
The current scenario is heading towards the resistance level and bull traders expect rejection.
Rejection from the resistance is the cure to recover from red to green in altcoins.
A candle close above the resistance will turn the scenario into the worst case.
Thank you for your time, we hope that our work is good for you, and you are satisfied, we wish you a good day and big profits.
Thank you

USDT Dominance Breakout and Retesting. USDT.D Update Hello my friends, This is an update of previous analysis (blow link). Consider USDT market cap to help identify market movement, Everything is marked on the chart. Good luck.
If its useful please like it as a support and follow me for next analysis :)
#USDT.DOMINANCE 4Hr UPDATE !!Hello dear traders, we are new here so we ask you to support your ideas with your LIKE and COMMENT, feel free to ask any questions in the comments, and we will try to answer for all, thanks, Friends.
Hello, dear traders welcome to this USDT.DOMINANCE 4hr chart analysis.
I have tried my best to get the best possible results in this chart.
Welcome friend I think you guys are doing good business. The dominance is broken and the 100MA rejection and altcoin pump the USDT pair! good profit.
Thank you for your time, we hope that our work is good for you, and you are satisfied, we wish you a good day and big profits.
Thank you

#USDT.DOMINANCE 4Hr UPDATE !!Hello dear traders, we are new here so we ask you to support your ideas with your LIKE and COMMENT, feel free to ask any questions in the comments, and we will try to answer for all, thanks, Friends.
Hello, dear traders welcome to this USDT.DOMINANCE 2hr chart analysis.
I have tried my best to get the best possible results in this chart.
Welcome friend I think you guys are doing good business. The dominance is broken and the 21MA rejection and altcoin pump the USDT pair! good profit.
Thank you for your time, we hope that our work is good for you, and you are satisfied, we wish you a good day and big profits.
Thank you
USDT.D OutlookUSDT.D got rejected from the trandline of around 6.36% after two tries. It is expected to go back to 6.00% and 5.67% giving BTC and Altcoins a fleeting relief.
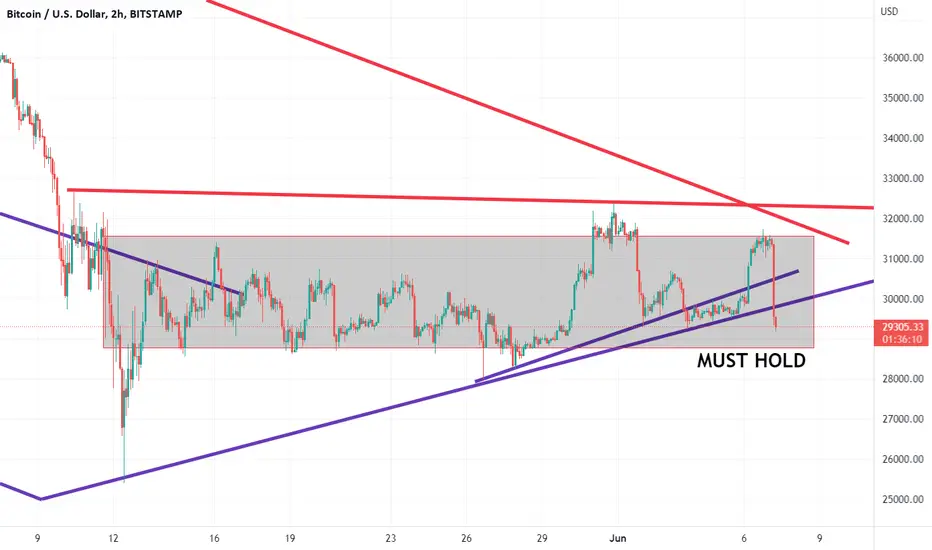
BTC Strange??Hi everybody, just a very brief post. Almost all the technical went wrong, but I am sure the 29K and a bit lower 28K MUST hold the price. Tether.D also reached 6.40% which is almost its weeks' high.
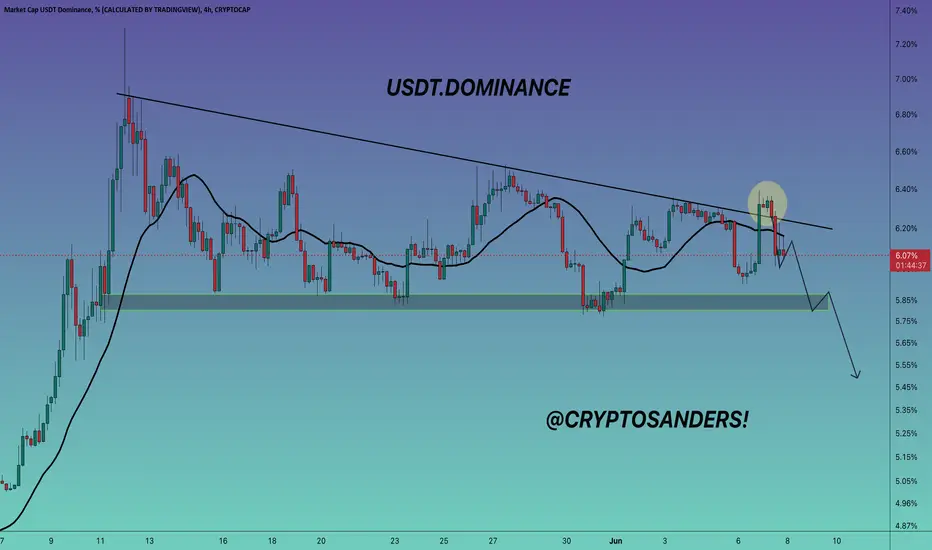
#USDT.DOMINANCE 2Hr UPDATE !!Hello, dear traders welcome to this USDT.DOMINANCE 2hr chart analysis.
I have tried my best to get the best possible results in this chart.
Hello dear traders, we are new here so we ask you to support your ideas with your LIKE and COMMENT, feel free to ask any questions in the comments, and we will try to answer for all, thanks, Friends.
welcome mate I think you guys are doing good trading. DOMINANCE is break and pumps altcoin usdt pair! good profit.
Thank you for your time, we hope that our work is good for you, and you are satisfied, we wish you a good day and big profits.
Thank you
#USDT.DOMINANCE 2Hr UPDATE !!Hello, dear traders welcome to this USDT.DOMINANCE 2hr chart analysis.
I have tried my best to get the best possible results in this chart.
Hello dear traders, we are new here so we ask you to support your ideas with your LIKE and COMMENT, feel free to ask any questions in the comments, and we will try to answer for all, thanks, Friends.
READY DOMINANCE is break and pumps altcoin usdt pair!
Thank you for your time, we hope that our work is good for you, and you are satisfied, we wish you a good day and big profits.
Thank you
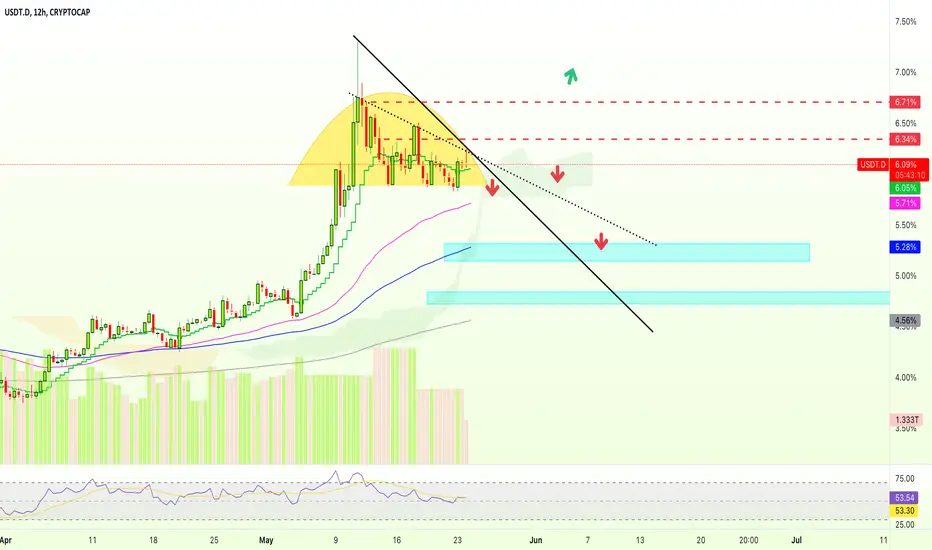
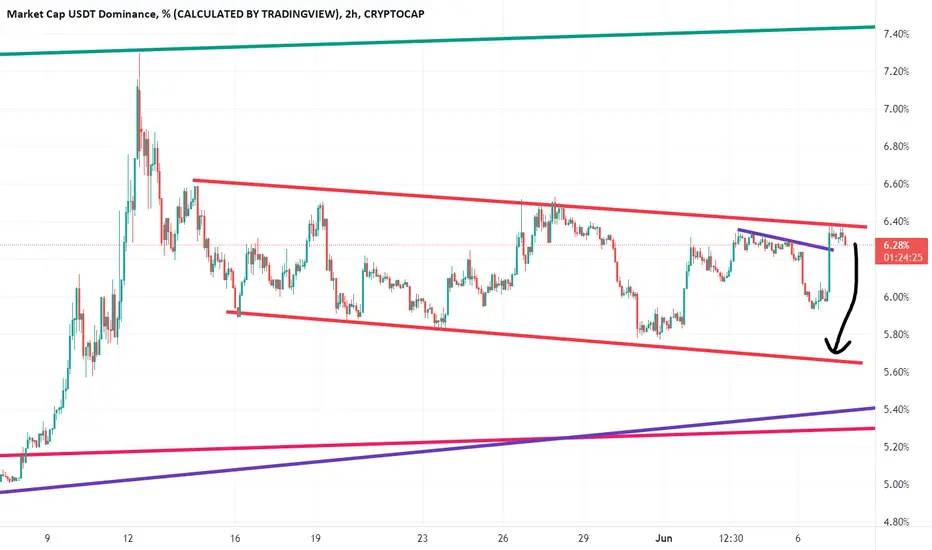
USDT.D OutlookUSDT.D has made a descending pattern and cannot already tolerate above 6% range. Falls' phases expected by: 1st: 5.90% -- 2nd: 5.30% -- 3rd: 4.20%

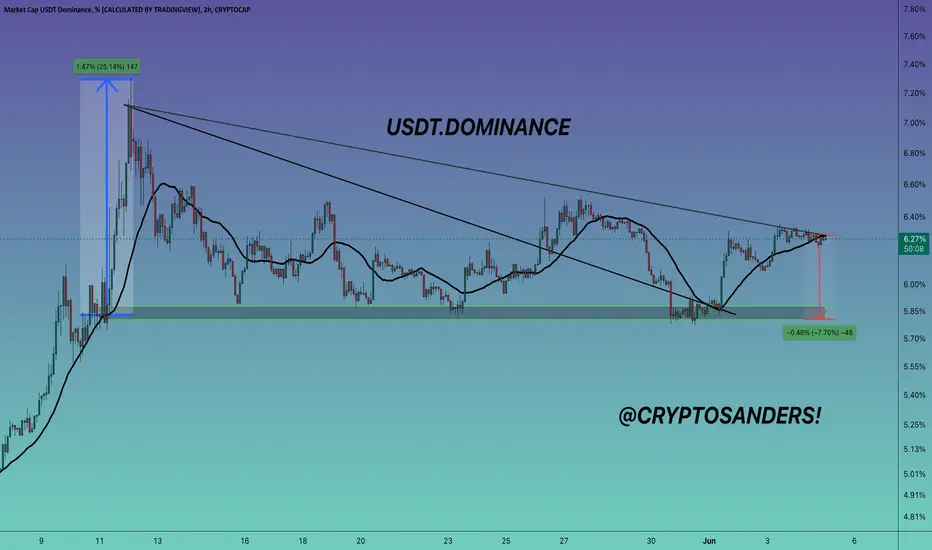
#USDT.DOMINANCE 2Hr UPDATE !!Hello, dear traders welcome to this USDT.DOMINANCE 2hr chart analysis.
I have tried my best to get the best possible results in this chart.
Hello dear traders, we are new here so we ask you to support your ideas with your LIKE and COMMENT, feel free to ask any questions in the comments, and we will try to answer for all, thanks, Friends.
As we can see at the above-mentioned chat that USDT.D again gained some % and currently trading below the resistance level here, it needs to reject from the thighs level to move downside which will be the right time to enter long positions.
Break above will lead USDT pair coin to bleed more.
Thank you for your time, we hope that our work is good for you, and you are satisfied, we wish you a good day and big profits.
Thank you

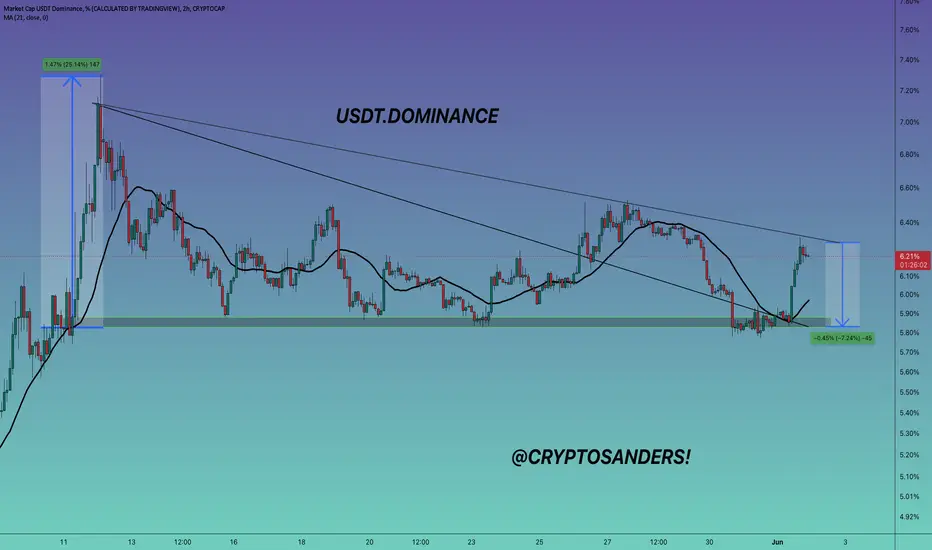
#USDT.DOMINANCE 2Hr UPDATE !!Hello, dear traders welcome to this USDT.DOMINANCE 2hr chart analysis.
I have tried my best to get the best possible results in this chart.
Hello dear traders, we are new here so we ask you to support your ideas with your LIKE and COMMENT, feel free to ask any questions in the comments, and we will try to answer for all, thanks, Friends.
As we can see from the above chart, USDT.D is currently trading on an upside momentum from the formed triangle pattern,
and downside retest and 5.87% and altcoin is the pump and usdt pair coin.
Thank you for your time, we hope that our work is good for you, and you are satisfied, we wish you a good day and big profits.
Thank you
Bitcoin To Continue Higher as Tether Dominance Goes LowerWe continue seeing bearish signals on the Tether Dominance Index (USDT.D) chart.
Yesterday we looked at the long-term chart and the RSI (weekly), the signals were clear there.
Looking at it closer today, our view remains the same.
- We can see prices moving below EMA10 on a full bearish candle.
- The RSI is trending down strong.
These signals are pointing lower.
The blue space on the chart is the main target/support.
Namaste.

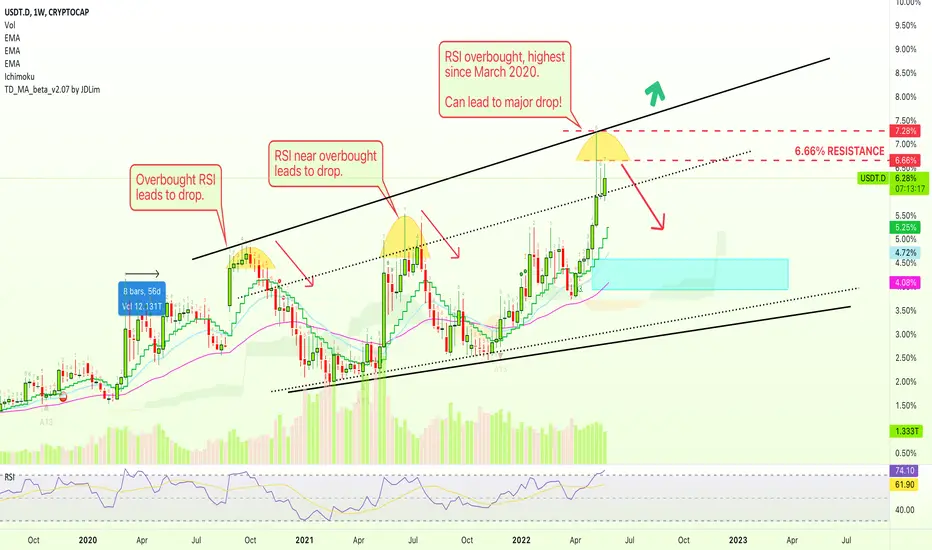
Tether Dominance Overbought | Long-Term RSI AnalysisHere we have a pretty clear as well as strong signal coming out of the weekly RSI for the Tether Dominance Index (USDT.D) chart.
Each time the RSI went to overbought, or just got close to it, Tether Dominance would enter a correction phase.
We have now USDT.D overbought which can signal that it is about to move lower based on past history.
With the inverse correlation between Bitcoin (BTCUSD) and Tether Dominance (USDT.D), we can see BTC rise while USDT.D falls.
Thank you for reading.
Thanks a lot for your continued support.
Namaste.
USDT.DOMINANCE 4HOUR UPDATE !!Hello dear traders, we are new here so we ask you to support your ideas with your LIKE and COMMENT, feel free to ask any questions in the comments, and we will try to answer for all, thanks, Friends.
I have tried my best to get the best possible results in this chart.
Hello, dear traders welcome to this USDT.DOMINANCE 4hr chart analysis.
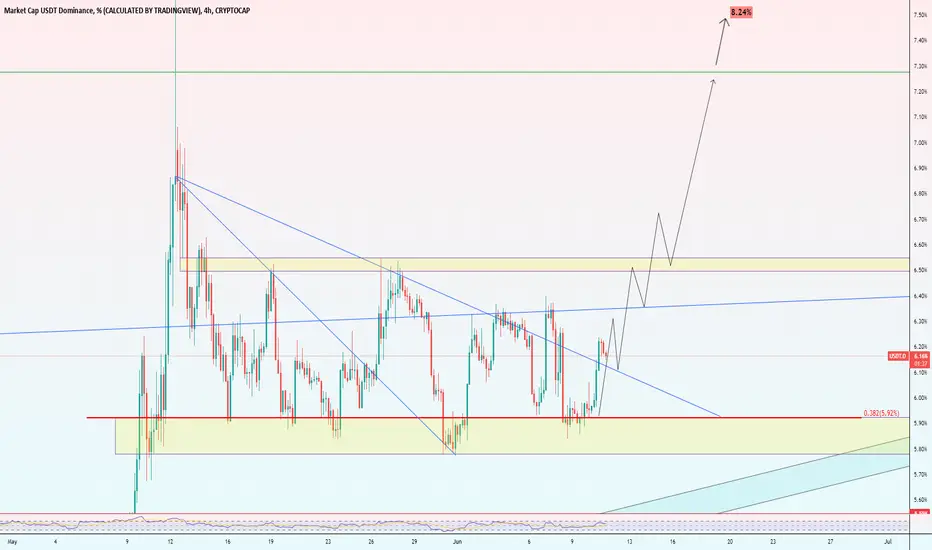
As we can see from the above chart, USDT.D is currently trading inside a symmetrical triangle pattern created, and the upper side brake and retest and usdt dominance
is bounce sand target 7.08.
Thank you for your time, we hope that our work is good for you, and you are satisfied, we wish you a good day and big profits.
Thanks.
Can Tether Dominance Break The 6.66% Resistance?Tether Dominance (USDT.D) is showing bullish signals and has short-term bullish potential as it is trading above EMA10.
But I am not convinced...
I see resistance ahead.
Namaste.

#USDT.DOMINANCE UPDATE !!Hello, dear traders welcome to this USDT.DOMINANCE 2hr chart analysis.
I have tried my best to get the best possible results in this chart.
Hello dear traders, we are new here so we ask you to support your ideas with your LIKE and COMMENT, feel free to ask any questions in the comments, and we will try to answer for all, thanks, Friends.
As we can see from the above chart, USDT.D is currently trading inside a symmetrical triangle pattern created, and the upper side brake and retest and usdt dominance
is bounce sand target 7.08.
A break below the upper trend line level would trigger the USDT pair altcoin is pump
Here if USDT.D breaks down it may move towards the 5.20% level.
Thank you for your time, we hope that our work is good for you, and you are satisfied, we wish you a good day and big profits.
Thanks.
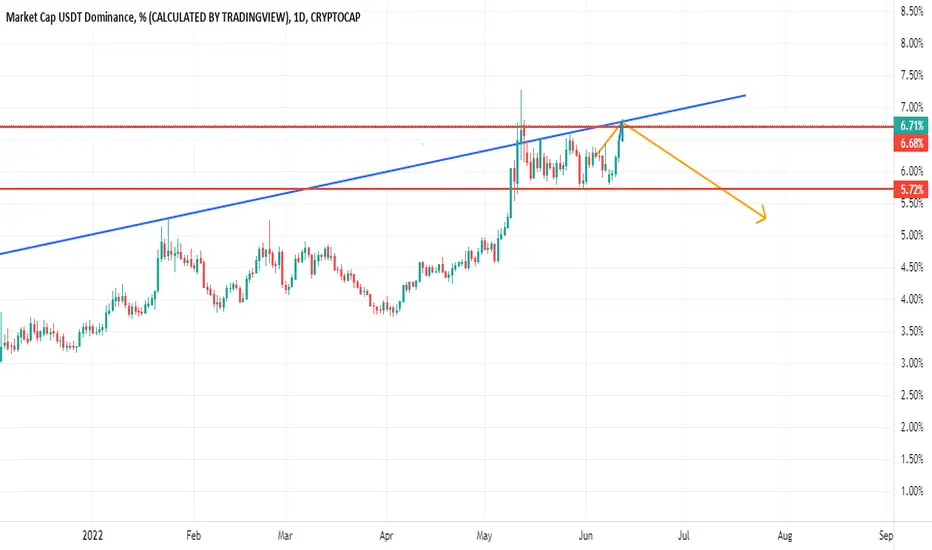
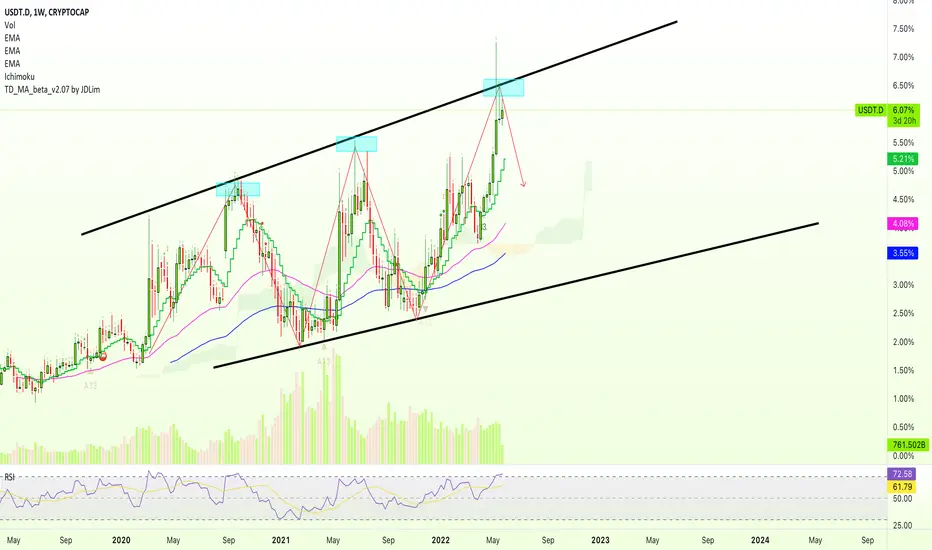
Tether Dominance Still MixedTether Dominance (USDT.D) hit an All-Time High this very month, just as Bitcoin (BTCUSD) went through the worst drop in several years.
This chart is not weak but a high has been hit.
Each time the upper trendline is hit, we tend to have a correction.
This is a mixed situation... But the volume is lower now compared to June 2021.
So USDT.D is likely to correct...
Still, this is a difficult chart.
Namaste.
Tether Dominance UpdateWe see that USDT.D move above EMA10 but we are now having a rejection candle...
This candle closes in 6 hours but if it remains red, the bearish potential, short-term, remains strong.
See before yesterday's article for more below:
Namaste.