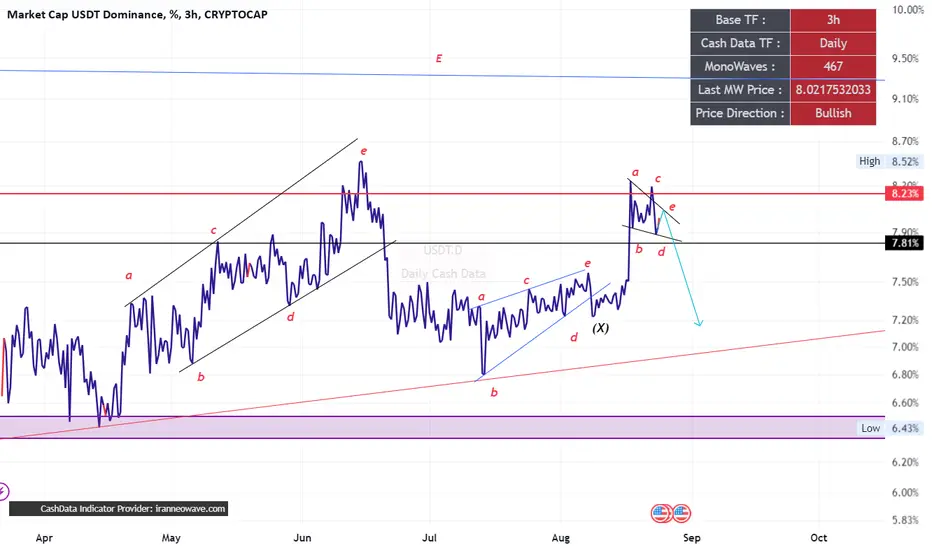
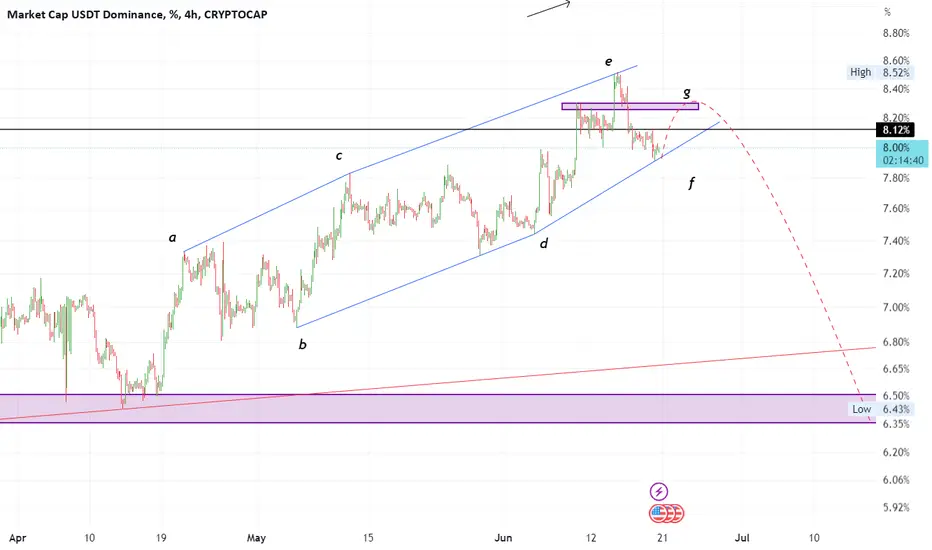
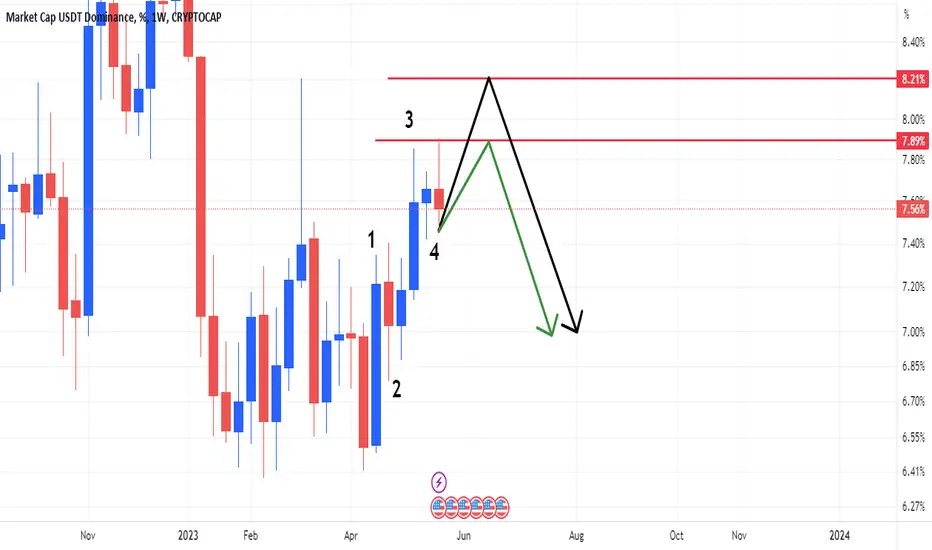
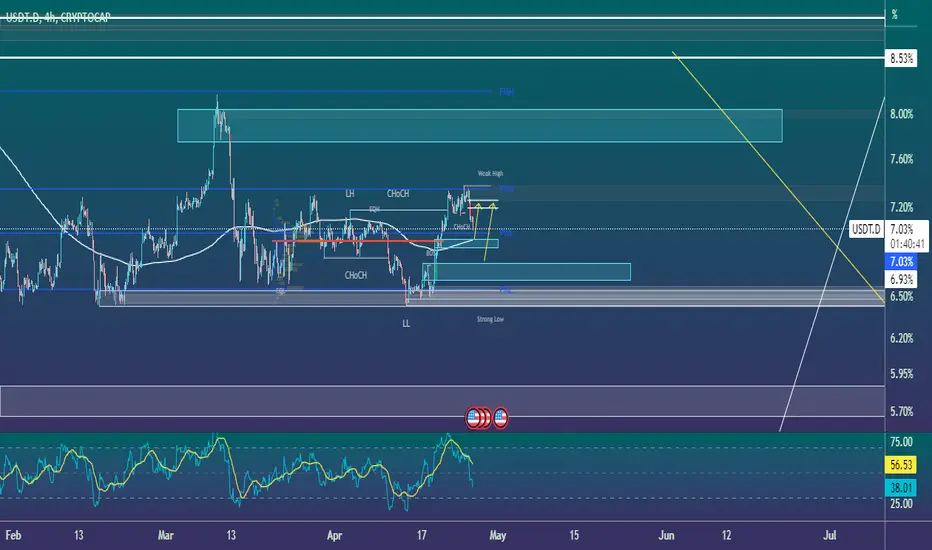
USDT.D(based on NEo wave)This is all of the E wave on daily TF but I am suspicious about the last branch , in the first sight it is triangle but it could be another patterns.the confirmation is breaking down the black line as I drew.
Usdtd
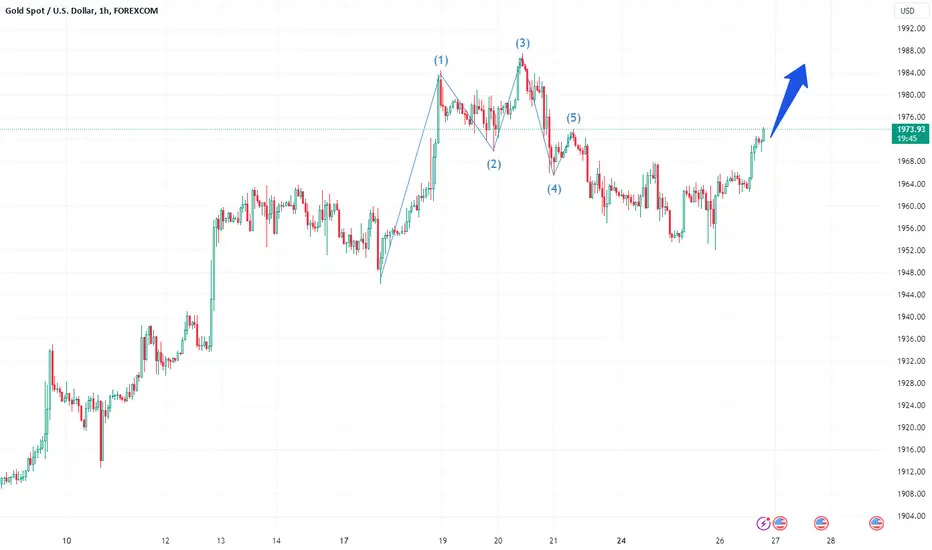
Who Said Trading Gold Isn't Profitable?
Follow the signal and remember to come to the base to contact me. I have always focused on real-time trading signals. Don't blindly follow trends.
USDTAccording to this wedge, it will be broken up and the target is drawn so we have to be ready to take short position for others.
📈 A Year Long Head & Shoulders Pattern & Volume SignalLooking at USDT.D short-term we can see lots of weakness.
Looking at USDT.D long-term we can see a pattern of decreasing volume.
We have a year long Head & Shoulders pattern, a huge pattern, that will lead to a massive crash on this index, money will flow from this and other stablecoins to Bitcoin and the Altcoins as the Cryptocurrency market grows.
This long-term volume dropping pattern tends to precede a massive crash.
If you notice Bitcoin and many Altcoins, their volume lately has been up to All-Time Highs.
Since these are growing, their volume hits new highs and continues to go up (in 2023).
Since Tether Dominance is set to shrink, its volume continues to go lower and lower until there is a breakout and the bearish volume has a strong increase.
Let me show you three examples using some of the biggest exchanges.
Here is Bitcoin's volume long-term on Binance | BTCUSDT (see the increase)
Volume is going up, while USDT.D volume has been going down.
On KuCoin volume has been growing since 2020
Coinbase is the same...
Just some examples, because the dropping volume on the USDT.D chart is pretty obvious.
Namaste.

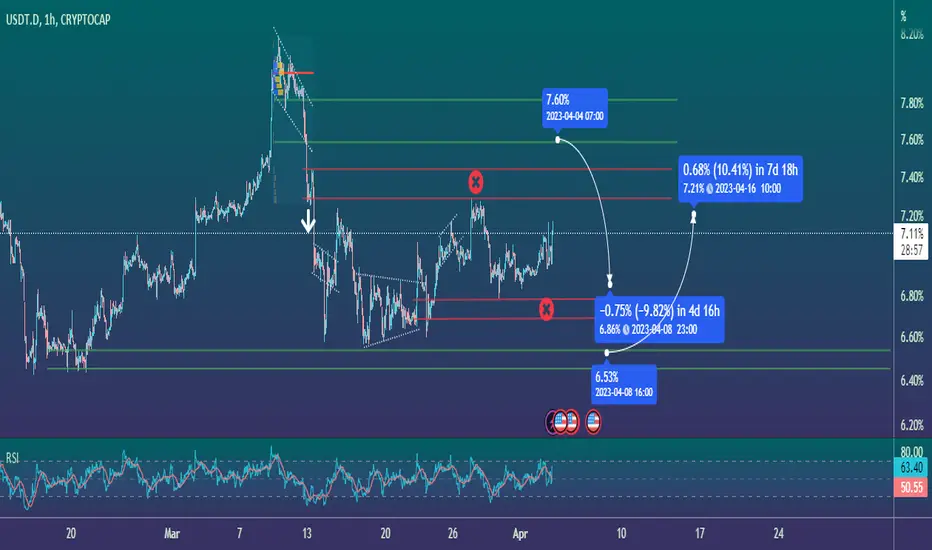
USDT Dominance Downward from supply zones 👀 USDT.D Hello my friends, Consider USDT market cap to help identify crypto market movement, Everything is marked on the chart. Weakness in trend and supply zones ahead.
Good luck.
If its useful please like it as a support and follow me for next analysis :)
.
Salam doostan aziz, USDT.D ro baraye komak dar tashkhis jahat harkat market crypto dar nazar begirid. hame chiz rooye chart baraye shoma moshakhas shode. za'f dar ravand darim va 2 nahiye arze dar pishe ro.
moafagh bashid.
like va follow faramoosh nashe :)
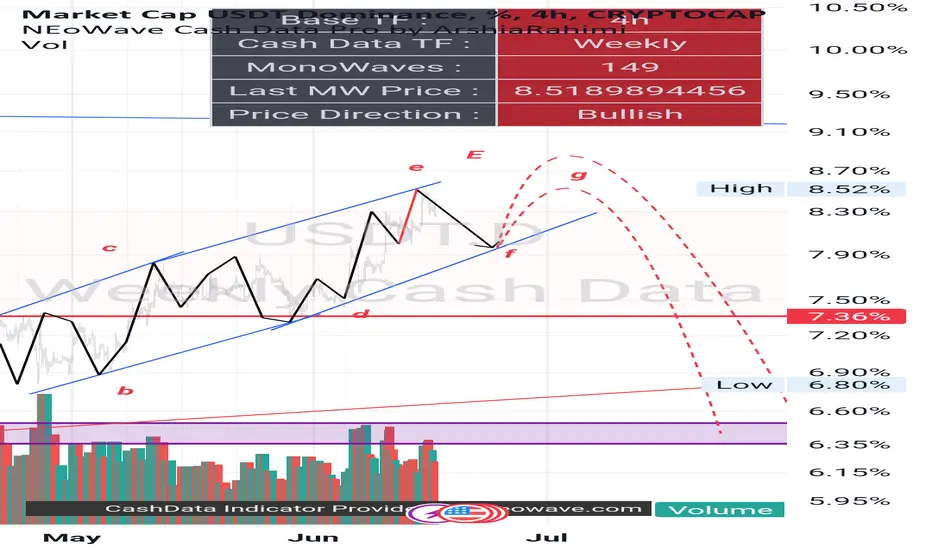
USDT.D(based on NEo wave)updatedso if 8.12 breaks we have that confirmation for G wave and I will buy more step by step.
so confirmation for the down trend is after G wave the down trend breaks. after that you can risk it free!
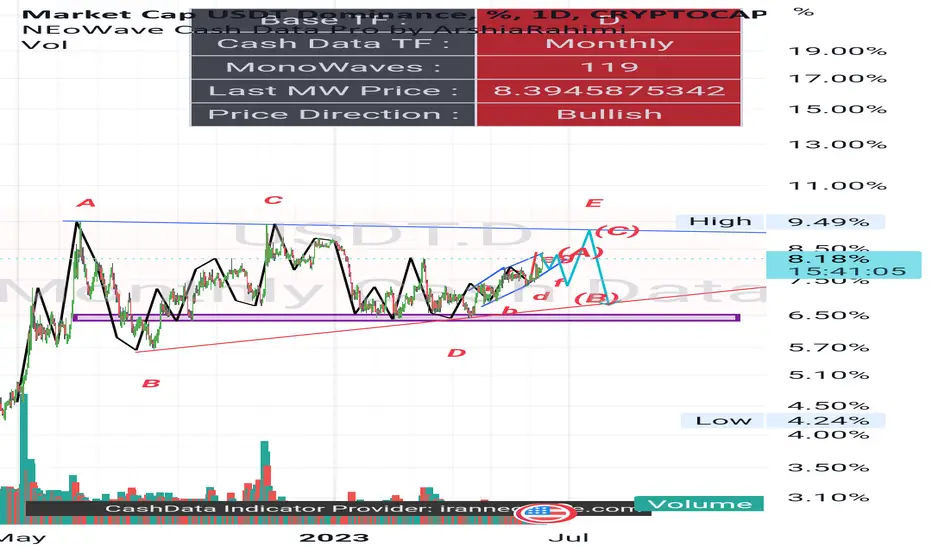
Usdt.d(based on NEo wave)updatesSo I think this diamond diametric is the last corrective wave and it will spend enough time for triangle pattern on weekly cash data. After this corrective wave crypto market should start a good wave to grow , so make yourself ready!
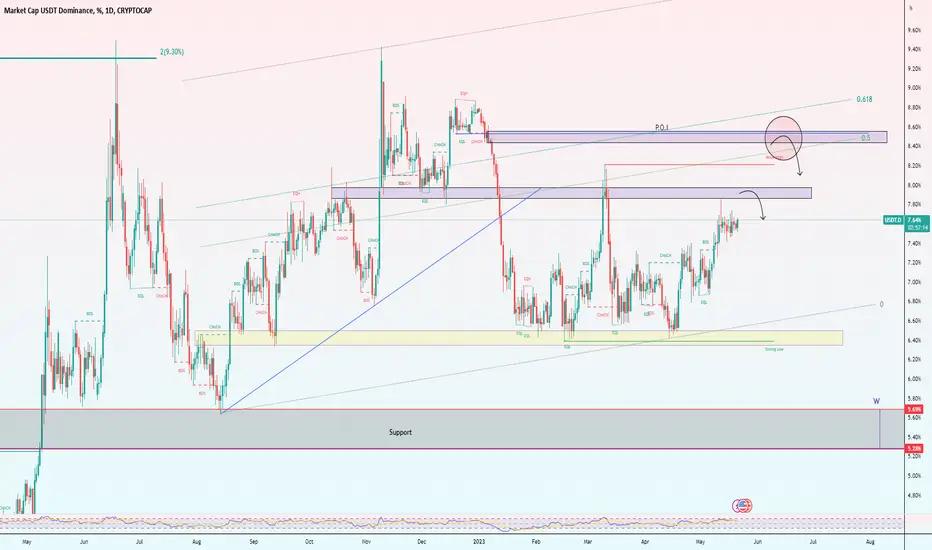
Usdt.d(based on NEo wave)There is 2 possibilities for theter dominance.
In both we are in a big triangle and this is the end wave.
This is a first way of it
It is on aa first branch of wave E and this branch is diamond diametric. This correction can continue for the up trendline of triangle. By crossing the down trend of triangle we have a confirmation for a party on crypto market.
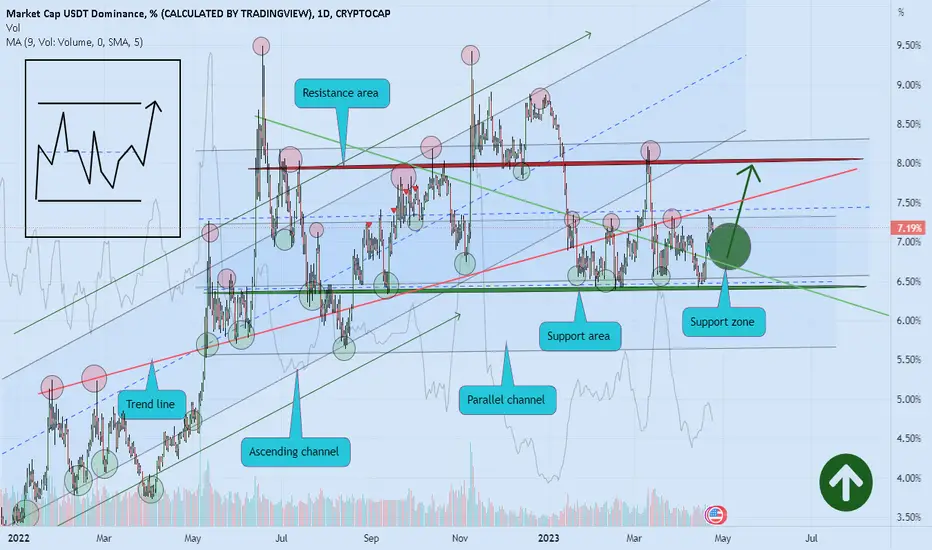
TETHER DOMINANCE brief gain 💣🚀Hello 🐋
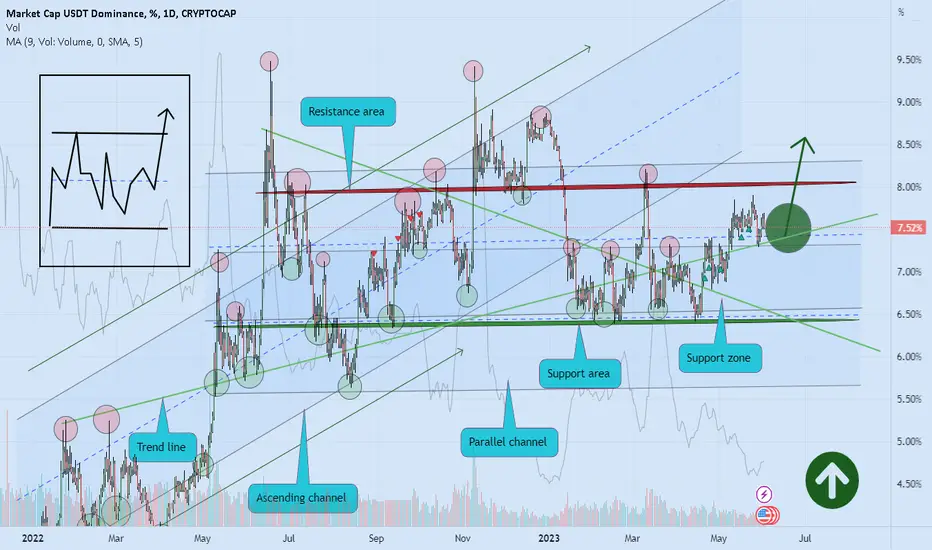
Based on the chart, the price is close to the support area and parallel channel support ✔️👌
if
the price doesn't break the support zone to the downside, we will see brief gain again 💣🚀
and
in long time more correction expected 💣🚀💣
👌 Notice: pay attention to the price on shortcut chart (located above the main chart with black colour) 📖💡
Please, feel free to share your point of view, write it in the comments below, thanks 🐋
TETHER DOMINANCE brief gain 💣🚀Hello 🐋
Based on the chart, the price is close to the support area and parallel channel support ✔️👌
if
the price doesn't break the support zone to the downside, we will see brief gain again 💣🚀
and
in long time more correction expected 💣🚀💣
👌 Notice: pay attention to the price on shortcut chart (located above the main chart with black colour) 📖💡
Please, feel free to share your point of view, write it in the comments below, thanks 🐋

TETHER DOMINANC even more gain expected 💣🚀Hello 🐋
as I mentioned in my previous analysis 💣🕶️💣
the price hit the target, and we saw more gain 💣🕶️💣
and
now we expect brief gain again 🚀
and
in long time more correction expected ❌🧨
👌 Notice: pay attention to the price on shortcut chart (located above the main chart with black colour) 📖💡
Please, feel free to share your point of view, write it in the comments below, thanks 🐋

usdt.dFriends, I specified the ascending targets.
Beware of the possible fall of Bitcoin and Ethereum and the crypto market. (Warning)
Good luck
Karim Heydari
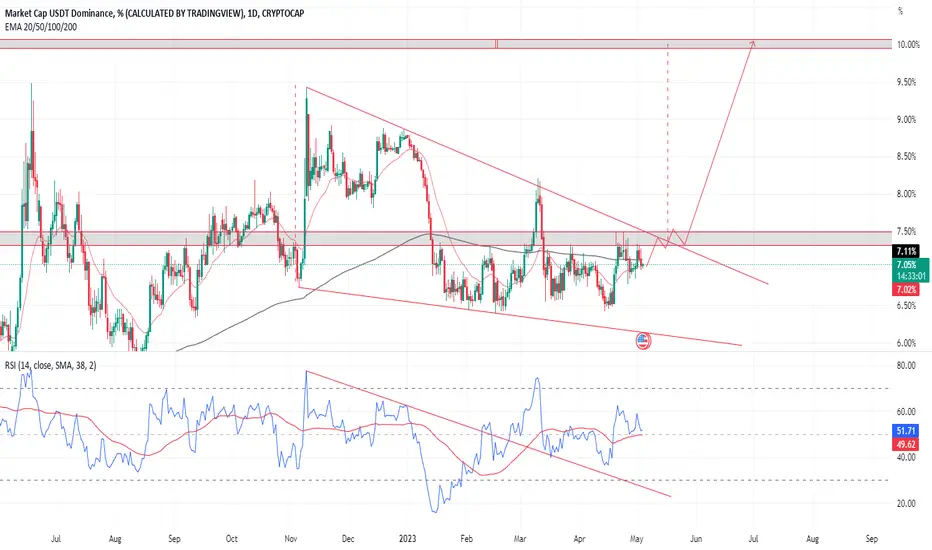
📈 Tether Dominance | Long-Term Lower Highs Bearish ConfirmationTether Dominance has been fighting to stay above EMA50 weekly since the year started, January 2023 and things aren't looking good for this index.
✔️ When Tether Dominance (USDT.D) goes down, everything Crypto (Bitcoin + Altcoins) goes up.
Tether Dominance closed last week above EMA10/21 just to be pushed lower once more, EMA50 working as support.
The longer a support level is challenged, the weaker it becomes.
Four and a half month EMA50 becoming weaker and weaker...
Since June 2022 we get lower high after lower high... Confirming the bears have the upper hand or else we would be seeing higher highs instead.
There are more bearish signals:
Trading volume keeps going lower and lower.
The RSI continues moving lower and lower, now below 50.
Bitcoin has one more bullish wave to give and we have an inverse relation between these...
It is the same chart, the same pattern we've been looking at now for many months... USDT.D peaking and consolidating before the next drop (distribution).
The longer it takes to break down, the stronger the drop when it comes.
It is very hard to invalidate this chart setup...
We would need to see a weekly close above 8.25%... So far it continues looking red.
This is confirmation. A bullish signal for Bitcoin and the Altcoins.
Thanks a lot for your continued support.
Namaste.
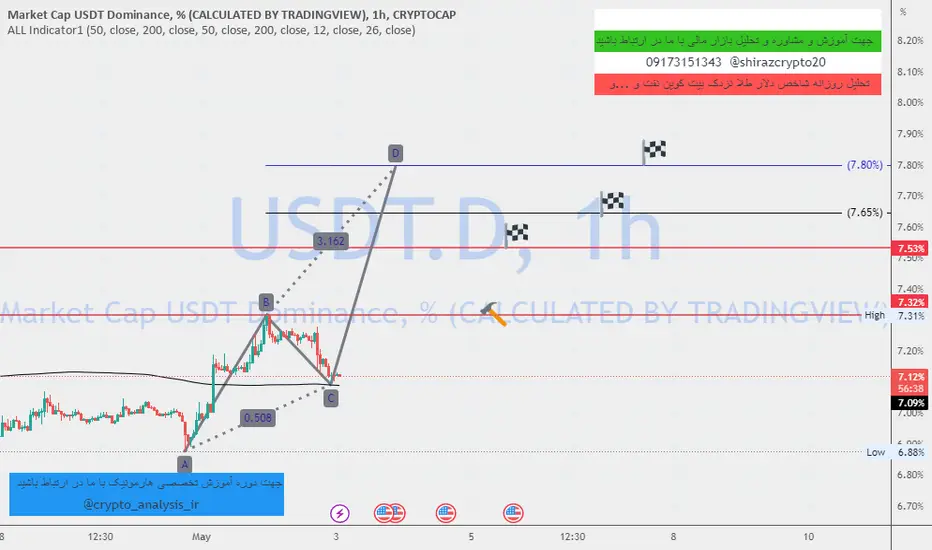
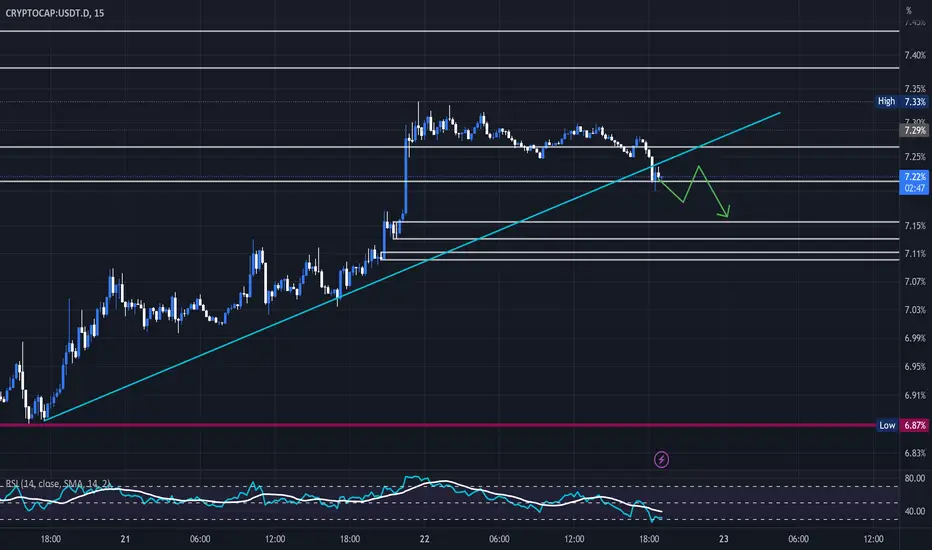
USDT.D🔵🐇 💵 #USDT.D | 1 H
🪄Usdt.d Based On Fresh Liquidity and Order Blocks and Structures
📍There are two area for usdt.d short term reaction
and making a bullish temporary pivot
Watch out
Usdt.d Move Opposite of Bitcoin
#eth #btc #bitcoin #ethereum #cryptocurrency #crypto #Trade #trading #Invest #Trader #Signal #forex #Scalp #altcoins #chart #RTM #ICT
@Aliceinmoneyland
TETHER DOMINANCE more gain 💣🚀Hello 🐋
Based on the chart, the price is close to the support area and parallel channel support ✔️👌
if
the price doesn't break the support zone to the downside, we will see brief gain again 💣🚀
and
in long time more correction expected 💣🚀💣
👌 Notice: pay attention to the price on shortcut chart (located above the main chart with black colour) 📖💡
Please, feel free to share your point of view, write it in the comments below, thanks 🐋
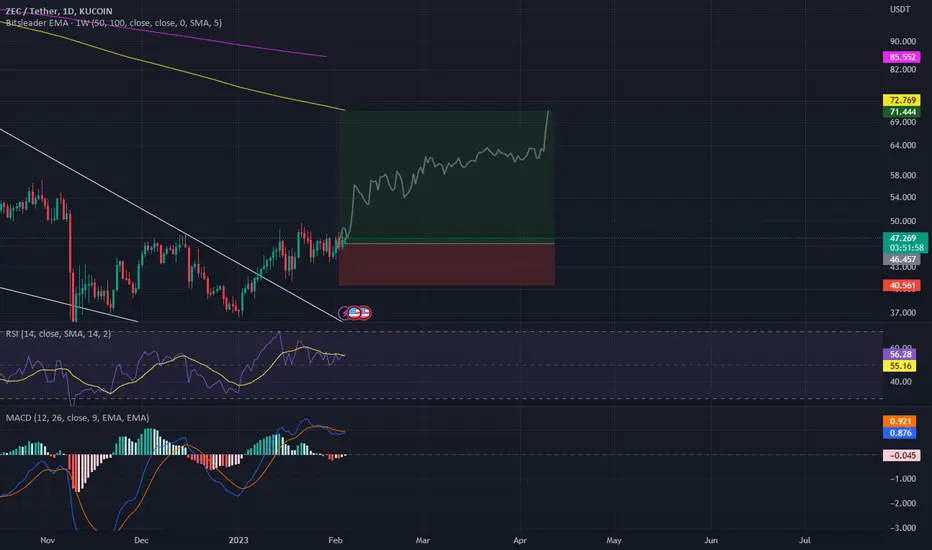
ZEC to hunt 50 Weekly Moving AVGI have been monitoring the ZCASH / ZEC for a while, it's lookin so bullish, it's golden opportunity to get long until 70$ with the stop loss of $40
we could see a little pullback before going to 70$
this is definitely a financial advice, manage your risk well. don't forget to put stoploss
📈 Tether Dominance Monthly & The End Of The WorldWe looked at this timeframe once in the past and this is a very important one.
Tether Dominance closed last month on a strongly bearish candle, this month it is moving again below EMA10... USDT.D has been below EMA10 monthly only a few sessions in its entire existence... This is a major development and ultra-bullish for the Cryptocurrency market; Bitcoin & Altcoins growth.
It is really hard to belief because the world is ending for the 1 millionth time and as the world ends it is impossible to imagine anything positive happening but remember, the world has been ending ever since the day it was borne.
Listen, when something, somewhere goes down, something else in some other place goes up.
For example, the end of the world was Covid or the 2008 financial crisis, or 1929, or the revolution, or the World War, etc... It continues, it never really ends...
Back to my point, when Covid was launched, a huge portion of the world was hit very, very baldly but at the same time an entire portion that was suffering for a long time started to thrive.
My point is that energy cannot be created or destroyed it changes from one state to another.
✔️ If one industry goes down, another goes up.
✔️ If one country is going down, another one is rising up.
✔️ If a system is dying, a new one is being born.
Yes, there is negative in this world but look at the positive...
The positive is us, LIFE!
The world is not over... It is never ending, it is ETERNAL!
Get back to work!
Namaste.

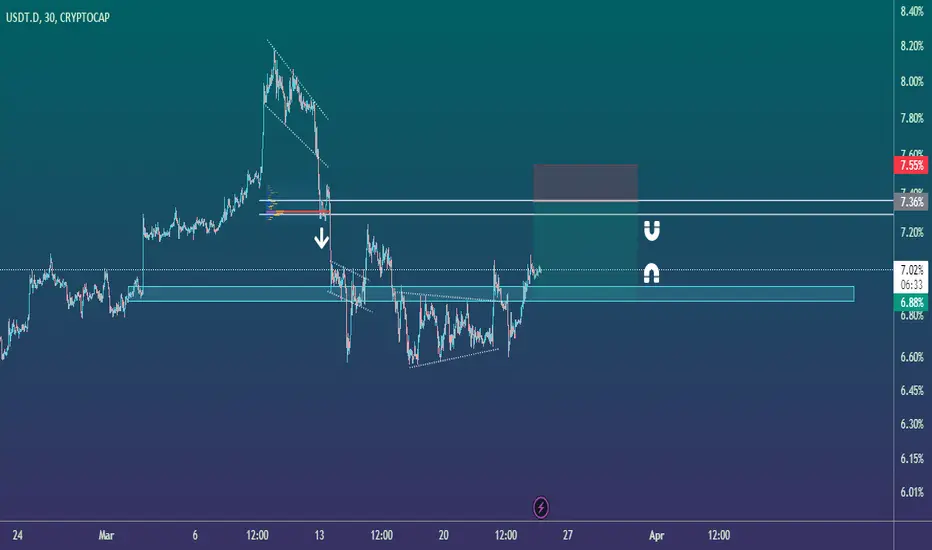
USDT.D🐇USDT.D
🪄 We Have 2 Liquidity Zone In USDT.D ( Red Zone ) . these two area are not fresh anymore because price reached Them Once ! We Have Two Fresh Liquidity Area ( Green Zone ) . If USDT.D reach around them you can check that for opposite position in crypto market for short term ! Do Not Forget USDT.D Move Against Crypto Market !
#eth #btc #bitcoin #ethereum #cryptocurrency #blockchain #crypto #coinbase #bitcoins #trading #money #investing #forex #cryptocurrencies #altcoins #bitcoinnews #investor #altcoin #hodl #binance
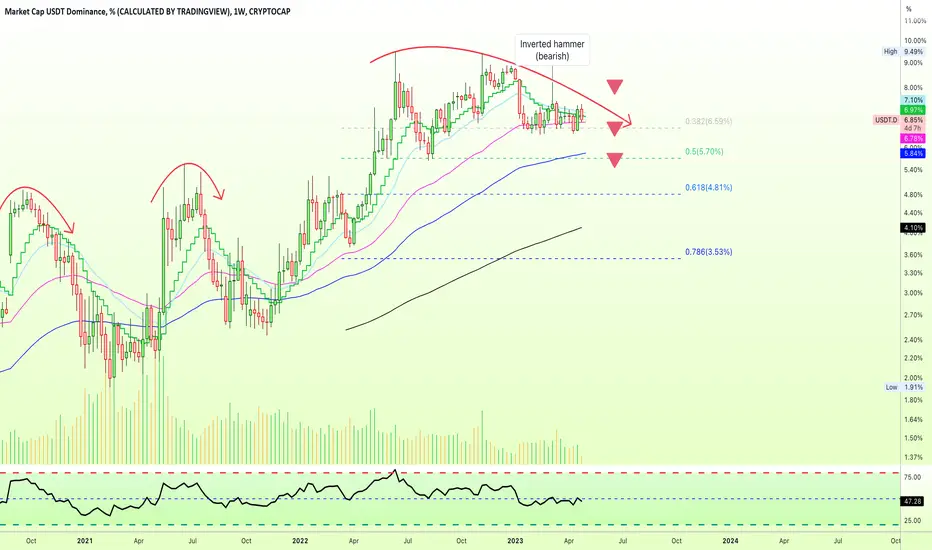
📈 Tether Dominance Replete Of Bearish SignalsSince everything I share is bullish, it is good to read the Tether Dominance chart to look at some of the bearish signals, for learning and entertainment.
We have the lower highs mixed with candlestick reading.
1) The inverted hammer as a lower high (double strength).
2) Doji after lower high inverted hammer (triple strength bearish signal).
3) Rejection at EMA10 and EMA21 (additional confirmation more strength to previously noted bearish signals).
4) MACD moves below 0 trading below signal line.
5) RSI trending lower and downtrend since June 2022.
We want to see the action... Let it drop!
Let the entire Cryptocurrency (Bitcoin + Altcoins) market go up.
Namaste.

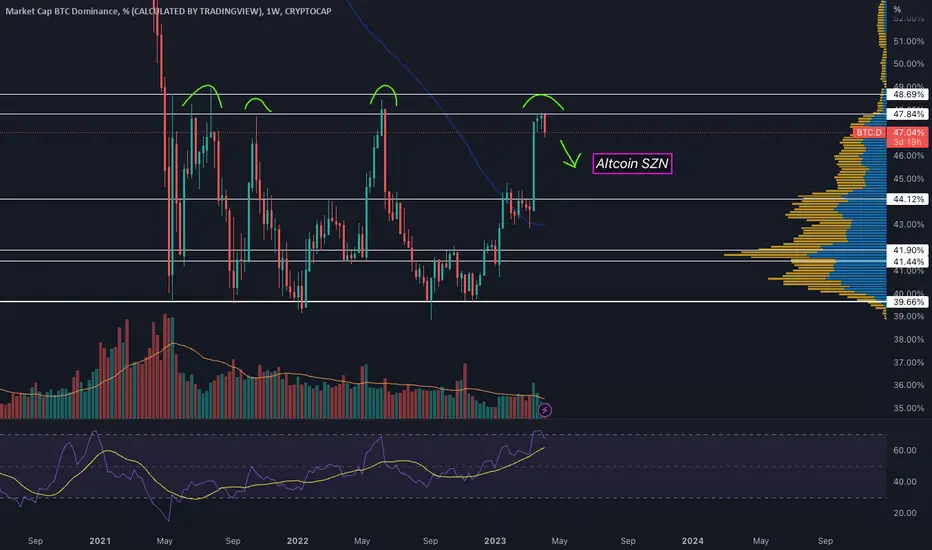
BTC.D at resistance... time for Alts to shine? BTC.D is clearly at the top of this macro range.
USDT.D is also dropping.
This means we may see a mini alt season as alts follow BTC's recent rally.
One counter-argument is ETH Shanghai update - Lots of staked ETH will be (is?) getting unlocked, which could create a lot of sell pressure.
Some very crypto/finance savvy friends are shorting ETH here.
ETH makes up a huge % of TOTAL2 (altcoin market cap), so if ETH does start selling off, this idea will be invalidated, USDT.D will pump instead, and alts will bleed.
Good luck out there...
Happy trades
CD
USDT.DYou Can Looking For ShortTerm Long On CryptoMarket Around Usdt.d Liquidity zone Level as a resistance
#btc #bitcoin #cryptocurrency #blockchain #crypto #ethereum #eth #money #bitcoinmining #forex #trading #litecoin #bitcoins #bitcoinnews #investing #behindthechair #coinbase #investor #cryptocurrencies #investment #ripple #entrepreneur #bitcoinprice #modernsalon #business #ltc #wallstreet #invest #bitcoinbillionaire #binary