📈 Tether Dominance Monthly, First Time Ever! (4.10% Next)This is the first time ever we look at Tether Dominance on the monthly timeframe.
This is extreme bearishness what I am seeing here.
Let's start at the end, the stage is set for a drop to 4.10% minimum, that's the conclusion.
I mentioned that this would translate to Bitcoin at around ~$40,000.
Notice the "~" symbol, which means more or less as it should range between $38,000 and $42,000 when the time comes, which is soon.
USDT.D already printed an upper wick and trading near the low of the current session/candle.
The current candle trades below EMA10 on a very, very strong bearish bias.
✔️We have a massive rising wedge that already broke bearish.
✔️We have lower highs long-term (more than 6 months).
✔️And volume going lower and lower.
The volume will only increase again when the major drop comes.
As USDT.D goes down, Bitcoin and the Altcoins goes up.
✔️ Please make sure to Boost to help with your support.
Thank you for reading.
Namaste.
Usdtd

📈 Tether Dominance Long-Term Bearish Trend ConfirmedLast week closed as an inverted hammer and this was the "last hooray".
EMA50 still stands as support but we have multiple lower highs since June 2022.
The weekly MACD just entered the bearish zone:
The weekly RSI is also showing a strong bearish bias:
All the USDT (Tether) will be used to buy Bitcoin and Altcoins.
Here we can see clearly on the daily timeframe how MA200 has been lost as support:
Below this level Tether Dominance is always bearish.
Notice bear volume being at its highest since November 2022 when USDT.D started to decline.
The next drop will send USDT.D to around 4.81%, a major drop.
This is the level it traded at around April 2022, this would mean Bitcoin trading at about $40,000.
There is strong support at this level just as Bitcoin will face strong resistance at $40k.
Everything is pointing in the same direction... Bitcoin will grow like the world is ending... But the world isn't ending, it is just the end of an era where a new financial system will emerge.
✔️ Bitcoin is the future of money.
✔️ Cryptocurrency is the future money.
✔️ Bitcoin is the present of money.
✔️ Bitcoin is very likely to save us from another 2008.
Namaste.

USDT.DAs mentioned in the previous analysis, Dominance Tether also reached the support range as expected and we saw growth in the market as a whole, but we are still involved in a very strong range of 6.5 to 7.3% in Dominance Tether, which is more likely to break out of the bottom with time correction. Which will naturally lead to breaking the ceiling of 26000 in Bitcoin and moving towards higher goals. In the meantime, with this index suffering at the bottom and ceiling of this range and even retesting the downward trend line according to the Bitcoin Dominance analysis, we can correct the price of altcoins and suffer or correct the price of Bitcoin.
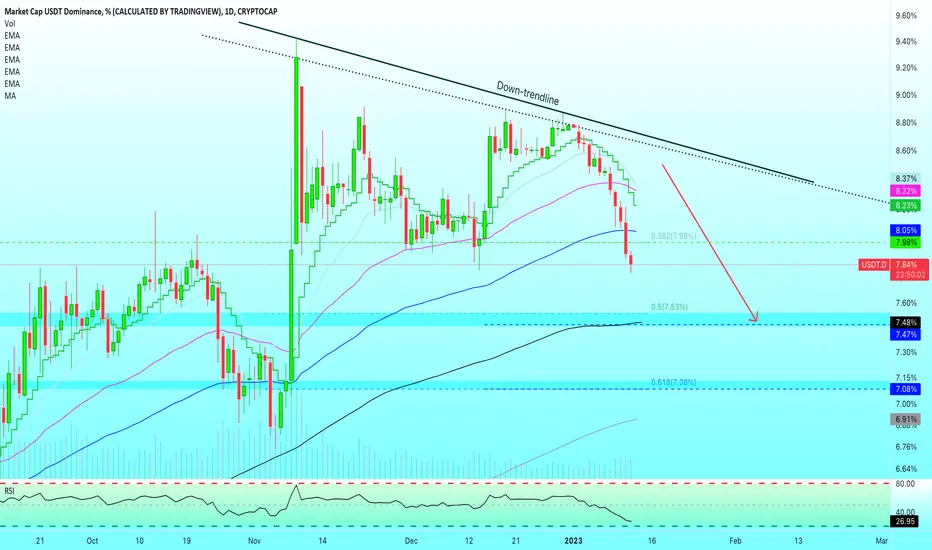
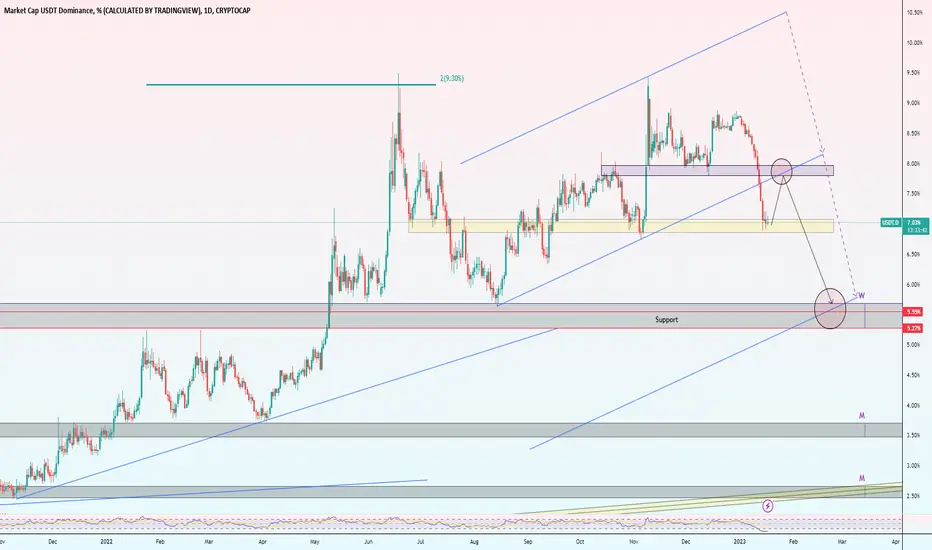
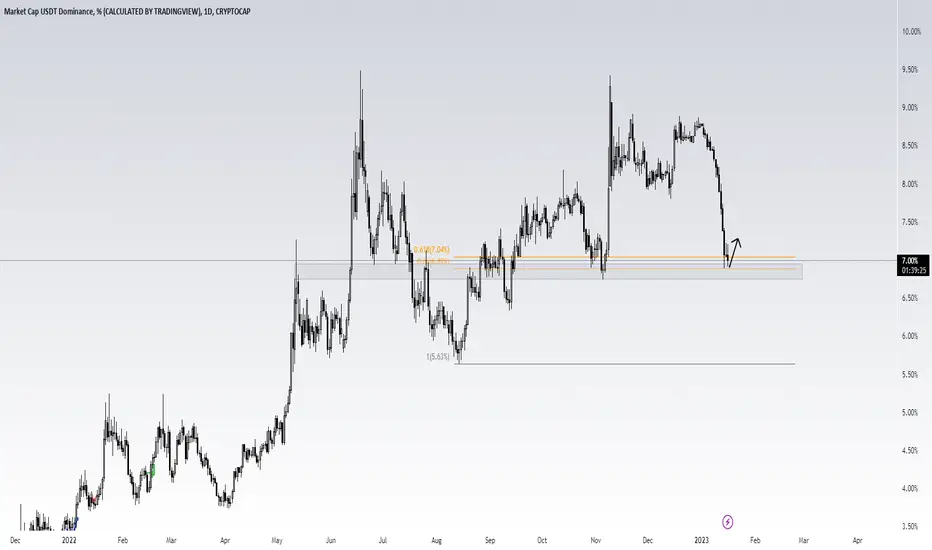
USDT Dominance Downward from supply zone. USDT.D updateHello my friends, Consider USDT market cap to help identify market movement, Everything is marked on the chart. The ascending trend has been broken and for now retesting as a pullback to 7.8 - 8% that we expected, then it will drops to 6-5.5%.
Good luck.
If its useful please like it as a support and follow me for next analysis :)
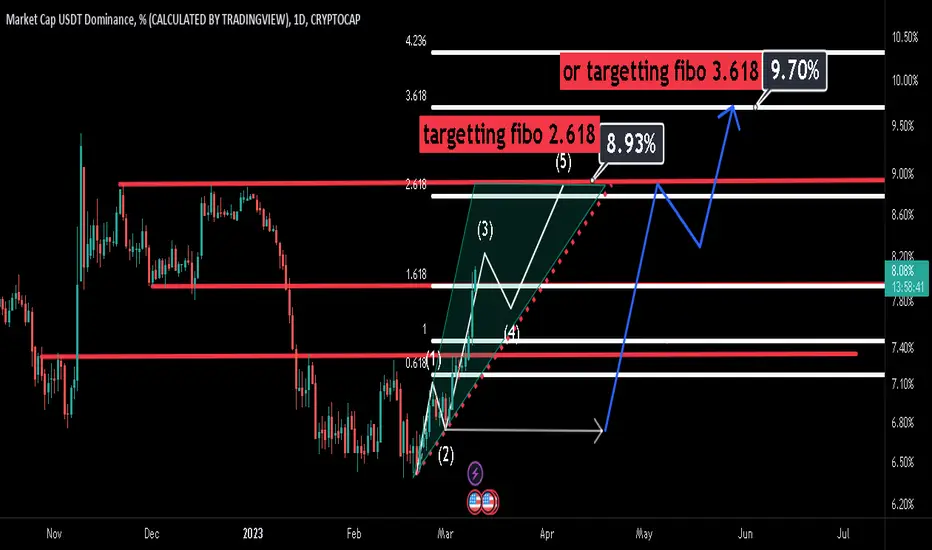
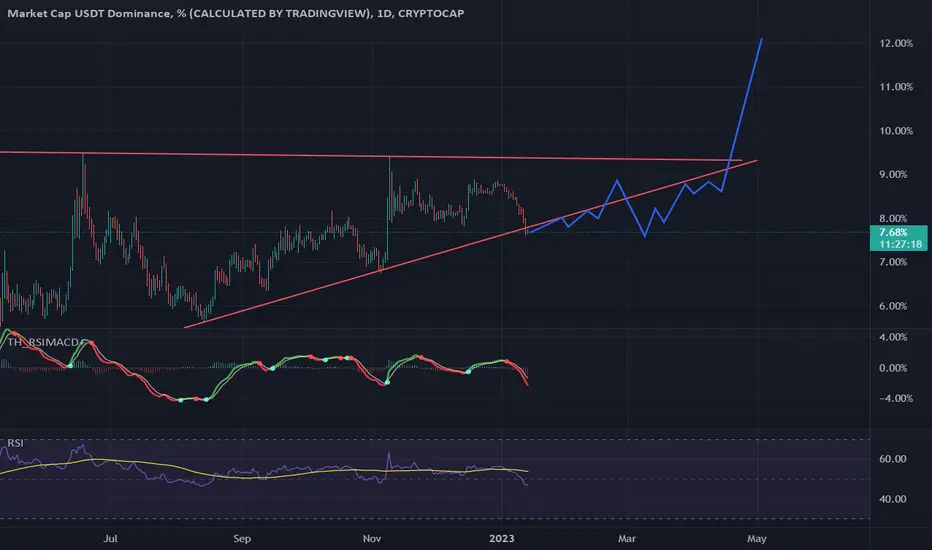
USDT DOMINANCE TARGETTING 8.93% OR MORE - MIDDLE TERMMy fundamental analysis , i expect the continuation of the inflationary pressure around the world that's why i'm still very bearish in crypto currencies.
Here i'm waiting for the continuation of the uptrend with a nice quintet elliot wave, targetting fibonacci 2.618 and may be more 3.618.
* What i share here is not an investment advice. Please do your own research before investing in any digital asset.
* Never take my personal opinions as investment advice, you may lose all your money.
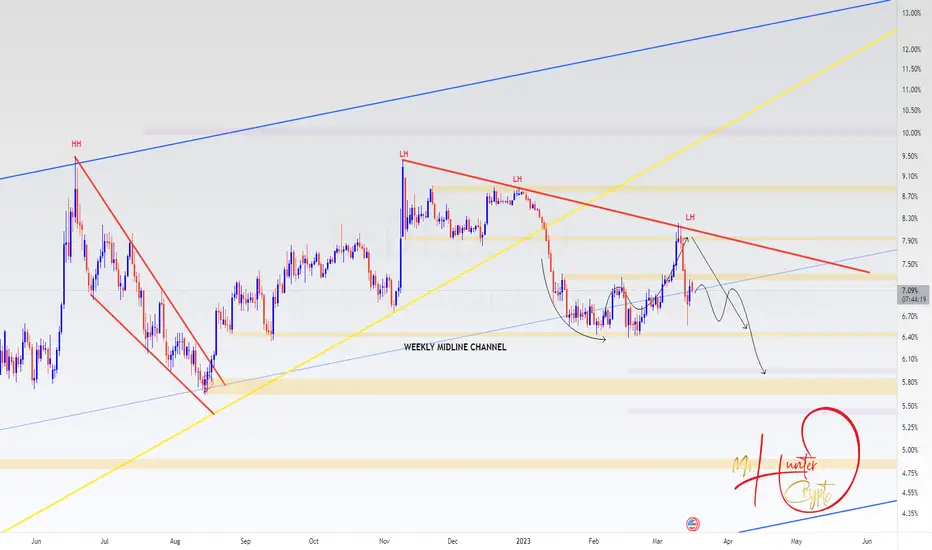
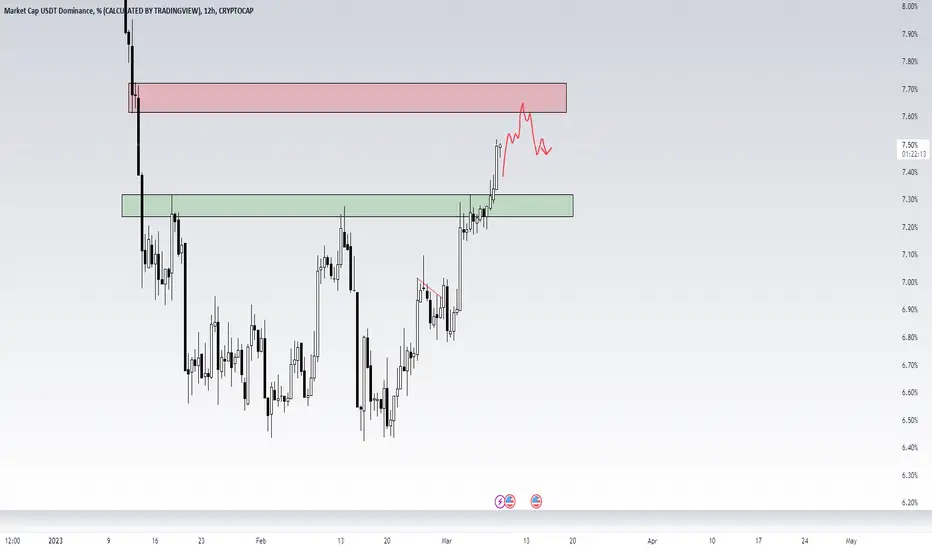
USDT.D Possible ScenarioHmmmm USDT.D seem to be bullish from here
we must grab liquidity from the red horizontal rectangle
which is not bullish for the market
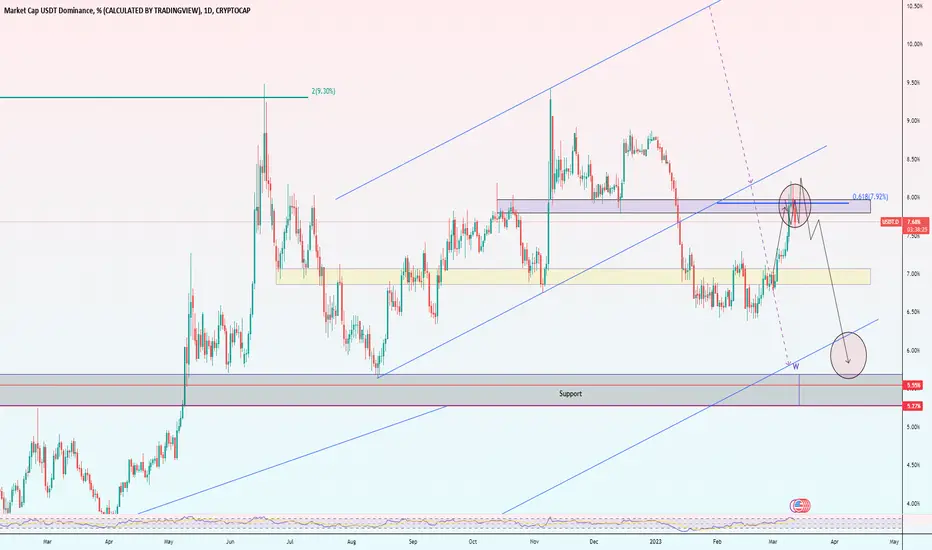
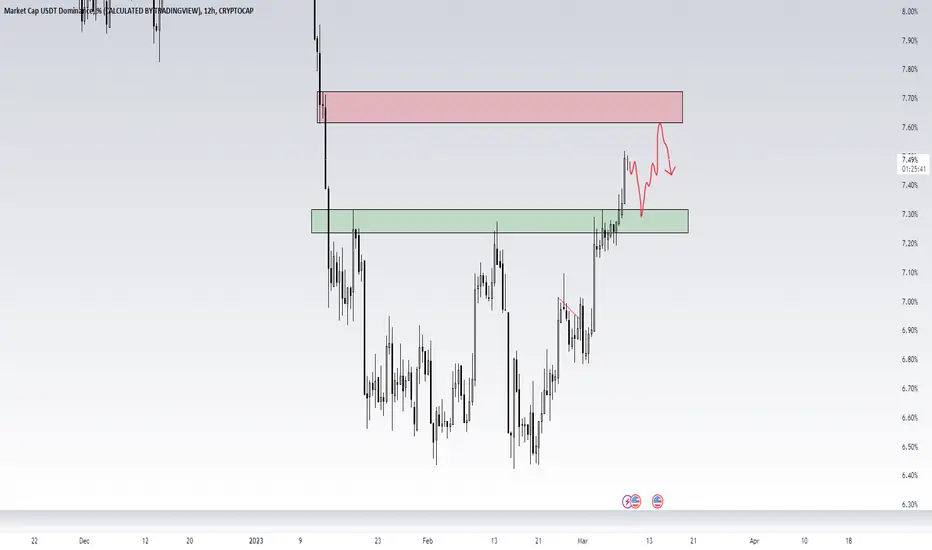
USDT.D Second scenario.The second scenario for USDT.D is more possible for me, which is going to the green zone inorder to grab more liquidity before retesting the red horizontal rectangle. If this scenario happens, BTC will go to the price of (23200) and then we will head to (20500). This scenario is more possible for me and this is what I'm keeping in mind. Waiting for confirmations. Will keep you updated.
📈 Tether Dominance 25-Feb. Update = Bitcoin BullishFor this update, I left the chart from the 25-Feb. trade idea intact where I mention:
"Last time USDT.D found resistance at EMA50.
"Yesterday, the peak was hit at exactly this same level.
"This resistance is there but likely to be taken out."
USDT.D is now facing the next resistance in the form of EMA100, this one is stronger and less likely to be taken out.
In fact, I believe that this one will hold but let's see what the chart has to say as believes don't hold much value in this game.
The trading volume has been low and it is going lower.
The RSI is curving down and showing some bearish divergence.
Technically speaking, solely focusing on the chart, this resistance can also break but the next one at 7.51% is super strong and the last level, MA200.
Conclusion
We are seeing a bounce take place but the bearish bias remains strong.
The initial move is a bearish breakdown that happened in January, after a lower high in December.
This drop continues active below 8.77%.
But we are looking at a drop now and Bitcoin moving ahead.
If it moves to MA200 it should all still happen within a matter of days, say 5-9 days max and that's it for this bounce.
For those not familiar with why I am reading this chart.
Bitcoin (BTCUSD) and Tether Dominance (USDT.D) have an inverse relation.
When USDT.D drops, Bitcoin goes up.
When USDT.D goes up, Bitcoin drops.
USDT.D is now facing resistance as EMA100 and if this resistance holds, we get a continuation of the previous drop... And Bitcoin goes up.
Namaste.

USDT Dominance Upward to supply zone. USDT.DHello my friends, Consider USDT market cap to help identify market movement, Everything is marked on the chart. The ascending trend has been broken and for now going to retest as a pullback to 7.8% that we expected, then it drops to 5.5%.
Good luck.
If its useful please like it as a support and follow me for next analysis :)
📈 Tether Dominance Bounce vs Bitcoins Correction AnalysisTether Dominance produced a bounce and this isn't surprising as this is within normal price action.
Last time USDT.D found resistance at EMA50.
Yesterday, the peak was hit at exactly this same level.
This resistance is there but likely to be taken out.
If EMA50 is confirmed as resistance a second time the below analysis isn't necessary.
After EMA50 or 7.04% Tether Dominance faces another challenge in the form of EMA100 (7.31%) and MA200 (7.46%), these resistance level are likely to hold.
The candles can pierce a bit above these levels before dropping or it can drop before reaching said levels but these are very likely to be confirmed as resistance on the first try as it happened with EMA50.
MA200, the black line on the chart, is a long-term indicator and thus this resistance needs to be confirmed.
Since it is the first time that USDT.D moves below this level since April 2021, it is important to retest it before continuing lower.
Once a level is turned, in this case from support to resistance, it needs to be tested as resistance to see if it holds.
If it holds, the USDT.D long-term downtrend is confirmed and the index is set to move much lower.
If it doesn't hold, the downtrend is likely to be over and USDT.D can resume growing.
Our belief based on reading multiple charts all across is that this level will be confirmed as resistance.
It can happen sooner than expected but the timing is for the market to decide.
Bitcoin moved from $15,500 to $25,250, which makes it normal if any type of correction, short or strong shows up.
But after the correction continues the growth.
Bitcoin is ultra-bullish above $22,222.
Bitcoin remains extremely-bullish above $20,000.
Breaking below $20,000 would be a very bad signal but the bullish potential would remain intact above the late November 2022 low.
As long as Bitcoin continues trading above its November 2022 low, the bullish potential for higher highs and higher lows long-term remains active.
Namaste.

USDT.DOMINANCE 1DAY UPDAYE BY CRYPTO SANDERS !!Hello, welcome to this USDT. dominance update by CRYPTO SANDERS.
CHART ANALYSIS:-USDT.D is bouncing from the horizontal support. If it breakout the current resistance level, a further bounce is expected toward the horizontal resistance.
The general pattern is bearish as it is exchanging beneath the Ichimoku cloud. We've to wait for a solid breakdown of the horizontal support, which would confirm another bullish move, as USDT.D works inversely proportional to the crypto market.
I have tried to bring the best possible outcome to this chart.
Hit the like button if you like it and share your charts in the comments section.
Thank you

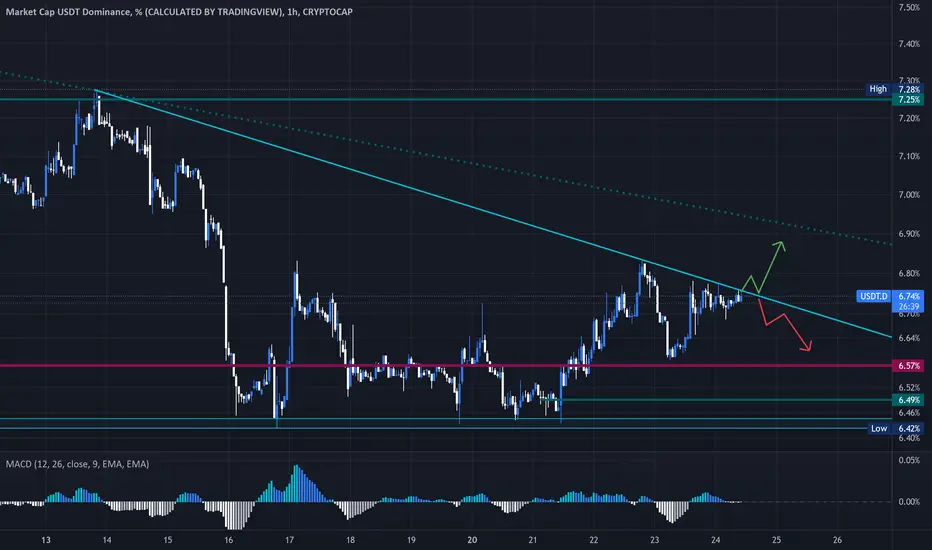
#Usdt_DI think Usdt.D is bullish = Crypto is bearish (1H)
_____________________________________________________
Wait for the blue line to break and then follow the arrow 📈📉
📈 Tether Dominance Points LowerUSDT.D bounced from 2-Feb. to 14-Feb. finding resistance at EMA50 and producing a lower high.
EMA50 has been confirmed as resistance and this lower high will now lead to a lower low.
USDT.D is set to drop based on this MA analysis.
Also, the RSI is below 50 which is bearish.
The MACD below zero while printing a bearish cross.
These additional signals support a lower low.
As USDT.D goes down, Bitcoin and in this case the Altcoins mainly will go up.
Remember that just as the big Altcoins take turns with the smaller Altcoins, Bitcoin takes turn with the market as a whole.
Namaste.

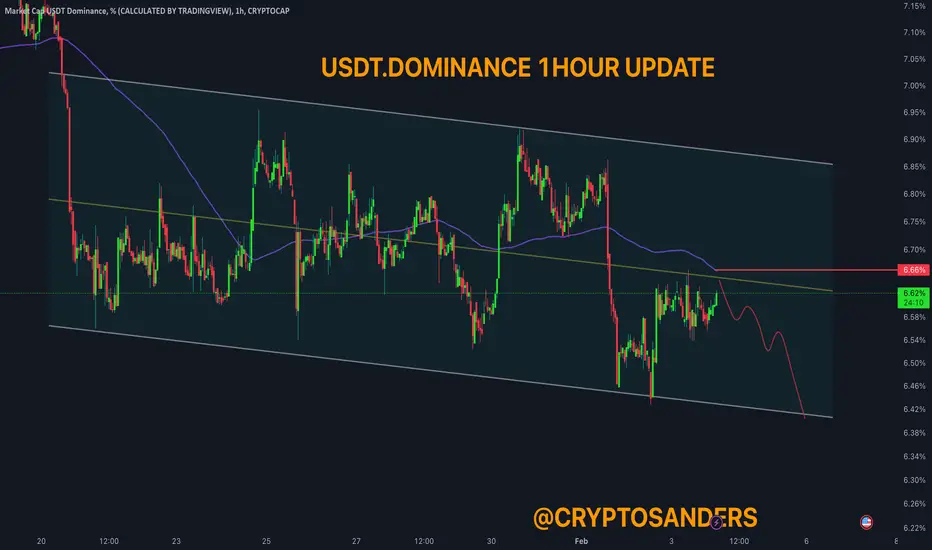
USDT.DOMINANCE 1HOUR UPDATE !!Hello and welcome to this USDT.DOMINANCE chart update by Crypto Sanders.
I have tried to bring the best possible result in this chart.
Chart Analysis:- Looking at the dominance of USDT it looks like a 6.66% to 100ma scheme which could fall to 6.41% if 100ma dominance is broken and closes above this chart it will be invalid.
This is not a piece of financial advice.
Hit the like button if you like it and share your chart in the comment section.
Thank you
📈 Tether Dominance Resistance EverywhereWe are seeing a small bounce taking place on the Tether Dominance chart matching the current red candle in Bitcoin's and Ethereum charts... As well as everything else since the entire market is connected and does the same.
Tether Dominance already found the first resistance at EMA10, this is the easy short-term one.
Notice the bearish cross between EMA50 and EMA100. A bearish cross always leads to a bounce short-term but fully develops mid-term.
A bounce that ends up in a lower high to produce a lower low. This is strongly bullish for the entire cryptocurrency market.
We saw this same signal to support a bounce on the Tesla (TSLA) chart.
After EMA10 we have the 0.618 Fib. retracement (strong resistance).
Followed by MA200, long-term support turned (strong resistance).
Then the bearish cross is another strong resistance level.
Finally, the 0.382 is a major strong resistance.
Tether Dominance is set to continue lower, regardless for how long or how high goes the bullish break.
It is normal to see corrections and retraces, it is also normal to see a continuation of a newly stablished trend.
Namaste.

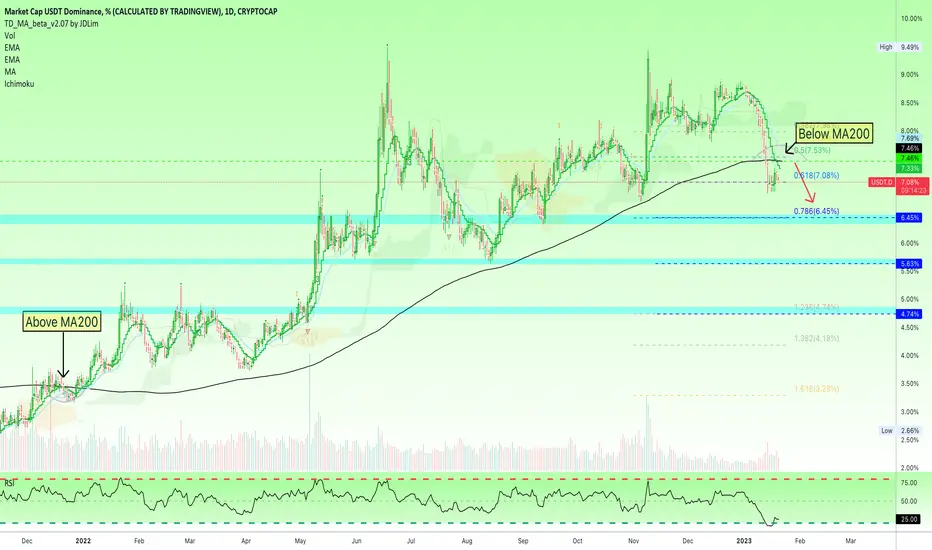
📈 Tether Dominance Trading Below MA200 Favors The BearsThis is a long-term chart for USDT.D (Tether Dominance)... Notice the black line, MA200.
Back in late December 2021, Tether Dominance moved above MA200, this signaled the beginning of a long upwards trend.
This also confirms MA200 as a long-term indicator.
Recently, 13-January-2023, Tether Dominance moved decidedly below MA200, signaling a long-term potential going lower.
As USDT.D goes lower, Bitcoin/Cryptocurrency goes higher.
If it goes lower long-term, crypto goes higher long-term.
Thank you for reading.
Namaste.
USDT Dominance Breakout ascending trend line. USDT.DHello my friends, Consider USDT market cap to help identify market movement, Everything is marked on the chart. The ascending trend has been broken and for now I expect a retest as pullback to 7.8% then it drops to 5.5%.
Good luck.
If its useful please like it as a support and follow me for next analysis :)
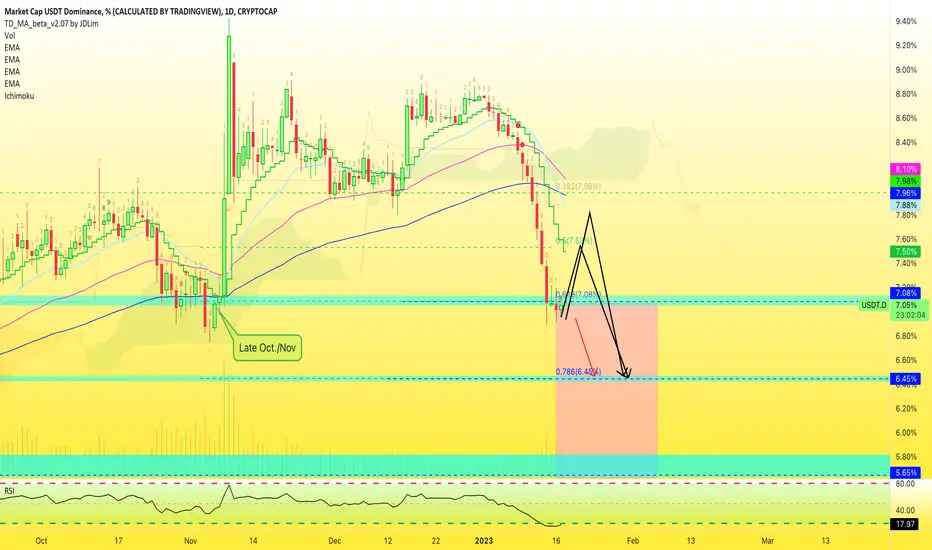
📈 Tether Dominance Goes Below SupportWhile a bounce was expected at the 0.618 Fib. retracement for USDT.D, it didn't take place.
After the close below this level 14-Jan., confirmation has been received with two additional candles/sessions staying below.
The RSI has gone super weak... 17, extreme oversold.
It is tricky here... As you can see from late October/November 2022, going below a support level can quickly result in a bounce.
Something similar can happen here where we see prices going up just to come crashing back down.
What's important to know for us is that any recovery should be temporary and then a lower low.
It can go straight down as well...
Namaste.
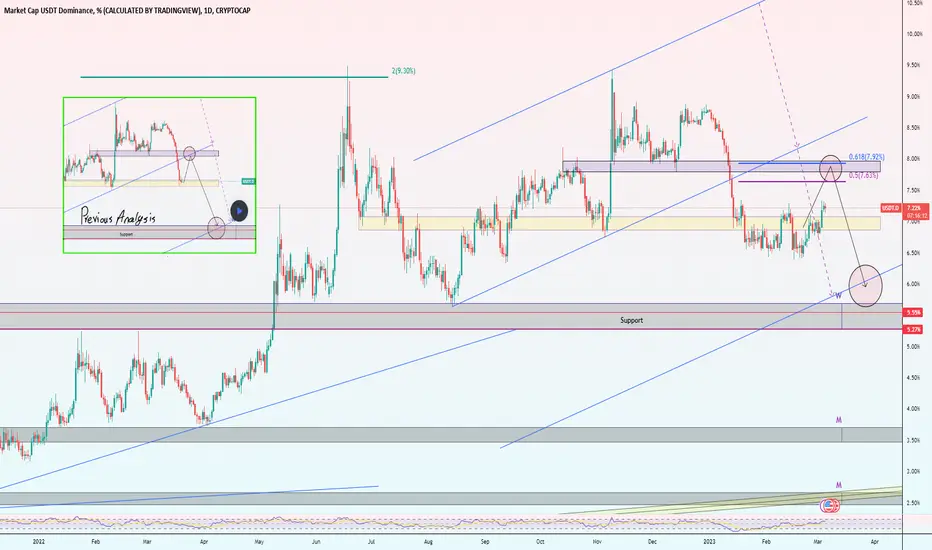
USDT.D Prediction❗️USDT.D 1D,
We have started retesting a very IMPORTANT mid-term 0.618 Fibonacci retracement level. This level will dedicate the next mouvement for the market! Stay tuned!
📈 Tether Dominance Weekly | July 2022 RepeatThe weekly candle is full bearish for USDT.D and we have some interesting data to analyze.
Tether Dominance is staying right above support in the form of a 0.618 Fib. retracement level.
The weekly candle closes in about 30 hours.
Looking back at July 2022, this exact same level was tested. As USDT.D broke below it, what followed were four red weekly candles (28 days) that ended up testing the 1 Fib. retracement.
We have the same scenario now.
The weekly session is about to close right above support, this happened last time but only to be followed by strong bearish action.
The RSI is in scuba diving mode and we have a volume breakout on the bearish side.
A bounce can happen at support, this is normal... But the signals are pointing lower, clear and strong.
The next targets are 6.45% and 5.65% which would mean a Bitcoin price of $23,000 to $25,000.
Namaste.

USDT.DMagic Prediction for USDT.D . its on the weekly support . ..............................................................................................................................................
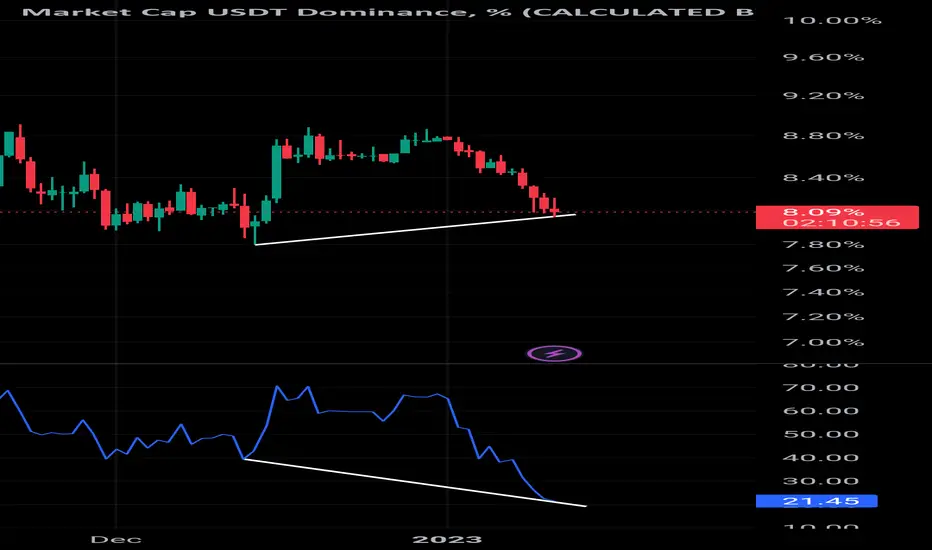
USDTD BULLISH Hello Traders there is a huge hidden bullish Divergence on Usdt.D soo, be carefull with your longs and don't forget to take your profits.
Cheers
📈 Tether Dominance, The Final ConfirmationIncredibly enough, some people still have doubt that Bitcoin and the Altcoins will continue to grow.
Here is the final confirmation in the form of a strongly bearish USDT.D chart.
Remember that one mentioning this thing is about "to speed'...
Well, this "thing" has more down to go before it finds support.
At least one more strong red candle, then a small bounce before more lows.
Namaste.