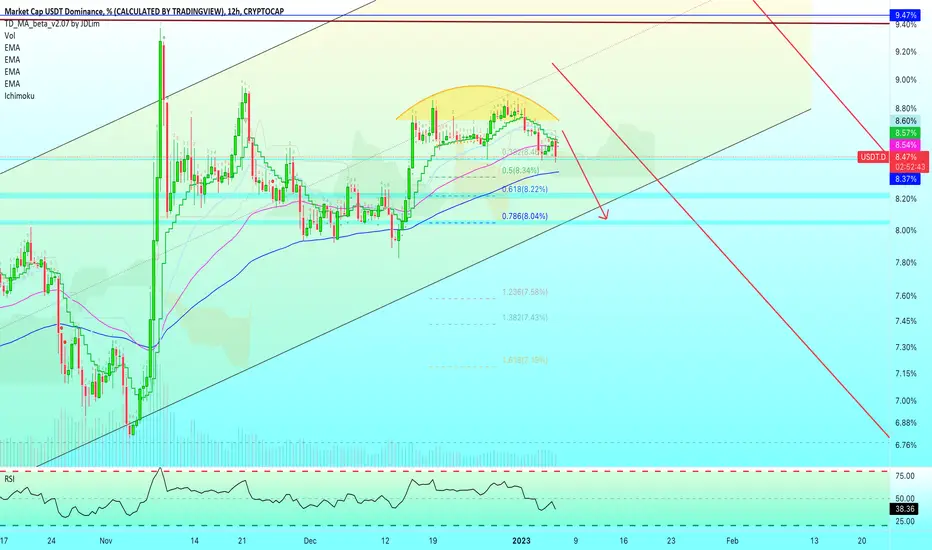
📈 Tether Dominance Speed...The drop here is about to speed up, the one we mentioned in the last update/trade idea, and additional confirmation is coming in.
12H, USDT.D printed a strong rejection while trying to move back above EMA10 and EMA21
This rejection pushed the index down to below EMA50 as well and the RSI is turning weak.
A sudden drop is about to take place... We don't know if it happens within hours or several days.
As soon as it happens though we can see the inverse reaction for bitcoin, the altcoins, to take place.
A nice jump, everything will move up 1 full level... The relief that we've been waiting for.
Thanks a lot for your continued support.
Feel free to Boost 🚀👍 if you like!
Namaste.
Usdtd
📈 USDTD Bearish Wave! +Bitcoin +Altcoins +2023 & Beyond Mapped!The wait is over...
We are getting confirmation from this chart, the Tether Dominance bearish wave is about to start and likely it will go fast.
USDT tokens will be flowing to bitcoin and the altcoins.
Bitcoin and the altcoins will grow together for a while.
Bitcoin will go ahead after a few weeks while the altcoins stay behind.
Bitcoin will steal the show for a while.
While bitcoin moves ahead the altcoins will enter correction mode/retrace.
Once the altcoins stop their correction it will be bitcoin's turn.
The altcoins will print a higher low and grow, money flowing from bitcoin to the altcoins.
This will create momentum, there will be hype and new players will enter the game.
It will be a small bullish breeze but it will stop once again.
Around March, late... We will be back to the energy/feelings we had in 2021 for 3 long months... It will feel like the end of the world but at the end there is always a new start.
My calculations are pointing to 2-3 months bullish followed by 3-4 months bearish...
Then another consolidation phase at low/bottom prices before the next market phase starts.
2023 will be an interesting year...
The year Crypto Recovers.
2024 will be an interesting year...
The year Crypto Grows.
2025 will be an amazing year...
The next Crypto Bull-Run!
Namaste.

new analysis It's really hard to explain this
but we have a slight downpour, and then about 1 month to 45 days the market is bullish, and the altcoin will grow between 100 and 1000%, currencies with high market caps like Ethereum 100% and currencies with low market caps up to 1000%,
and then we have a terrible fall that many currencies will be destroyed
if you like analysis with me. Join me and make a profit to message me or comment
I put 7 new analyzes I will let you see all the analysis to pay attention to the analysis dates and do not harm
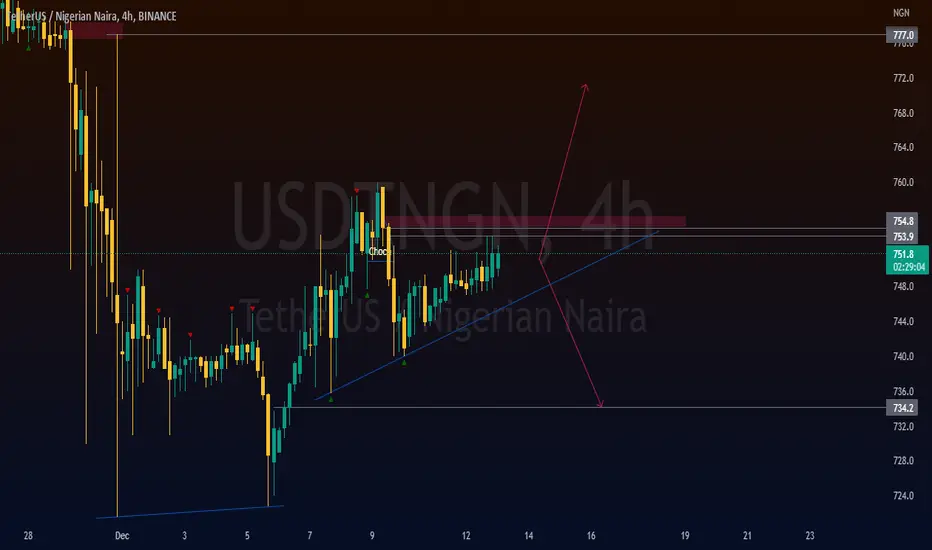
💥USDTNGN - TO RALLY ABOVE 760 OR DROP TO 730NAIRA is currently indecisive with CMP sitting at 751.8 per dollar. A breakout from this triangle to confirm Naira next direction.
An upward breakout above the resistance zone toward 760 will make NAIRA super bullish to 777 and 800.
A downward breakout will drop price to 735 or more.
What do you expect?🤔
An upward breakout or a drop??
Not a financial advice 🙅🏼♂️
Share your opinion in the comment section✍️
Please support this idea with a 👍 if you find it useful😋
Happy Trading💰💵💸
Tether Dominance Gravestone DojiYesterday's close ended up with a Gravestone Doji.
We have a lower high short and mid-term.
The weekly candle is also weak.
USDT.D Technically bullish with bearish potential starting to develop.
Namaste.

📈 Tether Dominance Bullish vs Bearish PotentialThe Tether Dominance Index (USDT.D) is now bullish as it continues trading above EMA10.
Let's look at the potential for a reversal; early bearish signals.
- Lower high mid-term. June vs November.
- Decreasing bullish volume. As USDT.D continues to move higher the weekly trading volume goes lower, giving us an early signal of weakness.
- RSI bearish divergence. Divergences tend to happen between tops and bottoms.
These are just early signals and the trend is still bullish but we are looking for a potential reversal.
Tether Dominance moves inverse to bitcoin.
- If USDT.D goes up, BTCUSD goes down.
- If USDT.D goes down, BTCUSD goes up.
That's why we track this index in search for confirmation/additional information to support what we see on the bitcoin and Altcoins charts.
Namaste.

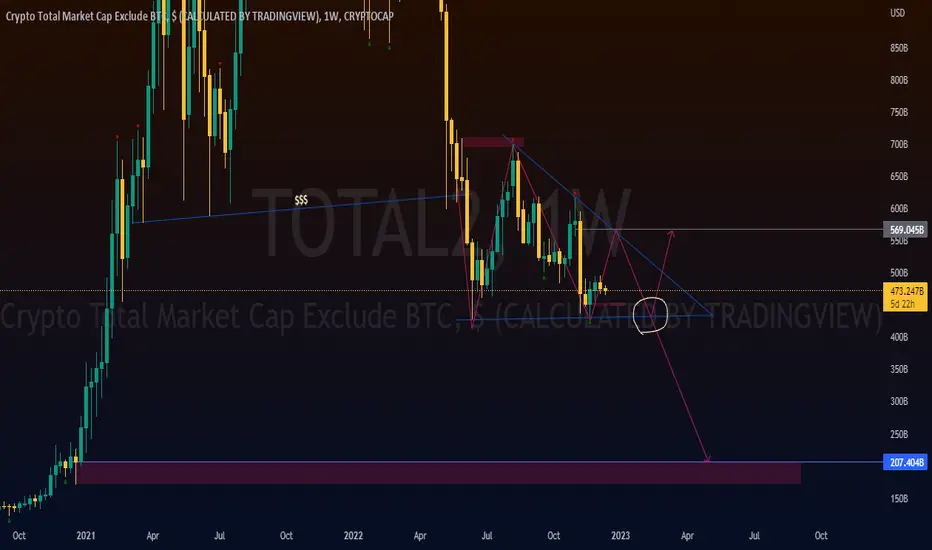
💥$TOTAL2 - STRUGGLE CONTINUES✊🏽We all anticipate for the bear to end but charts are proving otherwise. The crypto Total Market Cap Exclude BTC chart shown here indicate that we have liquidity sitting at $208B.
A breakout below the triangle will quicken this bias.
What do you think?
Not a financial advice 🙅🏼♂️
Share your opinion in the comment section✍️
Please support this idea with a 👍 if you find it useful😋
Happy Trading💰💵💸
Tether Dominance Complete Breakdown | Crypto Will Safe The Day!There is still doubt as to wether Bitcoin will continue growing or not and thats understandable... The Feds, the bear market, the war, the FTX scam, etc. all weight in on peoples mind but the charts are starting to give a clear message.
We have once more the Tether Dominance (USDT.D) chart, which moves inverse to Bitcoin.
Today EMA50 continues to be challenged as support and we see a break below it for the first time since late October.
I mention EMA50 because it is used by us to guage a chart/pair/asset mid-term potential.
USDT.D is looking bearish based on all chart signals and candlestick patterns.
A strong bearish signal is the lower high this November compared to June.
Even while Bitcoin went to print a lower low, November vs June, Tether Dominance ended in a lower high, not matching its inverse relation and sending out a strong bearish signal.
It is possible that Bitcoin can detach from the stock market, it is possible.
It is possible that Bitcoin can grow while the entire world burns, it is possible.
Just think of March 2020 when Covid entered in full force.
Instead of Bitcoin going down it bottomed and then started to grow for more than a year really strong.
We can see something similar with cryptocurrency next year as the world markets burn.
The worst time ever in a lifetime can come and cryptocurrency stay around to safe the day.
This is just a possibility but it happened with Covid and it can surely happen again.
Namaste.

Let's see what do we have here #USDTDAlright everyone after a long time that i was absent from the market,lets start again with #USDT.
There are 2 options that it can go through,if this 4h support got out of the way,we can see some green candles in crypto market

Tether Dominance Aims Down At 7.12% (10% Drop)Yesterday Tether Dominance (USDT.D) closed below EMA10 and today we have a full bearish candle.
The drop is about to speed up.
We see EMA50 as the next support line at 7.94%, but looking back this line is always pierced and MA200 has been the main support.
MA200 is sitting at 7.12%, this is where we think stands the first/main support.
As Tether Dominance goes down, Bitcoin goes up.
We can see at least 1 week bearish, 7 days, to start...
As this move develop, we can gain more data and figure out for how much longer this correction will go.
Namaste.

Tether Dominance Mixed Signals + Bearish PotentialI will now read the Tether Dominance (USDT.D) chart for you but let's keep in mind that this one is tricky, it fooled us several times in the past.
We have some mixed signals.
We have a lower high (Nov. vs June) based on candle wick and a higher higher based on candle close.
We have the same pattern forming now as it happened back in June.
A correction pattern.
USDT.D is likely to move lower to test MA200, the black line on the chart.
We see here only a short-term correction.
If this goes down Bitcoin goes up.
But as it finds support, Bitcoin finds resistance and things turn.
I am mentioning this to keep in mind that any Bitcoin rally should be considered a relief rally so stay on the lookout, not to get complacent in a matter of days.
USDT.D daily below EMA10 signals bearish potential but this is a weak signal at this point.
Lower highs is also bearish yet these signals lack strength.
It is a bit mixed because we have a bullish trend maybe entering a correction in a matter of days.
We are reading bearish signals on a bullish trend.
We specialize in looking for reversals/trend change; that's why.
Namaste.

#USDT.DOMINANCE 1DAY UPDATE BY CRYPTO SANDERS !Hello, welcome to this USDT.DOMINANCE 1DAY chart update by CRYPTO SANDERS!
I have tried to bring the best possible outcome to this chart.
Show some support, hit the like button, and comment in the comment section. this motivates me to bring this kind of chart analysis on a regular basis.
CHART ANALYSIS:-USDT dominance is currently near resistance. If USDT dominance dumps from here then the next support level for USDT dominance is 5.5% to 5.8%. The end market is moving fast, if it bounces from its resistance level, then how high can it go up?
Hit the like button if you like it and share your charts in the comments section.
thank you.

USDT.DUSDT.D I share this chart a few months ago I told to people the bear market is coming very soon, and now after 2 months we can see the bear market, For now, I'm more bearish on BTC/USDT in the big picture lets see what happen.
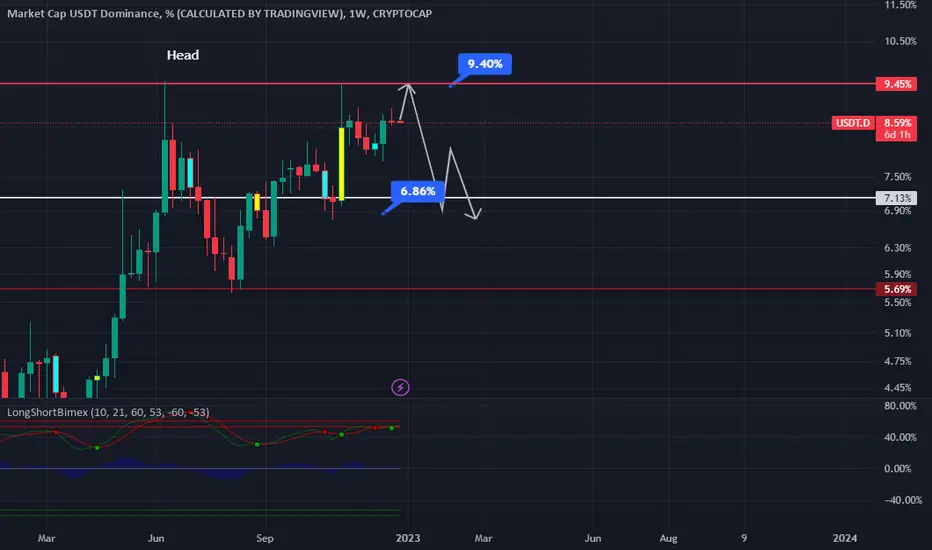
USDT.D CONTINUATION BAD FOR CRYPTOUSDT.DOMINANCE CHART
Weekly and Daily timeframe Symmetrical Triangle in play with target as shown just past the Range High at 10%.
Not good for crypto because going above the blue line 0.382 labelled above market = Chaos.
RSI printing Bullish Divergence.
I also believe we are in the 5th Impulsive Elliot Wave with blow off top, followed by an ABC Corrective Waves.
It is just an idea but if it plays out very bearish for CRYPTO.

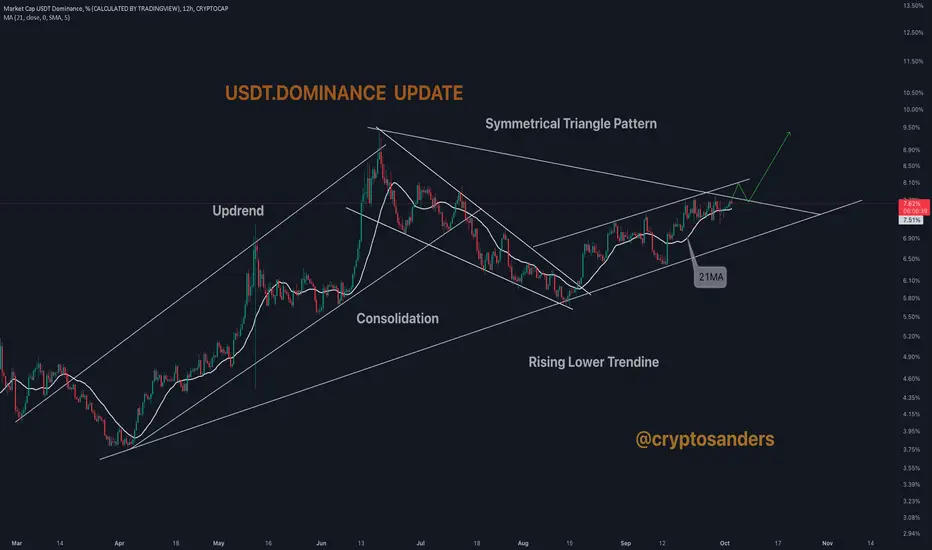
#USDT.DOMINANCE 12HOUR UPDATE BY CRYPTOSANDERS !!Hello dear traders, we here new so we ask you to support our ideas with your LIKE and COMMENT, also be free to ask any question in the comments, and we will try to answer for all, thank you, guys.
DOMINANCE UPDATE:-USD dominance is forming a symmetrical triangle pattern and the upper train line is in support of the 21ma upside breakout, which could dump BTC and altcoins
Sorry for my English it is not my native language.
Hit the like button if you like it and share your charts in the comments section.
This is not a piece of financial advice. All investment made by me is at my own risk and I am held responsible for my own profit and losses. So, do your own research before investing in this trade.
Thanks for your time, we hope our work is good for you, and you are satisfied, we wish you a good day and big profits.
THANK YOU.
TETHER DOMINANCE correction from the resistance area ❌🧨Hello 🐋
Based on the chart, the price is close to the resistance zone ✔️👌
if
the price doesn't break the resistance zone to the upside, we will see more correction to the downside ❌🧨
Please, feel free to share your point of view, write it in the comments below, thanks 🐋

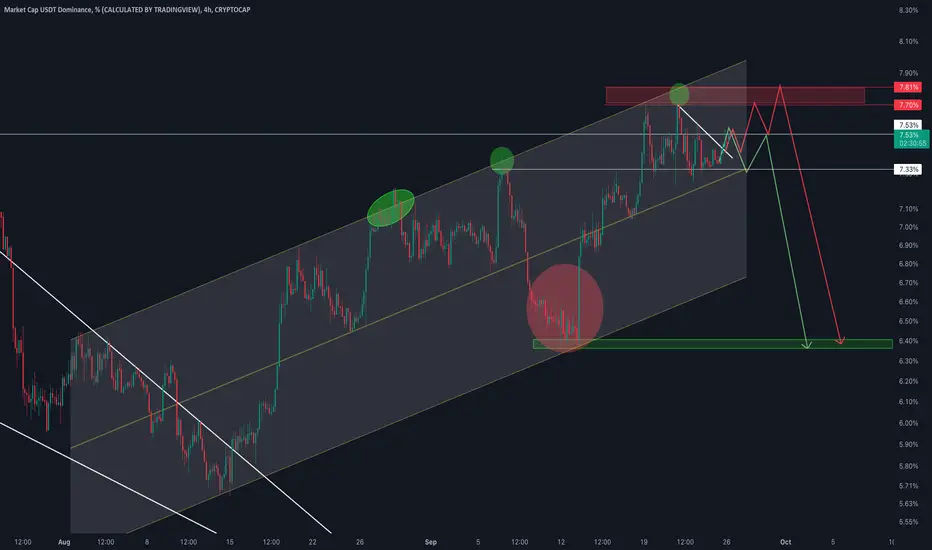
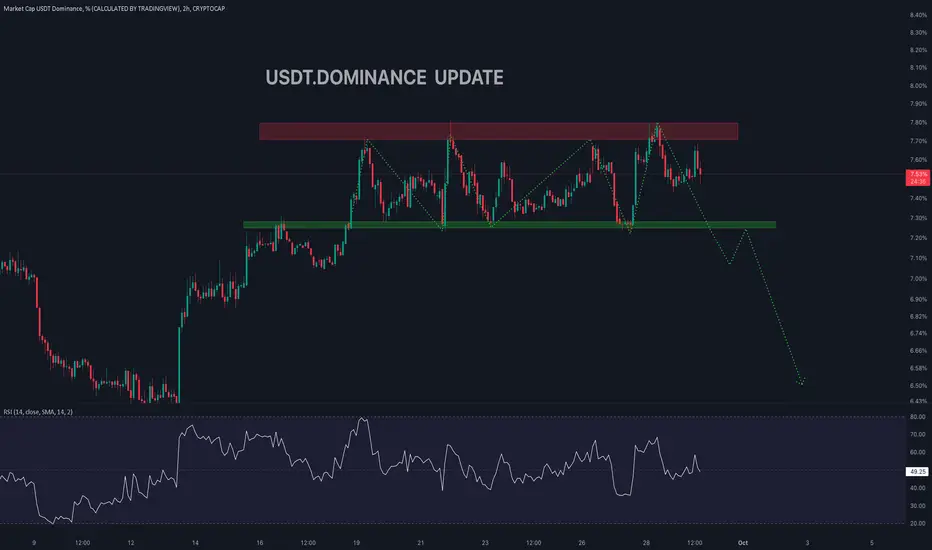
#USDT.DOMINANCE 4Hr UPDATE !!Hello dear traders, we here new so we ask you to support our ideas with your LIKE and COMMENT, also be free to ask any question in the comments, and we will try to answer for all, thank you, guys.
USDT.D UPDATE:-USDT.D if reject from 7.53% we can see 6.41% to 6.36% if dominance jumps from 7.53% to 7.70% and 7.81% then we reject to 6.38%
This is not a piece of financial advice. All investment made by me is at my own risk and I am held responsible for my own profit and losses. So, do your own research before investing in this trade.
Thanks for your time, we hope our work is good for you, and you are satisfied, we wish you a good day and big profits.
THANK YOU.
USDT.DOMINANCE 2HOUR UPDATE BY CRYPTUSANDERSHello dear traders, we here new so we ask you to support our ideas with your LIKE and COMMENT, also be free to ask any question in the comments, and we will try to answer for all, thank you, guys.
DOMINANCE UPDATE:-USDT.D is moving in a rectangular chart pattern and moving towards its horizontal resistance. If it breaks above horizontal resistance with a candle close above it, then that would indicate an upside move.
Another possible scenario is a rejection from horizontal resistance and that would be the indication of a downward move. We must keep in mind that USDT.D works opposite to the crypto market and as there is indecision in the market, so better to play level to level with tight stop losses.
Sorry for my English it is not my native language.
Hit the like button if you like it and share your charts in the comments section.
This is not a piece of financial advice. All investment made by me is at my own risk and I am held responsible for my own profit and losses. So, do your own research before investing in this trade.
Thanks for your time, we hope our work is good for you, and you are satisfied, we wish you a good day and big profits.
THANK YOU.
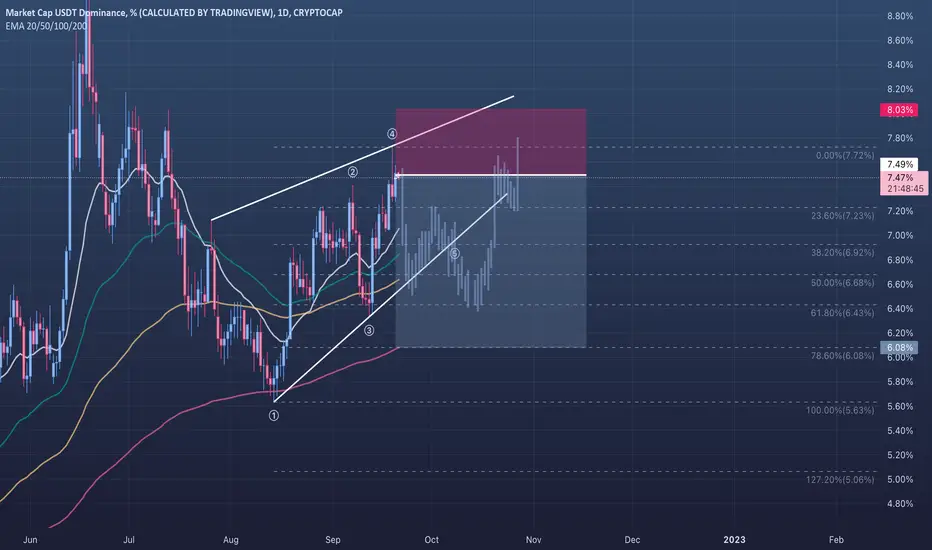
🔴 USDT.D - 1D (21.09.2022)🔴 USDT.D
TF: 1D
Side: Short
Pattern: Rising Wedge
SL: 8.03%
TP 1: 7.23%
TP 2: 6.92%
TP 3: 6.68%
TP 4: 6.43%
This is my idea on USDT.D over the next couple of weeks.
After so much growth, I think it will go down a bit to reset the RSIs.
This means Crypto can have a relief rally before continuing down.
#USDT.DOMINANCE 30M UPDATE !!Hello dear traders, we here new so we ask you to support our ideas with your LIKE and COMMENT, also be free to ask any question in the comments, and we will try to answer for all, thank you, guys.
DOMINANCE UPDATE:-As we see the Bart pattern forming in the Dominance, the Dominance suddenly dumps and we see bearish RSI in the Dominance, so here we expect the Dominance to Dump. What do you think in the comment section? Tell me
This is not a piece of financial advice. All investment made by me is at my own risk and I am held responsible for my own profit and losses. So, do your own research before investing in this trade.
Thanks for your time, we hope our work is good for you, and you are satisfied, we wish you a good day and big profits.
THANK YOU.

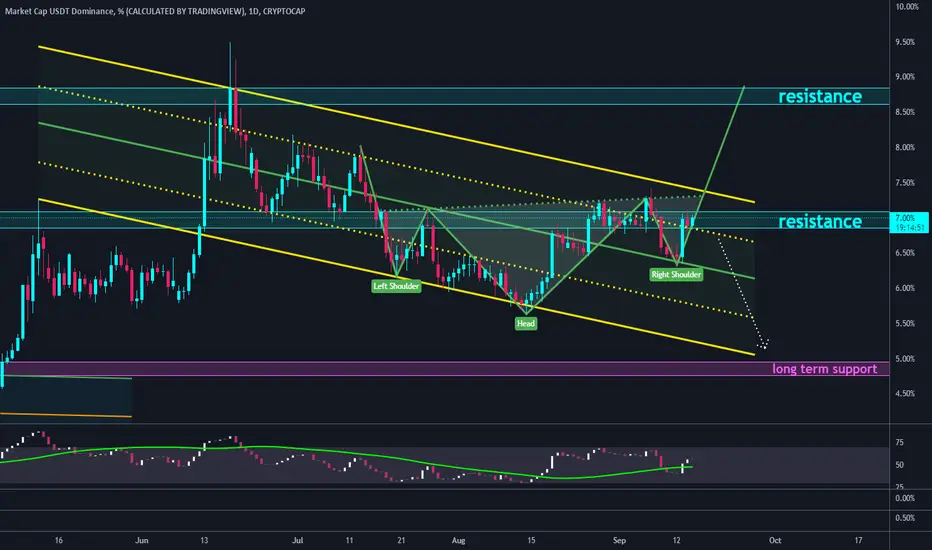
USDT.D inverted head and shoulders#USDT.D
The dominance of USDT is inside a descending channel, and below the upper line of this channel.
also as you can see it shaped an inverted head and shoulders.
🐮 the neckline of H&S pattern is the same with upper line of channel, so breaking out from this resistance can increase dominance toward resistance zone around 8.5%, that will cause more fall in crypto market.
🐻 rejection from upper line of channel can reverse the short-term trend and possible to drop to lower line, and as you know this move will cause reversal in crypto market and crypto will move upward.
SECRETS the USDT.D chart can reveal - Crypto Bullish or Bearish?Hi Traders, Investors and Speculators 📈📉
Ev here. Been trading crypto since 2017 and later got into stocks. I have 3 board exams on financial markets and studied economics from a top tier university for a year. Daytime job - Math Teacher. 👩🏫
In today's video analysis, I share with you the SECRET of the USDT.D chart, that otherwise seems irrelevant in predicting the ENTIRE crypto market direction... right? Watch this video to find out what the USDT chart can reveal about the general trend of Bitcoin and altcoins / TOTAL cryptocurrency market cap. I also use one of my favorite technical indicators, the correlation coefficient.
Now , you might wonder, why are market caps relevant? In general, the higher the market cap of a cryptocurrency, the more dominant it is considered to be in the market. For this reason, market cap is often regarded as the single most important indicator for ranking cryptocurrencies. The market cap of a cryptocurrency is determined by the current price multiplied by the circulating supply.
The market cap of a cryptocurrency more or less reflects the popularity of a coin over a longer term and can reveal how much market participation there is in a specific asset.
Large-cap cryptocurrencies are generally considered to be safer crypto investments. These are companies with a market cap of more than $10 billion. Investing in coins with large market capitalization is usually a conservative strategy. These coins are likely to be less volatile than other cryptocurrencies but still more volatile than traditional assets like stocks. Mid-cap cryptos (think top 20ish altcoins) are more volatile but also have a lot more growth potential than large-cap cryptocurrencies.
Micro-cap cryptocurrencies are extremely volatile and considered a highly risky investment, even though they may sometimes have a lot of potential (short-term) growth. However, be aware that they may also crash, literally from one minute to the next. They are also popular for pump and dump schemes, and liquidity rug-pulls.
_________________
📢Follow us here on TradingView for daily updates and trade ideas on crypto , stocks and commodities 💎Hit like & Follow
We thank you for your support !
CryptoCheck

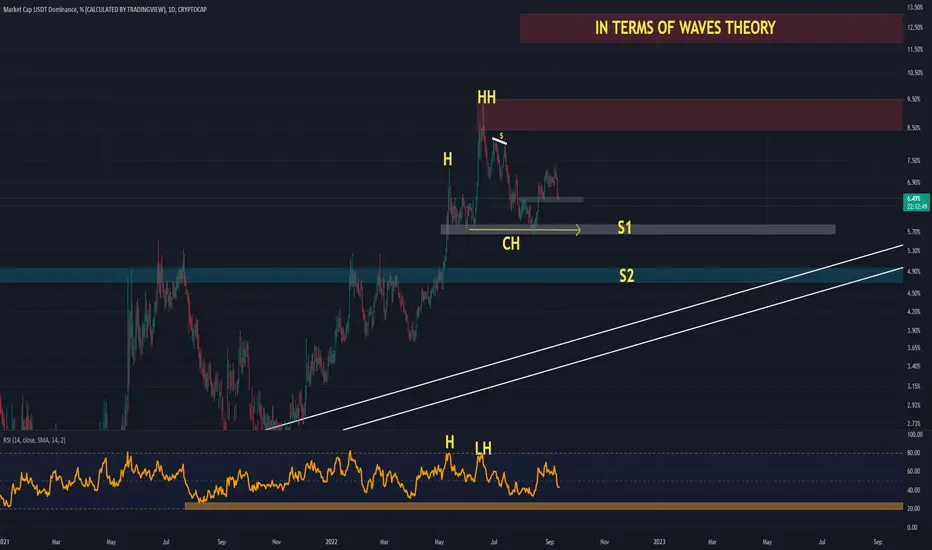
USDT.DIf the price engulf S1 i can say probably we are gonna see 28000 at S2 !
TIP : BTCUSDT and USDT.D have advers conection !