USDT.D at decision point... Hey.. up or down for USDT?! This is the big questions for now... very interesting point at the moment.. what is ur view?
Usdtd
USDT dominance is giving good vibes.Hello everyone,
Another 30/50 days to see a total transformation.
Enjoy.

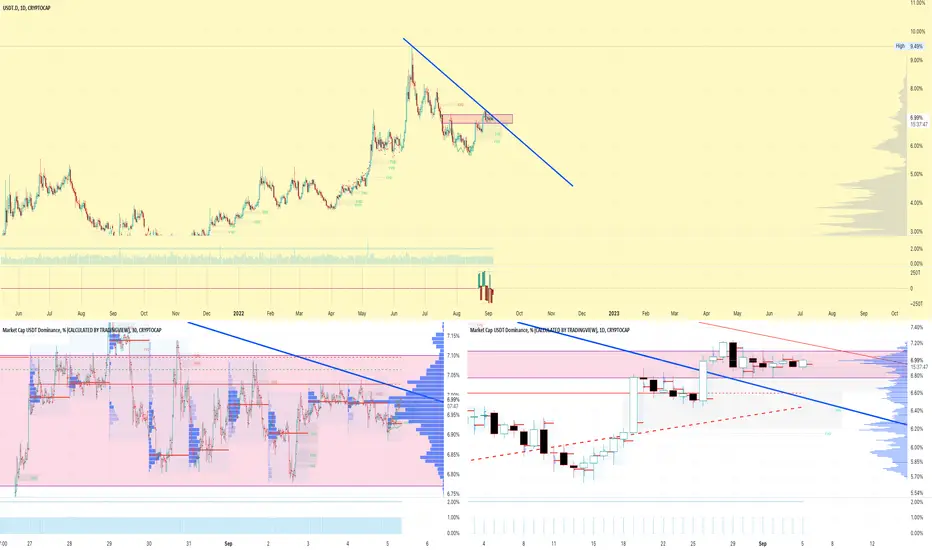
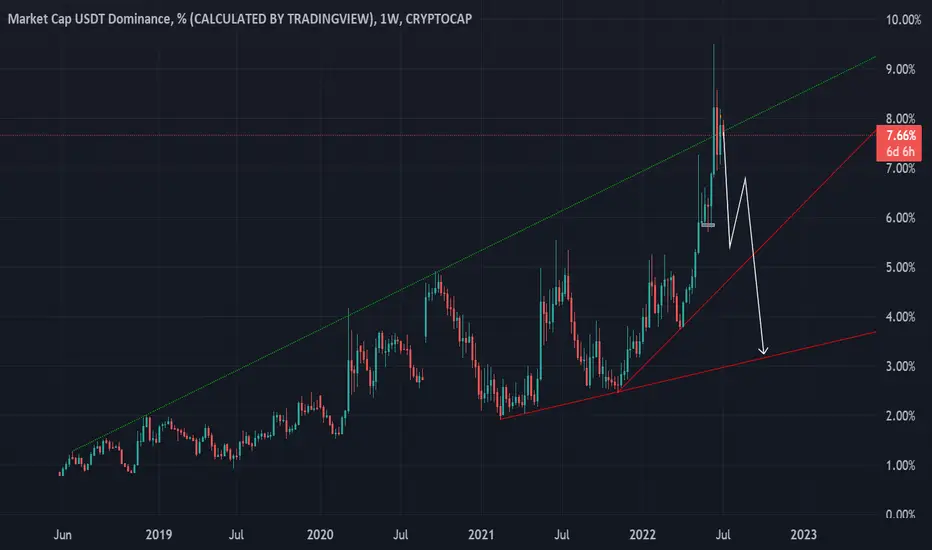
USDT.D - I found fractal. Bitcoin will be 14 000$
to create the idea, I used my custom finobachi, degree system and cycles. The most important thing you can see here is the fractal. It clearly shows what can happen with bitcoin with a high degree of probability and with a small degree of probability this may not happen. Accept that there will be a bull trap soon and after that we will fall heavily to $12-14000 and possibly even lower. I have identified fractal bottoms, accumulations, highs and patterns that are similar to each other. The result is the same after the transition of Ethereum to proof stakes and a strong increase in the FRS rate, we are in for the strongest collapse in the history of BTC.
For those who do not know, the rise of tether dominance means the fall of bitcoin and vice versa
BTC WILL BE PUMP 27 December (week candle)

TETHER DOMINANCE correction ❌🧨Hello 🐋
Based on the chart, the price is close to the resistance zone ✔️👌
if
the price doesn't break the resistance zone to the upside, we will see more correction to the downside ❌🧨
Please, feel free to share your point of view, write it in the comments below, thanks 🐋

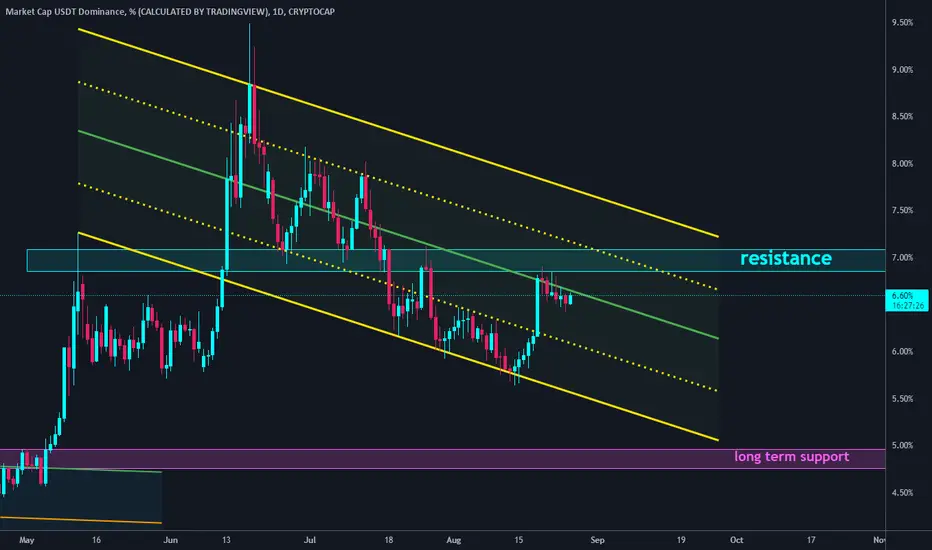
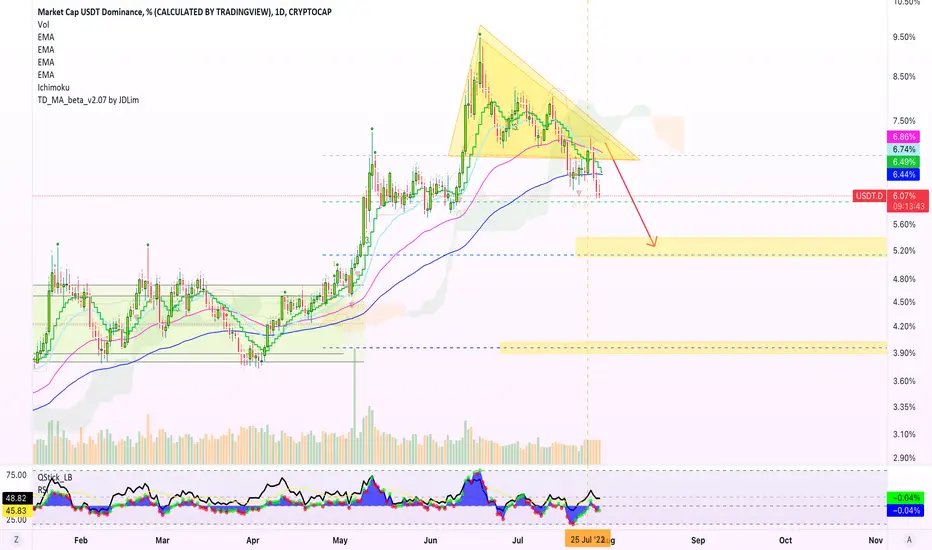
USDT.D below resistance zone break or make?#USDT.D
USDT Dominance is below resistance zone that is the same with the middle line of descending channel.
🐻 as long as it stays below the resistance zone crypto market will rise!
🐮 break out from the resistance zone will increase USDT Dominance to the upper line of channel and we will see more crashes in the crypto market!
#USDT.DOMINANCE UPDATE 1DAYHello dear traders, we here new so we ask you to support our ideas with your LIKE and COMMENT, also be free to ask any question in the comments, and we will try to answer for all, thank you, guys.
USDT dominance analysis:-
USDT dominance after break of structure is making lower lows and lower highs and it bounced from the previous higher low support after creating a lower low.
Currently it is in the formation of making lower high and a down move is expected from the marked lower high box and that would be a bullish sign for the market as it works inversely proportional to the crypto market.
This is not a piece of financial advice. All investments made by me are at my own risk and I am held responsible for my profits and losses. So, do your own research before investing in this trade.
Thank you for your time, we hope that our work is good for you, and you are satisfied, we wish you a good day and big profits.
Thanks.

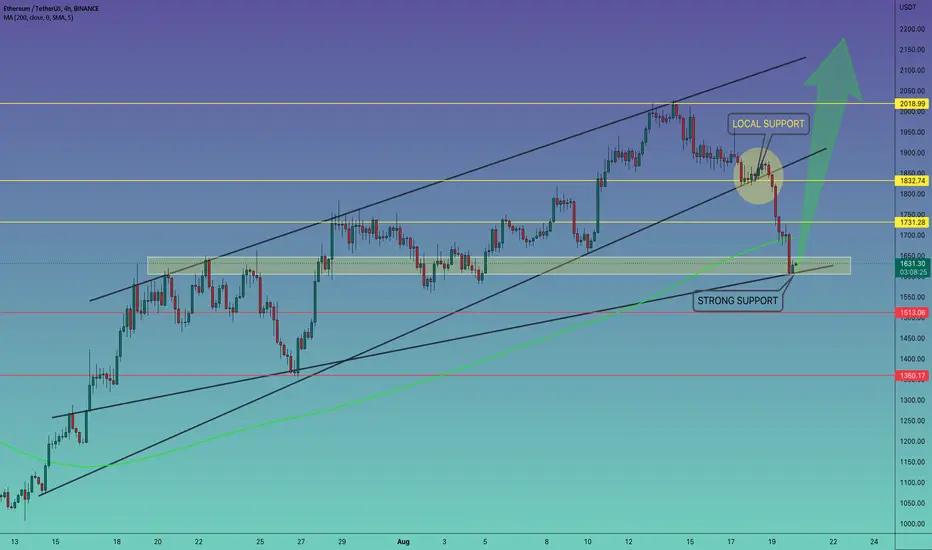
#ETH/USDT 4HOUR UPDATE !!Hello dear traders, we here new so we ask you to support our ideas with your LIKE and COMMENT, also be free to ask any question in the comments, and we will try to answer for all, thank you, guys.
ETH/USDT UPDATE !!
ETH broke the local support and as expected dumped towards the $1600 support area. This is the key level to hold otherwise we see a heavy sell-off in the market. The next major support is the $1400-$1450 and Ethereum resistance area $1731 -$1832
Remember:-This is not a piece of financial advice. All investment made by me is at my own risk and I am held responsible for my own profit and losses. So, do your own research before investing in this trade.
Thanks for your time, we hope our work is good for you, and you are satisfied, we wish you a good day and big profits.
THANK YOU.
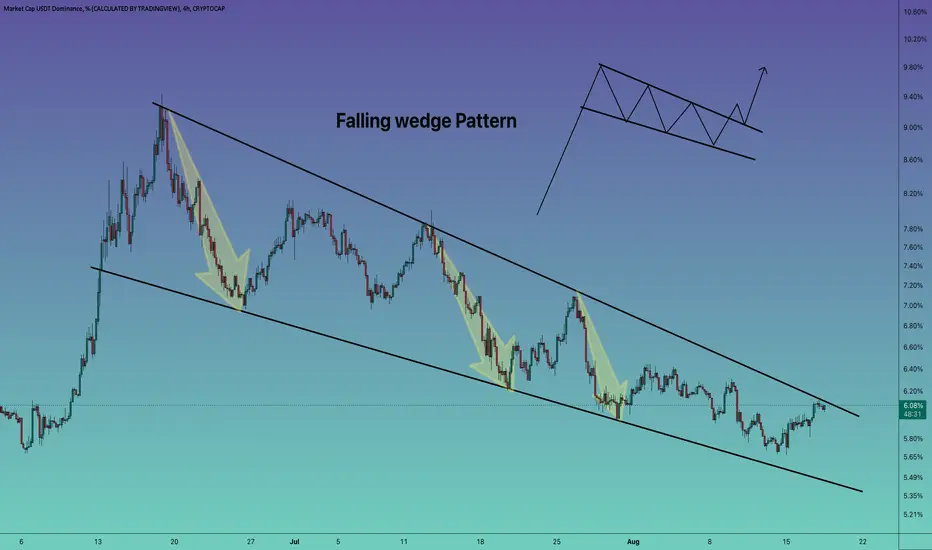
#USDT.DOMINANCE 4Hr UPDATE !!Hello dear traders, we here new so we ask you to support our ideas with your LIKE and COMMENT, also be free to ask any question in the comments, and we will try to answer for all, thank you, guys.
USDT dominance analysis:-
Dominance has been rejected several times by this resistance, so we expect it to be rejected this time too, but dominance is falling, and the wedge pattern remains. If the upper side is broken, the altcoin dumps
This is not a piece of financial advice. All investments made by me are at my own risk and I am held responsible for my profits and losses. So, do your own research before investing in this trade.
Thank you for your time, we hope that our work is good for you, and you are satisfied, we wish you a good day and big profits.
Thanks.
#USDT.DOMINANCE 4Hr UPDATE BY CRYPTOSANDERS !!Hello dear traders, we here new so we ask you to support our ideas with your LIKE and COMMENT, also be free to ask any question in the comments, and we will try to answer for all, thank you, guys.
USDT dominance analysis
If USDT dominance follows this then we may see a big dump in the BTC price.
This is not a piece of financial advice. All investments made by me are at my own risk and I am held responsible for my profits and losses. So, do your own research before investing in this trade.
Thank you for your time, we hope that our work is good for you, and you are satisfied, we wish you a good day and big profits.
Thanks.

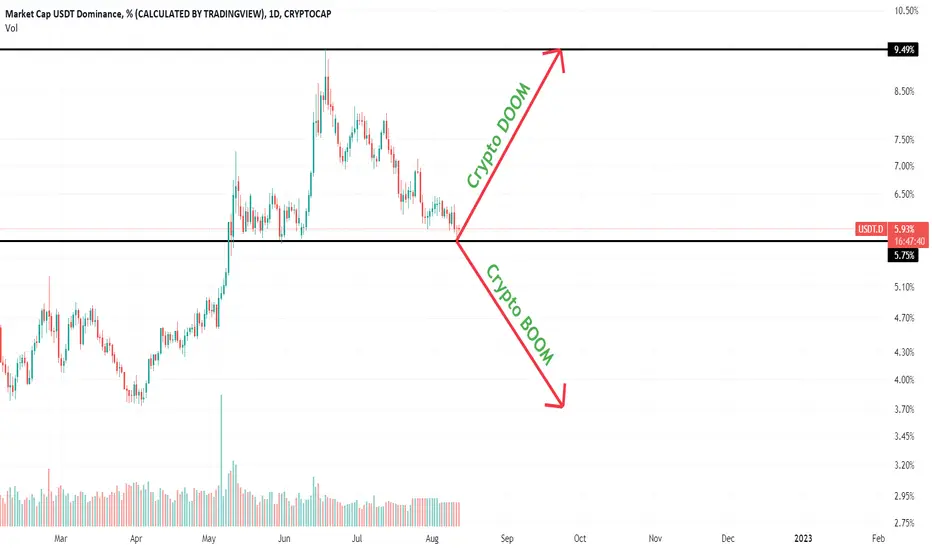
USDT.D is at critical supportHi Traders,
The USDT dominance is at critical support now.
Two possible scenarios:
1. Crypto DOOM (85% probability)
2. Crypto BOOM (15% probability)
Keep an eye on it, I think the whole crypto market will keep bullish movements until the end of Aug, and we will see a significant correction in all markets in Sep.
Please hit the boost button if you agree.
Thanks.
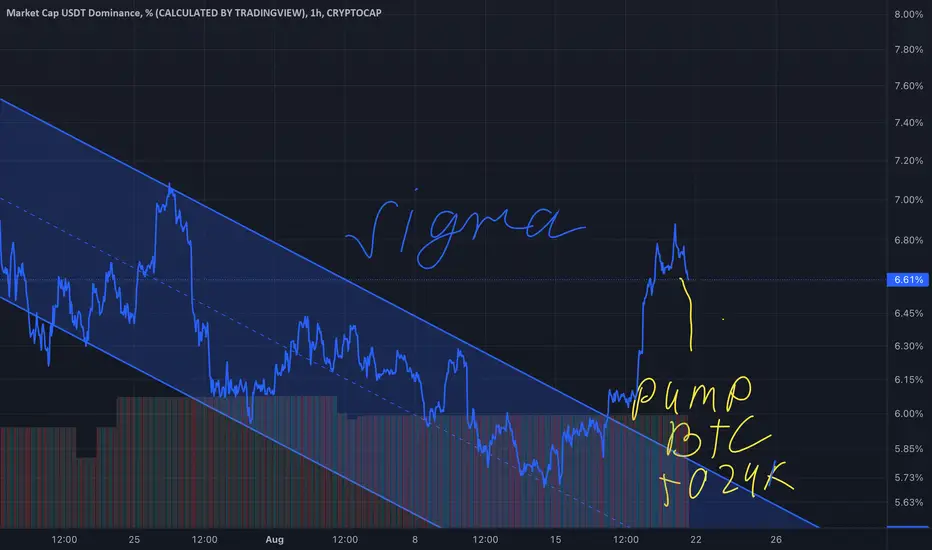
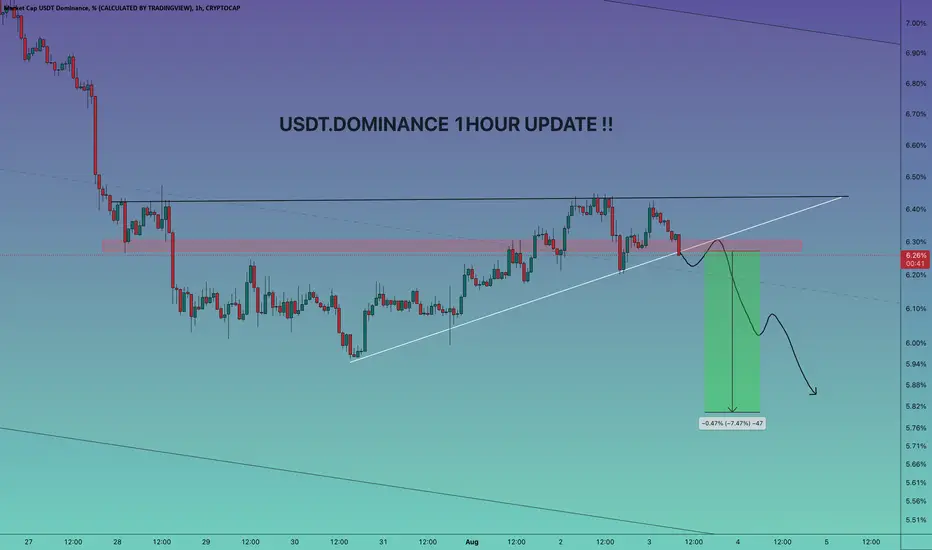
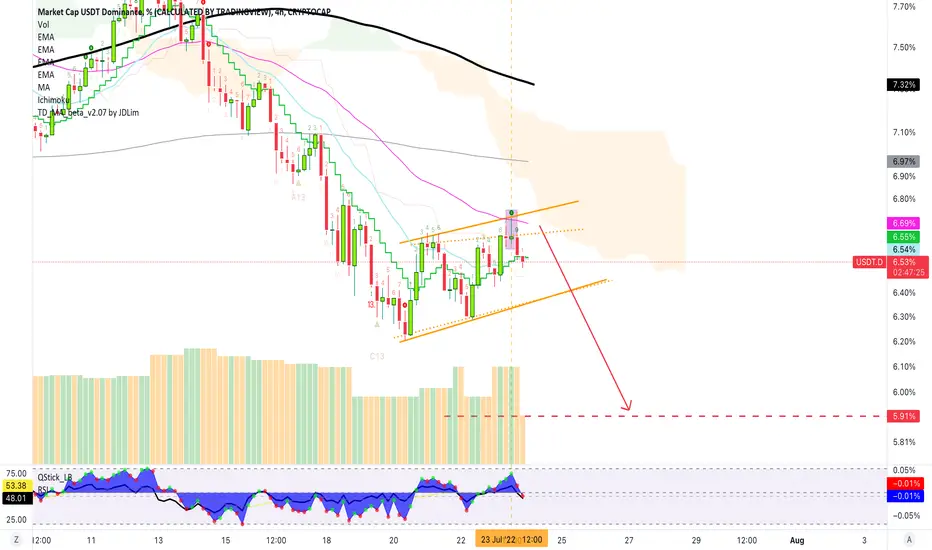
USDT.DOMINANCE 1HOUR UPDATE !!Hello dear traders, we here new so we ask you to support our ideas with your LIKE and COMMENT, also be free to ask any question in the comments, and we will try to answer for all, thank you, guys.
USDT dominance analysis
If Dominance does a triangle break down from here then we can see that Dominance almost 8% dump to which Altcoin and Pump will happen
This is not a piece of financial advice. All investments made by me are at my own risk and I am held responsible for my profits and losses. So, do your own research before investing in this trade.
Thank you for your time, we hope that our work is good for you, and you are satisfied, we wish you a good day and big profits.
Thanks.
USDT.DOMINANCE 6Hr UPDATE !!Hello dear traders, we here new so we ask you to support our ideas with your LIKE and COMMENT, also be free to ask any question in the comments, and we will try to answer for all, thank you, guys.
USDT dominance analysis
In current scenario USDT DOMINANCE hitting the resistance level and here it needs to reject from here print down fall.
As majority coins are already down by 15% - 20% gain above will lead more red candles at ALT COINS.
Rejection will bring relief to alt coins or break above will lead USDT DOMINANCE towards the upper trend line resistance at 6.7% level which will be unsatisfactory for alt coins
This is not a piece of financial advice. All investments made by me are at my own risk and I am held responsible for my profits and losses. So, do your own research before investing in this trade.
Thank you for your time, we hope that our work is good for you, and you are satisfied, we wish you a good day and big profits.
Thanks.

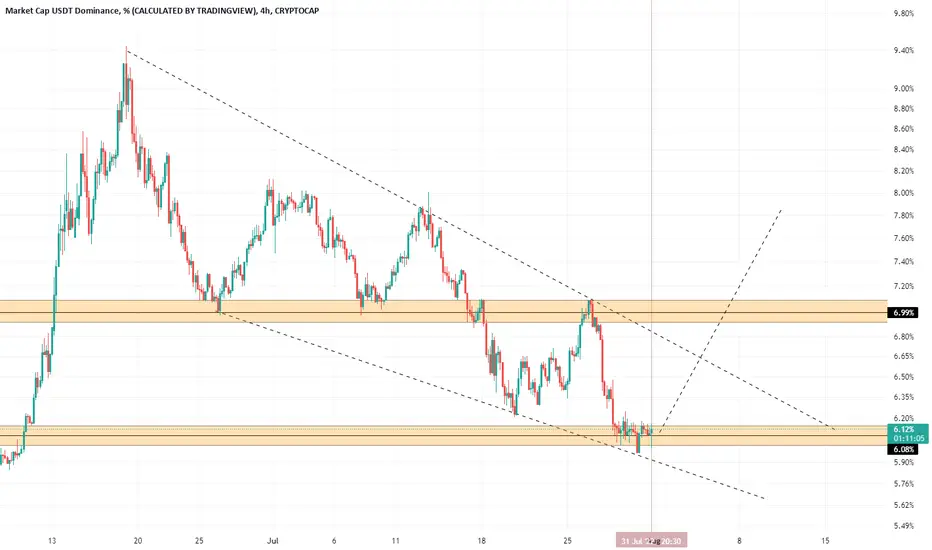
#USDT.DOMINANCE 4HOUR UPDATE !!USDT dominance analysis
As USDT DOMINANCE is trading inside the falling channel pattern on a lower trend line and crucial support zone , here it needs to break below to bring a consecutive green candle in ALT coins.
If we consider MACD is moving upwards and it’s about to print a bullish cross which is an indication for a green candle in STABLE DOMINANCE towards the upper trend resistance.
Bounce from the current level will lead dominance towards its upper trend line resistance.
Break below from current will be great for altcoins to print green candles.
This is not a piece of financial advice. All investments made by me are at my own risk and I am held responsible for my profits and losses. So, do your own research before investing in this trade.
Thank you for your time, we hope that our work is good for you, and you are satisfied, we wish you a good day and big profits.
Thanks.

USDT.D falling wedge pattern everything is clear on the chart, start to test the top of the pattern or lose the support zone?
Drops Below EMA100 | Bearish ConfirmedThere is nothing bearish for cryptocurrency in us seeing the Tether Dominance Index go bearish.
This is bullish for the entire cryptocurrency market.
The close below EMA100 is the main red signal we look at today.
Seeing a red candle below this level, blue line on the chart, is the bearish confirmation.
Today is just continuation.
Do not expect any pullbacks this thing is about to speed up.
See you above $26,000 Bitcoin.
See you at $2500 Ethereum...
Let's see how all the Altcoins also grow.
Namaste.
$USDT.D always full of answersThat tiny green line is gonna give a big reaction and it is by no means support ;)
Bitcoin To $35K, Ethereum To $3K, Ethereum Classic To $140, etc.The week is not early but it still has to close.
We have a shooting star candle line, a strong bearish signal, can lead to a price drop.
With the inverse correlation with Crypto and this one (Tether Dominance Index) chart, we have confirmation of many bullish charts.
Namaste.

Reject50Shooting.DStarUSDT-BearMAThe purple highlighted candlestick line is a shooting star.
We have a rejection here at EMA50.
The next bearish candle works as confirmation.
Closing below EMA10 gives double confirmation.
And the bear flag works as continuation.
I will show you the weekly chart later on...
You will see that it will close below EMA10 for the first time and when that happens, finally, Bitcoin will do its $4,000 to $6,000 price jump.
Hello!
Weekly USDT.D Says All Cryptos Go Full GREEN!This is the chart that I mentioned in a previous trade idea on this index... This is what gives it all away.
Tether Dominance Index (USDT.D) is closing weekly below EMA10 for the first time since March.
This is a strong bearish development after 4 weeks of red/moving lower/distribution...
So not just Bitcoin, EVERYTHING CRYPTO WILL GROW SUPER STRONG!
We will have a full green August, based on these charts.
Namaste.

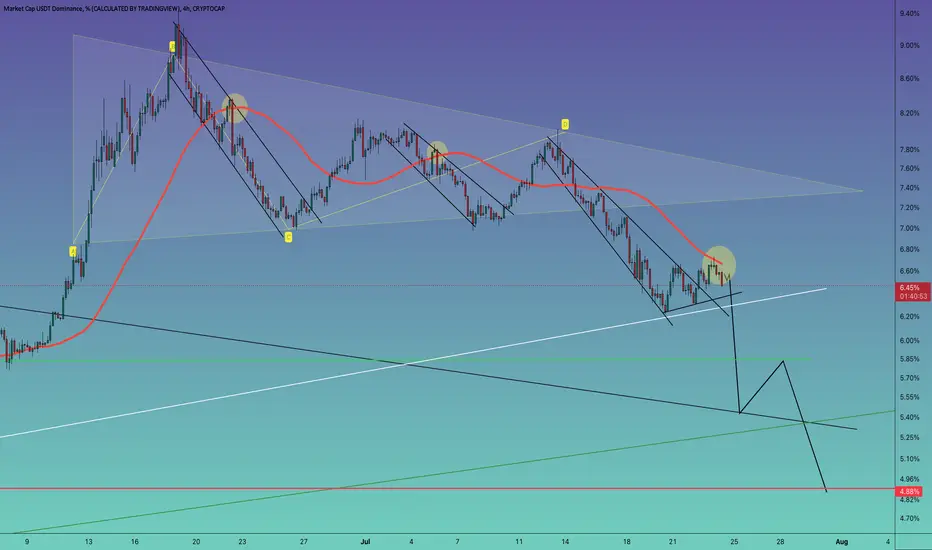
#USDT.DOMINANCE UPDATE 4HOUR!!USDT dominance analysis
USDT Dominance Resistance Label Red Zone & Breaks USDT Dominance Breaks trend line Downside Then USDT Dominance Will dump and downside 4.88 and 5.84% and Altcoins pump and Pump BTC.
This is not a piece of financial advice. All investments made by me are at my own risk and I am held responsible for my profits and losses. So, do your own research before investing in this trade.
Thank you for your time, we hope that our work is good for you, and you are satisfied, we wish you a good day and big profits.
Thanks.
USDT.DOMINANCE 4HOUR UPDATE !!USDT DOMINANCE ANALYSIS
USDT dominance support label red zone and brake USDT dominance breaks 21 MA downside then USDT dominance could see 5.84% plus 4.88 altcoins will pump and BTC will pump
This is not a piece of financial advice. All investment made by me is at my own risk and I am held responsible for my own profit and losses. So, do your own research before investing in this trade.
Thanks for your time, we hope our work is good for you, and you are satisfied, we wish you a good day and big profits.
THANK YOU.

Tether Dominance Looses Major Support, Bitcoin To The Moon!USDT.D Gapped down today and after some strugle with EMA100 (blue line on the chart), the bears came out on top...
This is good news as Tether Dominance drops Bitcoin grows.
We are open to see a $4,000 USD day on Bitcoin maybe this same week.
Looking at the bearishness of the USDT.D chart, gives confirmation.
The next support that will be challenged will be 5.60% follwod by 5.26/5.05%.
With such a huge drop not only Bitcoin will grow but the entire cryptocurrency market is about to enter an impulsive bullish phase.
Namaste.
