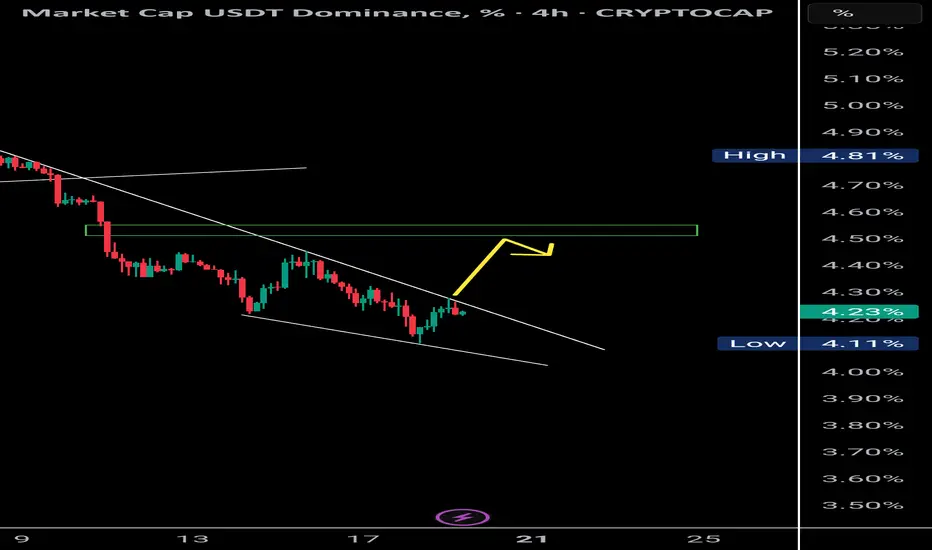
USDT Dominance – Potential Wave F Reversal?
We are tracking a NeoWave Diametric formation (7-leg corrective structure: A–B–C–D–E–F–G) on the USDT Dominance chart. Recently, price reached the projected resistance zone of wave E, and early signs of reversal are emerging.
⸻
🧠 Structural Analysis:
• The structure has developed with alternating legs in price and time, consistent with the symmetrical diametric rules.
• Wave E has likely completed, reacting from prior supply and resistance.
• A pullback from here can mark the beginning of Wave F, which in diametrics tends to retrace significantly toward the internal balance of the structure.
⸻
🔍 What to Watch:
• Confirmation of bearish intent via a break of internal supports or lower-timeframe BOS.
• Possible retracement targets: 4.2% → 3.95%, depending on momentum.
• A decisive break below 4.00% would reinforce the wave F scenario.
⸻
⚠️ Implications for the Crypto Market:
A drop in USDT Dominance typically indicates rotation into risk assets (alts/BTC/ETH). However, context matters — if the drop happens during a general market sell-off, it may reflect risk-off unwinding into fiat, not risk-on rotation.
⸻
🔄 Strategy Note:
• Avoid premature shorts or longs; wait for structure to confirm.
• Watch for smart money traps (e.g., false breakouts or liquidity grabs) around the recent highs.
⸻
📌 This is a high-risk zone for entering long USDT.D — be cautious with stablecoin bias.
📊 Analysis by CryptoPilot – Precision through structure.
Usdtdominance
Tether Rakes in $4.9B Q2 Profit, Cementing Its Reign as Crypto’sTether Q2 Net Profit Hits $4.9 Billion, Pushing Total Earnings to $5.7 Billion: What It Means for the Crypto Industry
Tether Holdings Ltd., the issuer of the world’s largest stablecoin USDT, has once again made headlines with its Q2 2025 earnings report, revealing a staggering net profit of $4.96 billion. This brings the company’s total profits for the first half of the year to $5.7 billion—a record-breaking milestone for both the company and the broader stablecoin ecosystem.
This article explores the implications of Tether’s Q2 performance, the sources of its revenue, its impact on the crypto markets, and the growing significance of stablecoins in the evolving financial landscape.
________________________________________
A Record-Setting Quarter for Tether
Tether’s Q2 2025 results have astonished even seasoned analysts. The company’s reported $4.96 billion in net profit in a single quarter represents one of the most profitable periods in the history of any fintech or crypto-native company. What’s even more remarkable is that this profit was not driven by speculative trading or token sales, but by conservative, yield-generating strategies rooted in traditional finance.
The company’s Q1 earnings were already impressive at $0.76 billion, but Q2’s results eclipse those numbers entirely. Tether’s cumulative profit year-to-date now stands at $5.72 billion, putting it on track to potentially exceed $10 billion in earnings for the full year if current trends continue.
________________________________________
What’s Driving Tether’s Massive Profit?
Tether’s incredible profitability is primarily fueled by one key factor: the interest earned on its reserves. As the issuer of USDT, Tether is responsible for maintaining a 1:1 backing of every token in circulation. These reserves are primarily held in short-term U.S. Treasury Bills (T-Bills), reverse repos, and cash equivalents.
Here’s a breakdown of the main profit drivers:
1. High Interest Rates on U.S. Treasuries
With the U.S. Federal Reserve maintaining elevated interest rates to combat inflation, short-term T-Bills have become highly lucrative. Tether holds tens of billions of dollars in these instruments, generating billions in annual interest income.
For example, the yield on a 3-month Treasury bill in Q2 2025 averaged around 5.2%, and Tether’s reserve base has hovered near $90 billion to $100 billion. Even a conservative allocation can earn several billion dollars in annual yield.
2. Reverse Repurchase Agreements (Reverse Repos)
Tether has also expanded its use of reverse repos, which allow it to lend cash to counterparties in exchange for securities, earning a premium on the transaction. This has contributed significantly to its earnings, especially in a high-yield environment.
3. Gold Holdings and Bitcoin Exposure
Tether has acknowledged that a small portion of its reserves includes gold and Bitcoin holdings. These assets appreciated in Q2, contributing to the overall profit. While not the primary revenue source, their performance added notable value during the quarter.
4. Equity Investments
The company has begun investing in infrastructure and technology firms related to blockchain and AI. While these investments are not liquid, mark-to-market gains may have also contributed to the net profit figure.
________________________________________
A Closer Look at Tether’s Reserve Report
Tether’s Q2 attestation report, published alongside its earnings update, provides transparency into how its assets are allocated. Here are some highlights:
• Over 85% of reserves are held in U.S. Treasury instruments
• $5.4 billion in excess reserves—a buffer above the value of circulating USDT
• $3.3 billion in gold and Bitcoin holdings
• Minimal exposure to unsecured commercial paper or riskier debt instruments
Tether has continuously emphasized its commitment to transparency and risk management. Unlike in its early years, when it faced criticism over opaque reserve practices, the company now releases quarterly attestations audited by third-party firms such as BDO Italia.
________________________________________
USDT’s Growing Dominance
Tether’s profits are closely tied to the growth of its flagship product: USDT, the world’s largest stablecoin by market cap. As of August 2025, USDT has a circulating supply exceeding $110 billion, giving it a dominant share of the stablecoin market.
This growth can be attributed to several factors:
1. Increased Adoption in Emerging Markets
USDT is widely used in countries with unstable fiat currencies, such as Argentina, Nigeria, and Turkey. For many users, USDT represents a dollar-denominated safe haven in environments plagued by inflation and capital controls.
2. DeFi and Cross-border Payments
USDT continues to be a core asset in decentralized finance (DeFi) protocols, serving as a stable medium of exchange and collateral. It's also a preferred tool for cross-border remittances, given its speed and low transaction costs compared to traditional banking systems.
3. Institutional Integration
Major crypto exchanges, custodians, and payment processors have incorporated USDT into their platforms, driving further liquidity and utility. In many cases, USDT is preferred over fiat due to its 24/7 availability and blockchain-native nature.
________________________________________
What Does This Mean for the Crypto Industry?
Tether’s Q2 performance is more than just a corporate milestone—it’s a bellwether moment for the crypto industry. It signifies the maturation and institutionalization of digital assets and stablecoins. Here’s what it means for the broader ecosystem:
1. Stablecoins as Profitable Financial Products
Tether’s profitability proves that stablecoins are no longer just “crypto plumbing.” They are now financial products generating billions in yield, much like money market funds. This is reshaping how investors and regulators think about stablecoins—not as speculative tools, but as interest-bearing assets backed by real-world securities.
2. Regulatory Scrutiny Will Intensify
With Tether generating profits that rival traditional banks, expect regulators to increase oversight. Stablecoins have long been in the crosshairs of the U.S. Treasury, SEC, and global central banks, and Tether’s dominant market share will likely place it under further examination.
However, Tether’s transparency efforts, including quarterly attestations and reserve disclosures, may help it navigate these regulatory waters more effectively than in the past.
3. Competition Will Escalate
Tether’s extraordinary profits will likely attract new entrants and existing competitors to the stablecoin arena. Circle’s USDC, PayPal’s PYUSD, and even central bank digital currencies (CBDCs) are all vying for market share.
Tether’s early-mover advantage, global reach, and deep liquidity make it hard to displace, but increased competition could pressure margins in the long term.
4. Decentralized Alternatives Will Seek Market Share
Decentralized stablecoins like DAI, FRAX, and USDD aim to offer alternatives to centralized issuers like Tether. While they remain relatively small, the ethos of decentralization might gain appeal, especially in regulatory-heavy environments.
Still, decentralized stablecoins have struggled to maintain pegs during market stress, giving Tether an edge in terms of trust and resilience.
________________________________________
The Road Ahead for Tether
As Tether moves into the second half of 2025, several strategic themes will define its trajectory:
Continued Profitability
If interest rates remain elevated and USDT circulation continues to grow, Tether’s annual profit could reach or exceed $10 billion—putting it in league with the most profitable fintech firms globally. This surplus could be reinvested in:
• Infrastructure expansion
• Strategic acquisitions
• Reserve diversification
• R&D for stablecoin innovation
Expansion into Emerging Markets
Tether has hinted at expanding its presence in Latin America, Africa, and Southeast Asia, where demand for dollar-denominated assets is high and banking infrastructure is limited. Expect to see more localized partnerships and on-ramp/off-ramp solutions.
Embracing Blockchain Innovation
Tether is already deployed on multiple blockchains—Ethereum, Tron, Solana, and more. The company is likely to support new Layer 1s and Layer 2s to enhance speed, reduce costs, and maintain competitiveness in the DeFi space.
There are also rumors that Tether may be exploring tokenized asset offerings and programmable money features, allowing USDT to integrate more deeply with smart contracts and enterprise use cases.
________________________________________
Criticisms and Controversies: Still Lingering?
Despite its success, Tether continues to face criticism from parts of the crypto community and regulatory world. Concerns include:
• Lack of full audits (attestations are not the same as full financial audits)
• Opaque ownership structure
• Past legal issues, including settlements with the New York Attorney General and the U.S. CFTC
However, it’s worth noting that Tether has addressed many of these concerns over the past two years. Its transparency has improved, and its operations have become more conservative and professional.
Still, its scale and impact on the crypto market mean that any misstep could have systemic consequences. Investors and regulators alike will continue to scrutinize its activities.
________________________________________
Final Thoughts: Tether’s Moment of Ascendance
Tether’s Q2 2025 net profit of $4.96 billion doesn’t just reflect a successful quarter—it marks a paradigm shift in crypto finance. What began as a controversial stablecoin project has evolved into a global financial powerhouse, rivaling traditional banks and asset managers in profitability.
More than just a win for Tether, this moment signals the growing legitimacy of stablecoins in the global financial system. It shows that crypto-native firms can not only survive but thrive in traditional financial environments, leveraging yield, transparency, and blockchain infrastructure to create sustainable business models.
As the world watches, Tether’s next chapters will likely be shaped by innovation, regulation, and global expansion. But for now, with $5.7 billion in profits in just six months, one thing is clear:
Tether is no longer just a stablecoin issuer—it’s one of the most powerful financial entities
in the digital age.
________________________________________
Disclaimer: This article is for informational purposes only. It does not constitute financial advice. Always conduct your own research before making investment decisions.
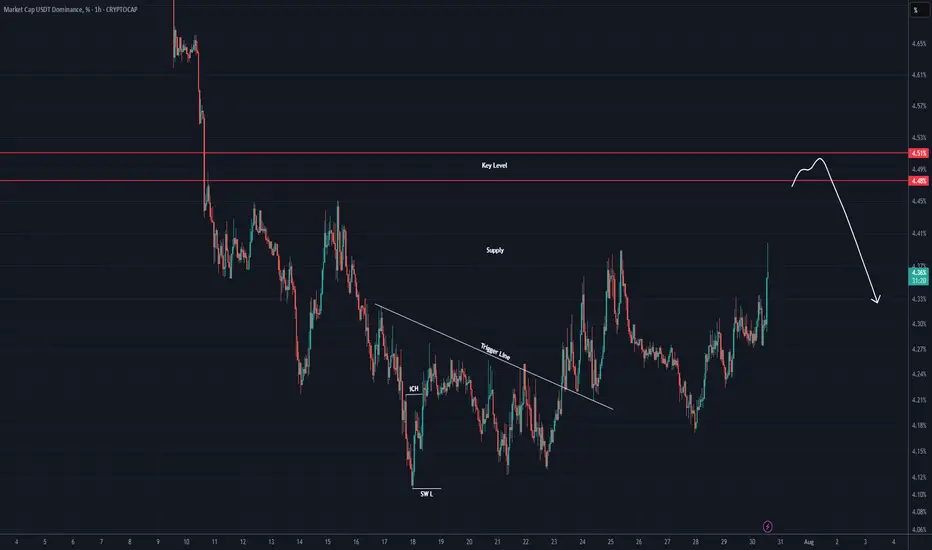
Major Bearish is scenario is comingUSDT dominance has reached a strong support level, forming an Inverted Head and Shoulders pattern. The last leg of the pattern touched the support with an ABC pullback, creating an inverted wedge.
USDT DOMINANCE New Update (4H)First of all you should know that "USDT Dominance" is always moving inverse of BTCUSDT
We have a key level on the chart that This key level has been lost, and there hasn't been a pullback to it yet. It seems that the candles intend to make a pullback to this level. Upon this pullback, we expect a rejection to the downside.
Let's see what happens.
For risk management, please don't forget stop loss and capital management
Comment if you have any questions
Thank You
USDT DOMINANCE Update (2H)After losing important levels, the price has now started to pull back, and it seems that some of the market’s major players have taken profits.
On the chart, the price faces two key levels ahead, from which it could be rejected at either one.
There is also a possibility that the price will reach the key level zone.
We are waiting for the reaction to these levels.
A daily candle close above the invalidation level will invalidate this analysis.
For risk management, please don't forget stop loss and capital management
Comment if you have any questions
Thank You

$USDT Dominance Breakdown Soon?Here’s a quick take on the CRYPTOCAP:USDT.D 1H chart: USDT dominance is bumping into a key trendline around 4.28%, right below strong resistance at 4.30%.
If it gets rejected here, we could see a drop toward 4.18%, which would be a healthy sign for altcoins.
But if dominance breaks above 4.30% with a strong candle close, that bearish setup gets invalidated.
Keep an eye on this zone, it’s a make-or-break moment.
DYOR, NFA

USDT.D(based on NEo wave)I consider this branch as a flat and c wave is the terminal with 3rd extended.
stop loss is 4.4.
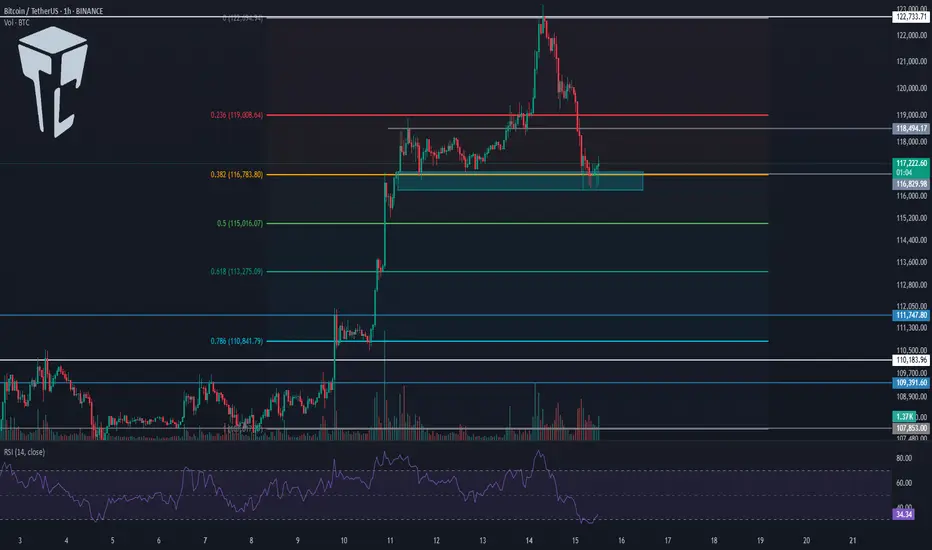
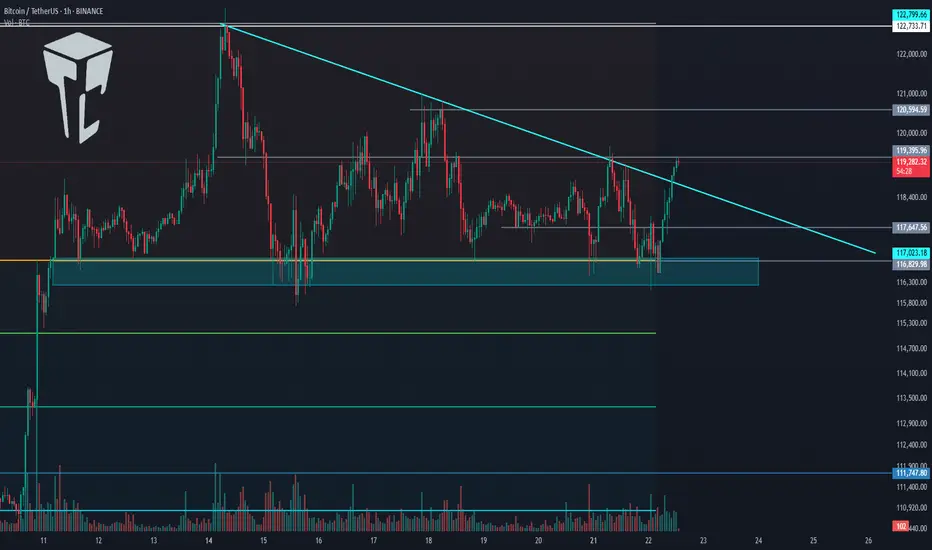
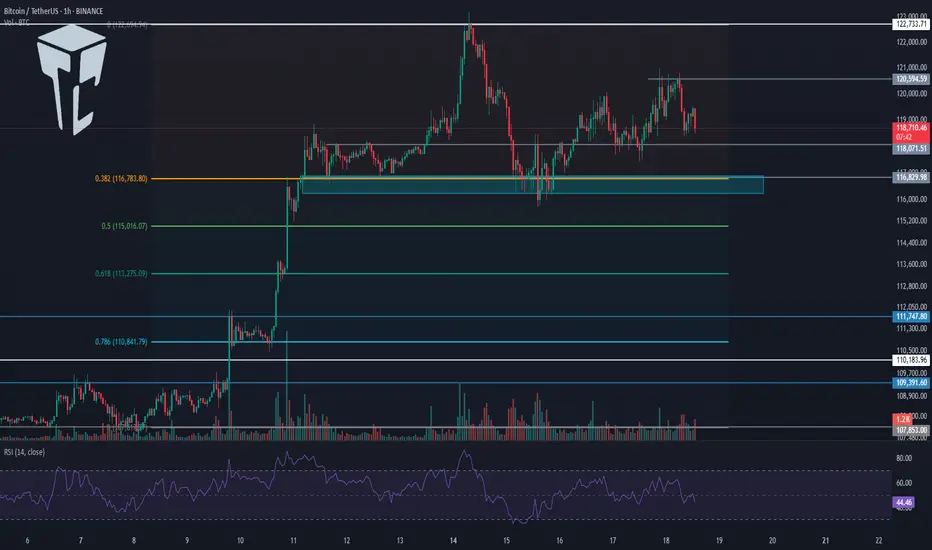
TradeCityPro | Bitcoin Daily Analysis #136👋 Welcome to TradeCity Pro!
Let’s get into the analysis of Bitcoin and major crypto indices. As usual in this analysis, I’m going to review the futures triggers for the New York session.
⏳ 1-Hour Timeframe
On the 1-hour timeframe, price is still ranging inside the box, and none of its triggers were activated yesterday.
✔️ The support floor is at 117,342, and another key support zone is around 116,000.
✨ If these zones break, Bitcoin may begin a deep correction. In that case, we can open short positions or close long-term long positions that we’re already holding.
⭐ For long positions, we still have the 119,395 and 120,594 triggers. A breakout of either zone could provide a very good entry point for the next bullish leg of Bitcoin.
👑 BTC.D Analysis
Let’s move on to Bitcoin Dominance. Yesterday, dominance stabilized above the 61.20 zone, and as I mentioned before, breaking this zone led to a bullish leg, which continued up to 62.41, and currently, it has more bullish momentum.
💥 If 62.41 breaks, the bullish momentum will intensify. However, I still believe the overall trend is bearish, and if 60.46 breaks to the downside, the decline could continue.
📅 Total2 Analysis
Let’s go over Total2. This index has continued to correct and has now dropped to the 1.41 zone, which corresponds to the 0.5 Fibonacci level. It has now created a trigger around 1.47.
⚡️ If 1.47 breaks, we can open a long position. Our next trigger will be 1.53.
A breakout of 1.53 would signal the start of the next bullish wave.
📅 USDT.D Analysis
Now to Tether Dominance. This index has finally exited its range box and has broken the 4.25 level.
The current resistance stopping price is 4.36.
🔔 If dominance drops back below 4.25, strong bearish momentum could hit, increasing the likelihood of a breakdown of 4.13.
❌ Disclaimer ❌
Trading futures is highly risky and dangerous. If you're not an expert, these triggers may not be suitable for you. You should first learn risk and capital management. You can also use the educational content from this channel.
Finally, these triggers reflect my personal opinions on price action, and the market may move completely against this analysis. So, do your own research before opening any position.
TradeCityPro | Bitcoin Daily Analysis #135👋 Welcome to TradeCity Pro!
Let’s move on to the analysis of Bitcoin and major crypto indices. In this analysis, as usual, I’m going to review the futures triggers for the New York session.
⏳ 1-Hour Timeframe
Yesterday, Bitcoin broke the 119,395 level but couldn’t hold above it and has now returned below this level, currently sitting on its previous trendline.
✔️ Today, the market will probably try to form more structure, and I think Bitcoin will range.
⭐ However, if it wants to move, we can enter a long position with the trigger at 120,594.
🔽 For a short position, we can enter if the 116,000 support area breaks.
👑 BTC.D Analysis
Let’s move on to Bitcoin Dominance. Yesterday, dominance had a bullish move, and finally, a support floor managed to prevent further drop in dominance.
🧩 A retracement to 61.20 has occurred. If this retracement continues, the upper levels are 61.53 and 62.
A break of 60.46 will start the next bearish leg.
📅 Total2 Analysis
Let’s go to Total2. This index has formed a range box between 1.48 and 1.55 and is still oscillating within it.
🎲 If 1.55 breaks, we can open a long position, and on the other hand, if 1.48 breaks, the price could correct to lower support levels.
📅 USDT.D Analysis
Let’s move on to Tether Dominance. This index also has a range box and is still moving inside it.
🔑 Breaking 4.13 is very important for the future market trend and could lead to a drop in dominance.
Altcoin Season May Be Real This TimeBitcoin Dominance Finally Breaks – Altcoin Season May Be Real This Time
Since late 2022, Bitcoin Dominance has been on a steady rise — and during this time, the vast majority of altcoins have bled heavily, losing value both in USD and BTC terms.
The long-awaited “altcoin season” became a meme more than a market event.
Every rally was short-lived, and rotation never truly materialized.
Until now...
________________________________________
📉 A Technical Break That Matters
Looking at the BTC.D chart, we finally see something meaningful:
➡️ A clear technical breakdown under confluence support given by the horizontal one and the rising trend line, which held for months and provided the structure for BTC outperformance.
At the same time, Bitcoin is stable around the 120k zone, and the price action suggests strength — not mania, not collapse — just solid consolidation at high levels, and most probably preparing for new ATHs.
This environment historically tends to be favorable for alts.
________________________________________
USDT Dominance (USDT.D) Also Pointing Lower
The USDT.D chart adds even more confluence to the idea:
• It's now pointing towards support
• The structure suggests there’s room for a further drop, which historically means more money flowing into risk assets — particularly altcoins
When stablecoins dominance drops, it usually reflects increased market participation and risk-on behavior — exactly what altcoins need to finally shine.
________________________________________
🔍 What Am I Doing?
I’ve already started buying selected altcoins and I'm looking to add more on dips.
This technical shift is meaningful. It’s not about catching hype, it’s about recognizing a real potential rotation.
In conclusion, I’ll be looking for strong altcoin setups to buy on pullbacks,
as I believe the next weeks and months could offer the kind of upside that can at least double my investment (yeah, yeah, I'm not "to the mooner, hoping for 100x ).

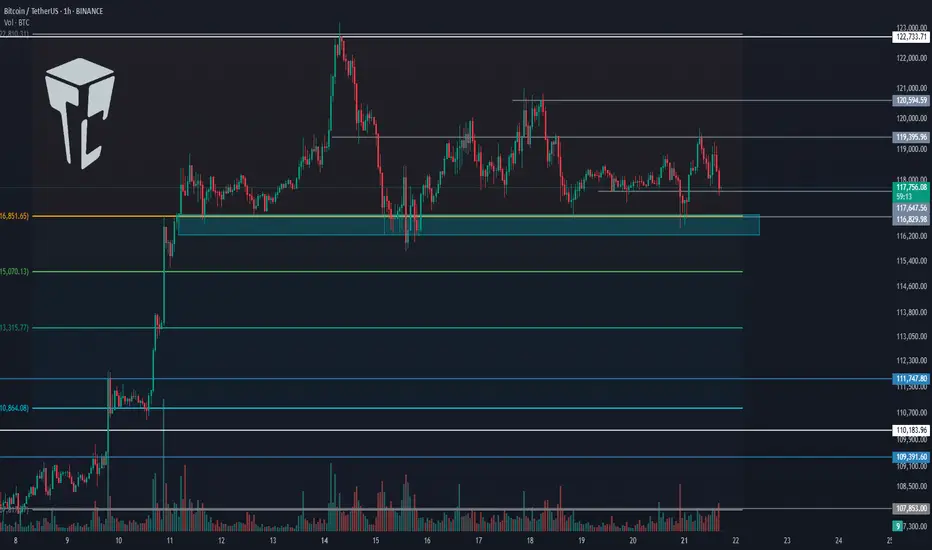
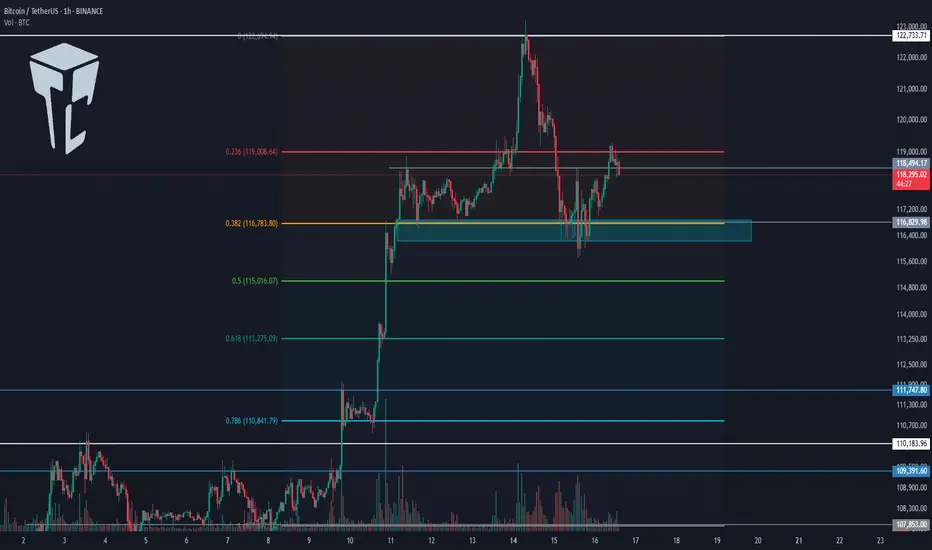
TradeCityPro | Bitcoin Daily Analysis #134👋 Welcome to TradeCity Pro!
Let’s dive into the Bitcoin analysis and key crypto indices. As usual, in this analysis I will review the New York futures session triggers for you.
⏳ 1-Hour Timeframe
On the 1-hour timeframe, Bitcoin has formed a range box between 116829 and 119395. Yesterday, after getting supported at 116829, it climbed back to the top at 119395.
📊 As you can see, buying volume has increased, which indicates strong buyer momentum.
📈 If 119395 is broken, the price could move toward higher targets like 120594 and 122733.
🧩 This 119395 area is also the breakout trigger of the descending triangle. The bottom at 116829 has supported the price multiple times, and now with the descending trendline being broken, price could aim for higher resistance levels.
👑 BTC.D Analysis
Let’s move on to Bitcoin Dominance. BTC Dominance has been supported at 60.46, which is why Bitcoin is moving upward, while altcoins are dropping.
🎲 The dominance trend is still clearly bearish, and if 60.46 breaks, the next downward leg may begin.
📅 Total2 Analysis
Let’s look at Total2. This index has also formed a range between 1.48 and 1.55, and it is currently sitting at the bottom of the box.
🔔 If we get confirmation of support at 1.48, we can consider entering a long position. The main long trigger would be the break of 1.55.
📅 USDT.D Analysis
This index has also formed a range box. The previous support level was 4.08, which has now shifted to 4.13.
💥 The top of the box is 4.25. Given the bearish momentum in dominance, the probability of 4.13 breaking is higher.
🎲 So keep a close eye on altcoins in the coming days, because a lot of capital is flowing into them and they could see significant pumps.
❌ Disclaimer ❌
Trading futures is highly risky and dangerous. If you're not an expert, these triggers may not be suitable for you. You should first learn risk and capital management. You can also use the educational content from this channel.
Finally, these triggers reflect my personal opinions on price action, and the market may move completely against this analysis. So, do your own research before opening any position.
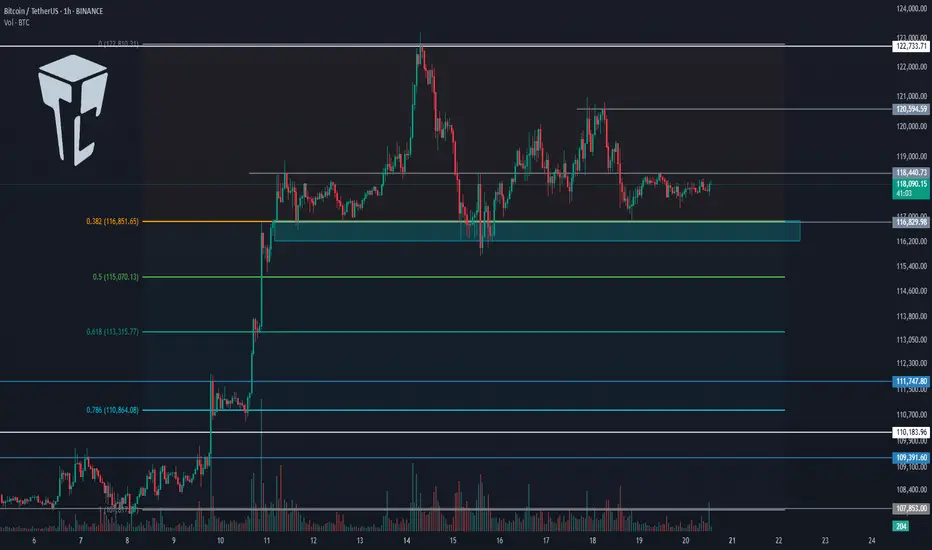
TradeCityPro | Bitcoin Daily Analysis #133👋 Welcome to TradeCity Pro!
Let's dive into the Bitcoin analysis and key crypto indexes. As usual, in this analysis, I’m going to review the triggers for the New York futures session.
⏳ 1-Hour timeframe
On the 1-hour timeframe, Bitcoin has once again dropped to the support area at 116829 and reacted to it. Currently, it is fluctuating above this level.
✨ If 119395 is broken, the price could move toward the highs at 120594 and 122733.
📈 So for a long position, we can enter on the breakout of 119395. Pay attention to Bitcoin dominance, because if it’s in a downtrend, Bitcoin setups might not be ideal, and altcoins may offer better opportunities.
✔️ If the price stabilizes below 117647, it will enter the box between 116829 and 117647, and this time the likelihood of breaking the 116829 bottom and heading toward lower supports for deeper corrections becomes very high.
👑 BTC.D Analysis
Now let’s look at Bitcoin Dominance. BTC.D is still falling and after breaking the 61.45 level, it has reached 60.46.
⭐ If this level breaks, the next bearish leg may begin. The trend is strongly bearish with no visible weakness, and we’ll have to see how long this continues.
📅 Total2 Analysis
Let’s move to Total2. This index has broken the 1.5 resistance and is moving toward 1.62.
💫 At the moment, I don’t have a trigger for it, and we need to wait until its structure gives us the next setup.
📅 USDT.D Analysis
Now let’s look at Tether Dominance. This index has stabilized below the 4.22 level and is now moving downward after a pullback to this area.
🧩 The next support is at 4.08, and the index has room to fall to that level. I still see the USDT Dominance trend as bearish for now.
#BTC.D Just Hit the DAILY SUPPORT, WILL THERE BE A PULLBACK?CRYPTOCAP:USDT is breaking out on LTF while BTC.D just hit support that looks ready to break down.
Not a short call, but if you've been trading well, this is when you reduce margin and cut leverage.
Although I could be wrong about USDT here but profit-taking matters.
We will probably get a pullback this week to enter again.
It's better to watch coins rise a few more waves without you than to give it all back in a few reckless trades.
Spot bags? HODL and DCA.
Futures? Trade cautiously.
DYOR. NFA.
Do show your support with your likes if this post adds any value, and hit the like button.
Thank You
#PEACE

TradeCityPro | Bitcoin Daily Analysis #132👋 Welcome to TradeCity Pro!
Let’s dive into the Bitcoin analysis and key crypto indices. As usual, in this analysis I’ll review the futures triggers for the New York session.
📅 1-Hour timeframe
On the 1-Hour timeframe, as you can see, Bitcoin is still holding the key support at 116829 and has been ranging between 116829 and 118440 since yesterday.
✨ Today, if the 118440 level breaks, we can open a solid long position. However, I still believe that due to Bitcoin Dominance being in a downtrend, altcoins are a much better choice for opening positions.
✔️ If you're only planning to trade Bitcoin, this trigger is suitable. The next entry points would be 120594 and 122733. If we open positions at all three triggers and the market moves upward, we can get strong risk-to-reward setups since we’ve entered with significant volume across three positions.
📊 If the 116829 level breaks downward, we might see sharper corrections. In that case, the next supports will be the 0.5 and 0.618 Fibonacci levels.
👑 BTC.D Analysis
Looking at Bitcoin Dominance, as you can see, the trend is heavily bearish and moving downward.
⭐ The downtrend in dominance is quite steep, and the next support we have is at 60.49. There’s still room for dominance to drop to this level.
📅 Total2 Analysis
Moving to Total2, yesterday the 1.46 trigger was activated and price moved to 1.5, and it is now sitting just below that level.
💫 If this level breaks, another bullish wave towards 1.62 could form.
📅 USDT.D Analysis
Looking at Tether Dominance, this index is also in a downtrend similar to Bitcoin Dominance, which shows that money is exiting both Bitcoin and Tether and entering altcoins.
🎲 So keep a close eye on altcoins in the coming days, because a lot of capital is flowing into them and they could see significant pumps.
❌ Disclaimer ❌
Trading futures is highly risky and dangerous. If you're not an expert, these triggers may not be suitable for you. You should first learn risk and capital management. You can also use the educational content from this channel.
Finally, these triggers reflect my personal opinions on price action, and the market may move completely against this analysis. So, do your own research before opening any position.
USDT DOMINANCE NEW UPDATE (1D)In a previous analysis, I mentioned that the long-term outlook for this parameter (USDT.D) remains extremely bearish. At the time, a bear flag was clearly visible—but it hadn’t been broken yet.
Well, now it has.
The breakdown confirms the bearish continuation, and there’s still more room to fall. As USDT.D continues to descend towards the projected target for Wave 3, we are likely to see a new All-Time High in Bitcoin, accompanied by a strong rally in many altcoins.
The main target for Wave 3 sits at 3.75%—a historically critical level. For years, USDT.D has never fallen below this zone, making it an extremely strong support area.
⚠️ Reminder: Consider taking profits when USDT.D approaches the 3.80–3.75% region. A reversal or temporary bounce is highly likely there.

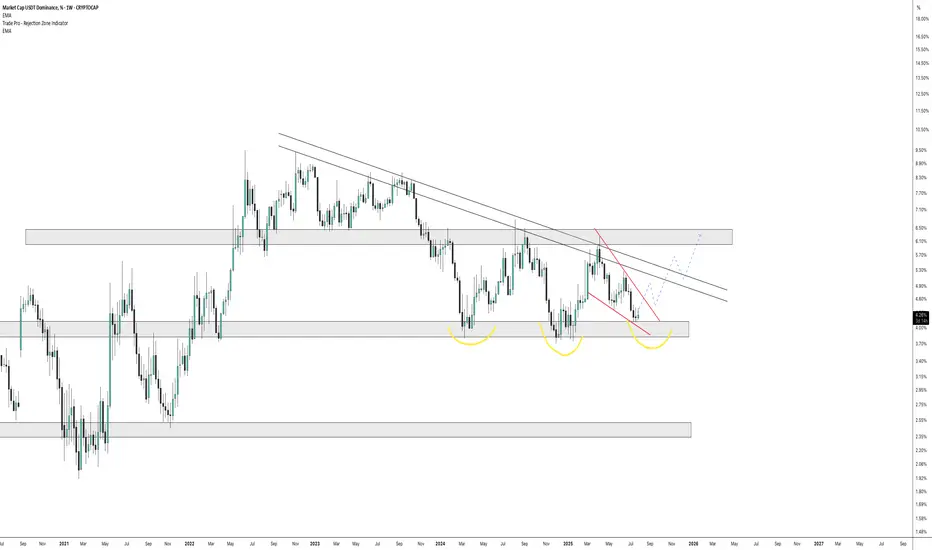
USDT.D Showing Troubling Signs of a Market Top SoonIn this video, I revist the USDT.D study I've talked about a few times before showing that when Tether Dominance comes down to this multi-year trendline support (since 2018), that's typically the beginning of a correction.
It's inversely related for obvious reasons. Money flowing out of Bitcoin and crypto flows into stablecoins (Like Tether), so when one is up and peaking, the other is down and correcting.
This video shows the relationship between both, and how we are likely setting up for a near term correction in the coming weeks.
My best guess is we continue to rally hard into early to mid-August, potentially getting close to $150k, followed by a 20-25% correction into September.
The BIG question is...
Will that mark the top, or will get a 2nd (and maybe 3rd) pump to $200k - $245k as my other models have been showing.
Let me know what you think!

USDT Dominance Forming Bullish Divergence | Altcoins May Retest 📉 USDT Dominance (4H):
Currently forming a bullish divergence with RSI, supported by a falling wedge structure. Price is respecting a clear supply OB (resistance zone) and might retest the 4.55% level.
🔁 Historically, a rise in USDT.D signals short-term corrections in BTC and altcoins, creating opportunities for OB/supply fills and long setups.
📊 This could be the retest phase for major crypto assets before resuming upward momentum.
🧠 Use this phase wisely — it’s where strong setups begin to form.
TradeCityPro | Bitcoin Daily Analysis #131👋 Welcome to TradeCity Pro!
Let’s dive into the Bitcoin analysis and key crypto indices. As usual, in this analysis, I’ll review the futures session triggers for New York.
⏳ 1-hour timeframe
Over the past few days, the market hasn't been very focused on Bitcoin, and altcoins have been moving more strongly to the upside.
⚡️ Bitcoin is still ranging between 116829 and 122733 and is fluctuating between these two levels.
💥 Currently, a local top has formed at 120594, and if that level breaks, we can open a long position. The main long trigger will be the breakout of 122733.
📈 If the market decides to correct, key support levels are 118071 and 116829. I’m setting the stop-loss for my previously opened positions below the 116000 zone.
👑 BTC.D Analysis
Let’s look at Bitcoin Dominance. The reason I’m saying Bitcoin isn't currently the center of attention is exactly this dominance chart.
🔔 As you can see, BTC Dominance is in a very sharp downtrend with strong momentum, which means capital is flowing out of Bitcoin and into altcoins—giving us better long setups on alts.
✨ For now, I see the trend as bearish, and the next supports are at 61.34 and 60.49.
📅 Total2 Analysis
Total2 is still moving upward and has broken above 1.46, continuing its upward momentum.
✔️ The new top is at 1.5, and a breakout above this level can be used as a trigger for long entries.
📅 USDT.D Analysis
Let’s move to Tether Dominance. The 4.22 support was broken yesterday, and the index is now moving downward.
💫 The next support level is 4.08, and breaking that will confirm continuation of the downtrend.
❌ Disclaimer ❌
Trading futures is highly risky and dangerous. If you're not an expert, these triggers may not be suitable for you. You should first learn risk and capital management. You can also use the educational content from this channel.
Finally, these triggers reflect my personal opinions on price action, and the market may move completely against this analysis. So, do your own research before opening any position.
USDT Dominance Looks Really Bearish In Big TimeFrames (3D)Before anything else, pay close attention to the timeframe | it’s a high timeframe and will take time to play out.
From the point where we placed the red arrow on the chart, it seems that the correction of USDT dominance has begun on the higher timeframes.
After wave A completed, the price entered wave B, which formed a symmetrical pattern, followed by an X wave and then a triangle.
Now that the triangle appears to be complete, we seem to be in the bearish wave C of a larger degree.
It is expected that in the coming months, the price will reach the green zone.
Note that this is a high timeframe analysis, and the move will take time, with lots of fluctuations along the way.
For risk management, please don't forget stop loss and capital management
Comment if you have any questions
Thank You

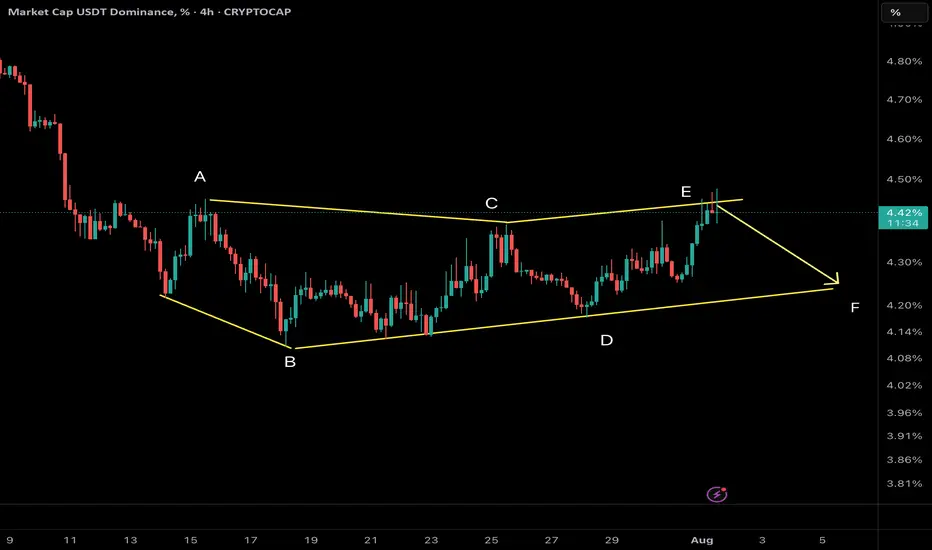
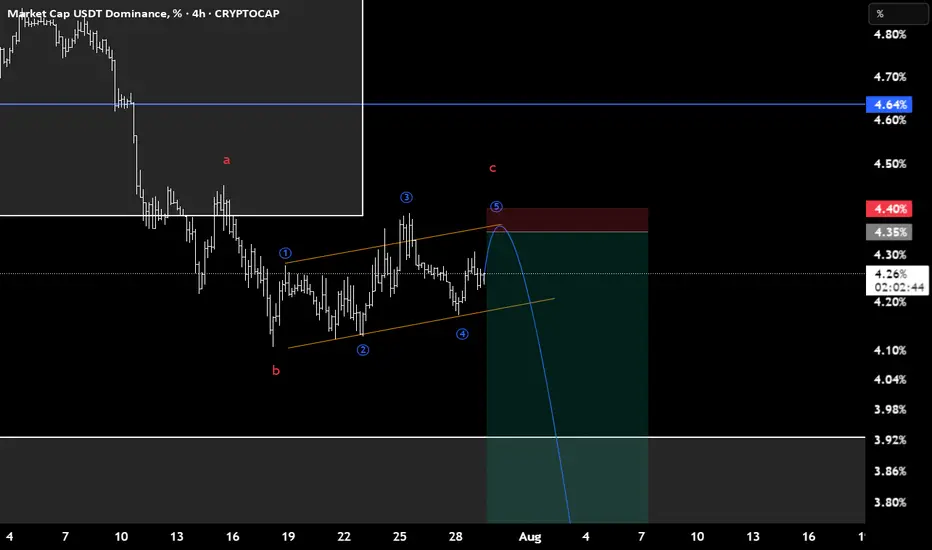
USDT DOMINANCE New Update (2H)This analysis is an update of the analysis you see in the "Related publications" section
According to the previous analysis, the price dropped nicely, which helped turn the market green.
Now the structure appears clearer, and we have a zigzag diamond pattern on the chart.
To complete wave F of this pattern, the price might move slightly higher toward the areas marked with yellow circles.
The price still hasn't reached the strong support zone and remains at a distance from it.
Let’s wait and see what happens.
For risk management, please don't forget stop loss and capital management
Comment if you have any questions
Thank You

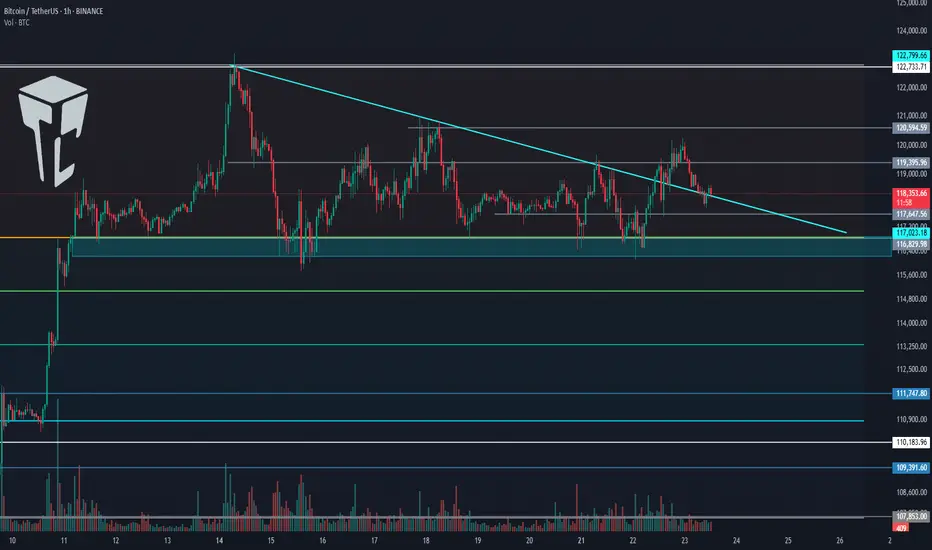
TradeCityPro | Bitcoin Daily Analysis #130👋 Welcome to TradeCity Pro!
Let’s dive into the Bitcoin analysis and key crypto indices. As usual, in this analysis, I’ll go over the futures triggers for the New York session.
⏳ 1-hour timeframe
As you can see in the 1-hour timeframe, Bitcoin was supported at the 116829 zone yesterday and is now moving upward.
📈 The long position trigger at 118494 has been activated, and the price is currently pulling back to this level.
💥 The 0.236 Fibonacci level is right above the price, and if it breaks, the price can continue moving upward.
⚡️ The current local top is 122733, which can be the first target for the long position. Breaking this level would also be our main trigger for a long entry.
👑 BTC.D Analysis
Bitcoin dominance is still falling and has now confirmed below the 63.96 zone.
🔍 Currently, the trend is fully bearish, and breaking 63.50 will confirm continuation of the downtrend.
📅 Total2 Analysis
Total2 is rising alongside the drop in Bitcoin dominance and has confirmed above 1.33.
🎲 The next resistance is at 1.41, and the current uptrend can continue toward that level.
📅 USDT.D Analysis
Tether dominance has confirmed below 4.36 and is continuing its downward move.
✔️ The next support is at 4.22, and breaking this level would initiate the next major bearish leg.
❌ Disclaimer ❌
Trading futures is highly risky and dangerous. If you're not an expert, these triggers may not be suitable for you. You should first learn risk and capital management. You can also use the educational content from this channel.
Finally, these triggers reflect my personal opinions on price action, and the market may move completely against this analysis. So, do your own research before opening any position.
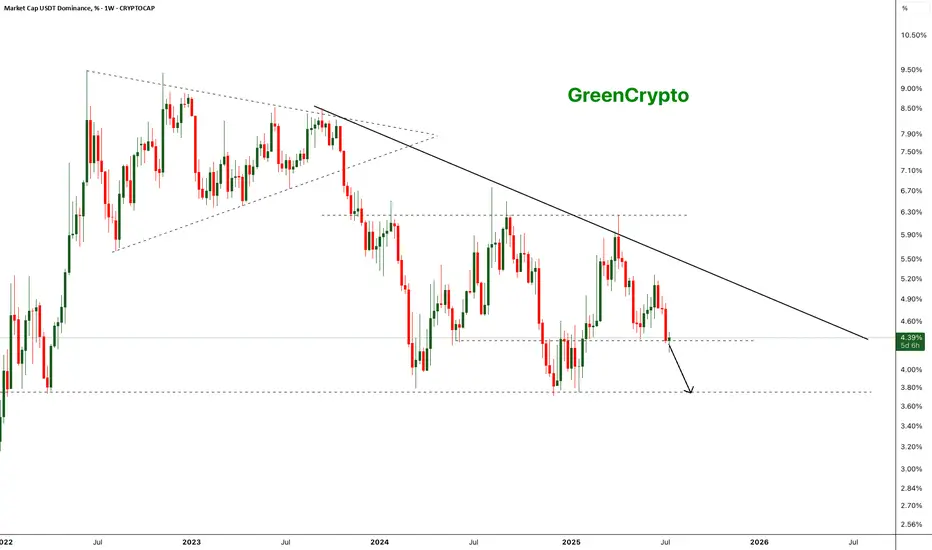
Bearish Breakdown in USDT Dominance - Altseason Loading?The chart shows a clear long-term descending trendline acting as resistance since mid-2023. After multiple failed attempts to break this trendline, USDT dominance has broken below a key horizontal support around ~4.35% on strong bearish momentum.
- Weekly close below the ~4.35% horizontal support.
Next key support zone: ~3.65–3.70% (marked by previous 2023 lows).
- Strong bearish engulfing candle confirming breakdown.
- Bearish continuation expected if dominance remains below 4.35%.
Further drop of the usdt dominance will start the altseason
Cheers
GreenCrypto
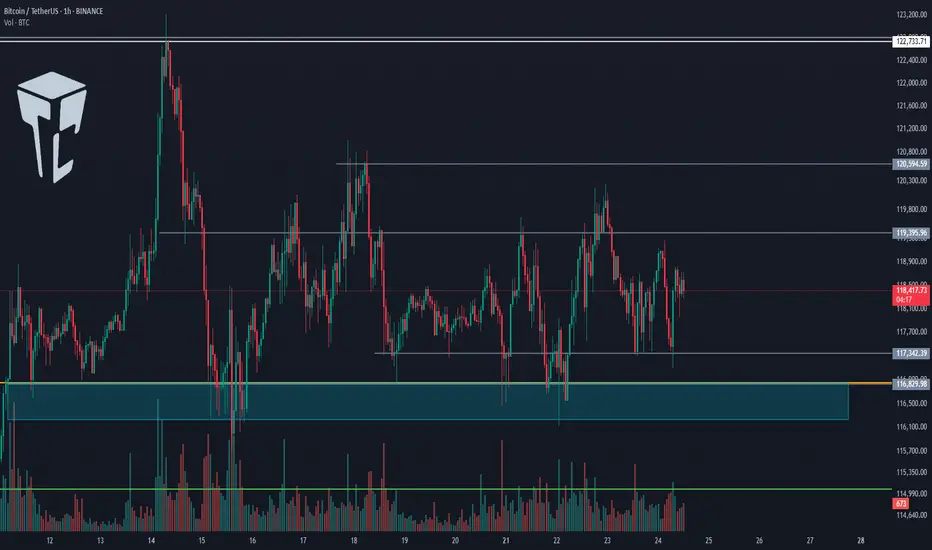
TradeCityPro | Bitcoin Daily Analysis #129👋 Welcome to TradeCity Pro!
Let’s take a look at the Bitcoin analysis and key crypto indices. As usual, in this analysis, I’ll review the futures triggers for the New York session.
⏳ 1-hour timeframe
Yesterday, Bitcoin faced a sharp drop after being rejected from the 122733 top and fell down to the 116829 level.
⚡️ Currently, the price has reached an important support area that I’ve marked for you, and at the same time, the RSI has entered the Oversold zone.
✅ Considering the main trend of the market is bullish, this RSI entry into Oversold could be a very good entry point for a long position, as it may indicate the end of the correction.
✨ If the price holds above the 116829 zone, we can enter a long position, and it’s worth opening a position at this level. Further entries can be taken with breakouts of 118494 and 122733.
👑 BTC.D Analysis
Let’s go to Bitcoin dominance. It has continued its downward movement and after breaking 64.44, it’s now moving down toward 64.18.
📊 If this level breaks, we’ll get confirmation of the continuation toward 63.96. In that case, long positions on altcoins would be very suitable.
📅 Total2 Analysis
Total2 is also undergoing a correction like Bitcoin and has settled below the 1.3 level.
⭐ If the correction continues, the next level to watch is 1.26. For long positions, you can enter after breakouts of 1.3 and 1.33.
📅 USDT.D Analysis
Now to Tether Dominance. After bouncing from the 4.22 bottom, it has returned to the box between 4.36 and 4.44.
🔑 If 4.36 breaks, the next bearish leg could start. On the other hand, if 4.44 breaks, we’ll get the first signal of a trend reversal.