Eyes on USDT.D — Potential Altcoin Rotation SetupUSDT Dominance Update (USDT.D)
USDT.D is currently sitting just above the key red zone (support).
This level has acted as an important pivot for the last few weeks.
If we see a breakdown below this zone, it could trigger a short-term rally in altcoins — as capital rotates out of stablecoins into risk assets.
However, if USDT.D holds and bounces from this level again, it may put short-term pressure on alts.
Key Level to Watch:
The red zone — a clean break below it could open the door for a fresh altcoin run.
For now, patience is key. Let the chart confirm.
Usdtdominance
USDT DOMINANCE Update (4H)In our latest analysis, we pointed out the bullish movement in Tether dominance and warned to be cautious | and eventually, that move played out.
The bullish movement in Tether dominance started from the point where we placed the green arrow on the chart. It appears to be an ABC pattern, and we are currently in wave C.
Now, after the drop, the price is approaching a support zone that could potentially push it back to higher levels, so we need to stay alert.
The bullish wave C could complete in one of the marked zones.
Let’s see what happens.
For risk management, please don't forget stop loss and capital management
When we reach the first target, save some profit and then change the stop to entry
Comment if you have any questions
Thank You
TradeCityPro | Bitcoin Daily Analysis #110👋 Welcome to TradeCity Pro!
Let’s dive into the Bitcoin analysis and major crypto indexes. In this review, as usual, I’ll cover the key futures triggers for the New York session.
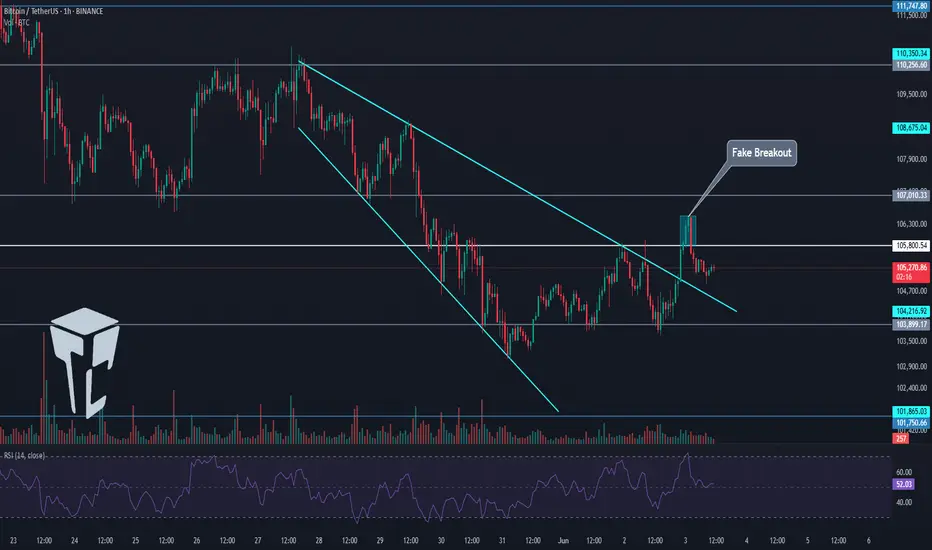
⏳ 1-Hour Timeframe
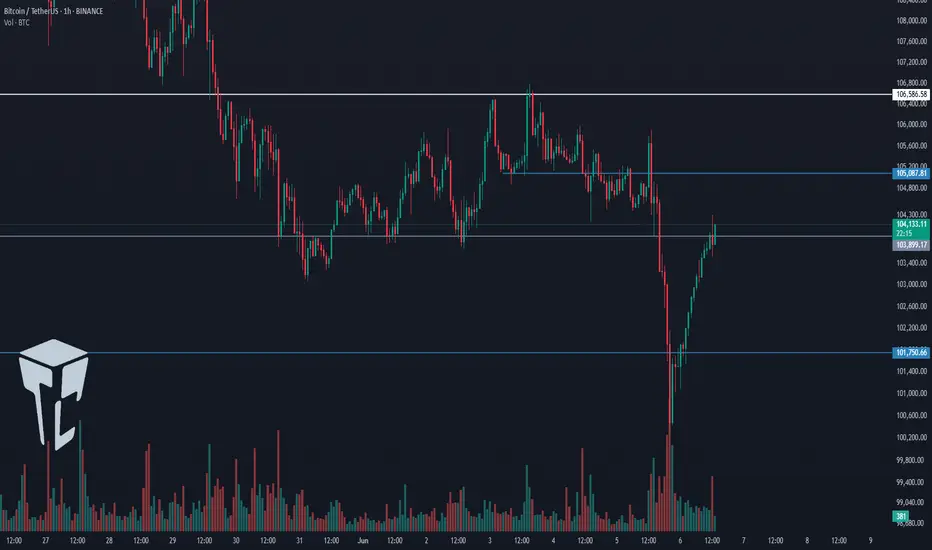
As you can see in the 1-hour timeframe, Bitcoin formed a higher low yesterday and has now reached the 105087 resistance. It seems likely that this level will be broken soon.
✨ Currently, a candle has closed above 105087, but price hasn’t yet confirmed a breakout, and the move hasn’t taken off.
📈 For a long position, we can enter once the price confirms a breakout above this level. If 105087 breaks, price could target 106586. The main long position will be opened upon breaking 106586.
🛒 Strong buying volume is a very good trigger for this setup. RSI entering the Overbought zone would also provide a powerful momentum confirmation, and price could rise accordingly.
💥 If the current upward move fails and price falls below the recent low, we can open a short position upon breaking 103899, targeting 101750.
⚡️ The 53.49 level on RSI is critical — its break would serve as a strong confirmation for the short position.
👑 BTC.D Analysis
Looking at Bitcoin Dominance, yesterday it once again moved toward 64.67, but failed to break it and is now heading downward after being rejected from that resistance.
🔑 The trigger for bullish continuation remains 64.67, while 64.49 serves as the trigger for a bearish move.
📅 Total2 Analysis
This index formed a higher low at 1.13 yesterday and is now testing the 1.15 resistance. If this level breaks, the price could head toward 1.17 and 1.18.
📊 A break above 1.15 would be a valid long trigger. However, if price is rejected and moves downward, breaking 1.13 could send it back toward 1.1.
📅 USDT.D Analysis
USDT Dominance closed below the 4.79 level yesterday and is now moving toward 4.70. If this continues, the crypto market could see bullish momentum.
🧩 However, if dominance moves back above 4.9, the next bullish leg in USDT.D could begin.
❌ Disclaimer ❌
Trading futures is highly risky and dangerous. If you're not an expert, these triggers may not be suitable for you. You should first learn risk and capital management. You can also use the educational content from this channel.
Finally, these triggers reflect my personal opinions on price action, and the market may move completely against this analysis. So, do your own research before opening any position.

USDT.D Breakout Fading — Relief Rally Ahead for Crypto?Yesterday’s spike in USDT.D during the volatility shook the market hard — but look closer 👀
This breakout above the range could be a seller’s trap. We saw a breakout attempt with strong wicks and rejection right after, hinting that buyers might regain control soon.
The false breakdown earlier and quick reclaim of the range further supports this bias.
If USDT.D starts falling again, it could fuel a recovery in risk assets (BTC + alts). For now — watching for confirmation, but cautioning against chasing fear here.
Stay sharp
TradeCityPro | Bitcoin Daily Analysis #109👋 Welcome to TradeCity Pro!
Let’s dive into the Bitcoin analysis and key crypto indicators. As usual, I’ll walk you through the futures triggers for the New York session.
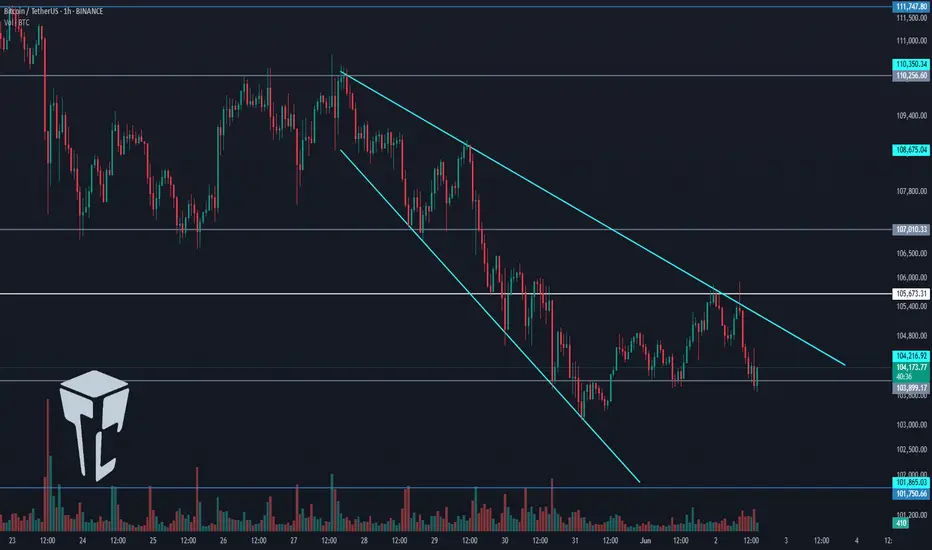
⏳ 1-Hour Timeframe
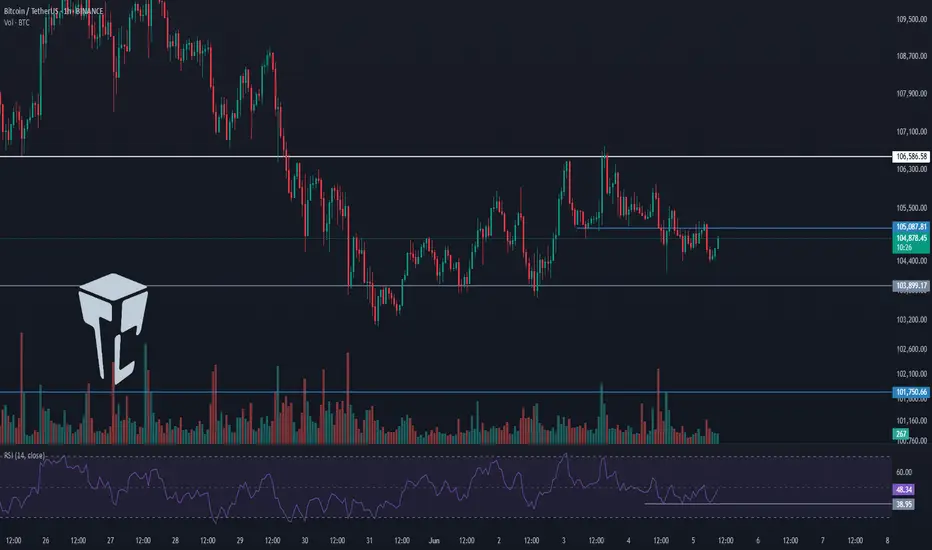
In the 1-hour chart, as you can see, yesterday Bitcoin activated the short trigger at 103899 and dropped below the 101750 level. This setup gave an opportunity to open a short position—hopefully you took advantage of it.
✨ After that bearish leg, the downtrend ended and the price began to rise again, now reaching back to the 103899 level.
🔍 If the price gets rejected once from 103899 and then forms a higher low compared to 101750, we can consider a long position on subsequent attempts—if 103899 breaks. If the price breaks this level sharply, the next long triggers will be 105087 and 106586.
📉 For today's short position, we can enter on a pullback to 103899. Personally, I’ll look for a bearish trigger in lower timeframes; if confirmed, I’ll open a short. The main bearish trigger remains the break of 101750.
📊 Currently, volume favors buyers, but we’ve seen divergence during this bullish leg, and volume increased on the last bearish move. So, I still see a higher probability of the market turning bearish rather than bullish.
👑 BTC.D Analysis
Looking at Bitcoin dominance, yesterday it made an upward move to 64.67 after breaking through 64.23. This 64.67 level is a strong resistance, and as shown, the dominance got rejected there.
💫 If this rejection is confirmed, there's a high chance of a retracement back to 64.23. In that case, if the market continues to drop, Bitcoin will likely be a better short than altcoins.
☘️ However, if 64.67 breaks, dominance could initiate another bullish wave.
📅 Total2 Analysis
As for Total2, after activating the 1.16 and 1.13 triggers, it dropped to the 1.1 zone and is now making a pullback to its previous support—similar to Bitcoin.
💥 For a long position, we’ll need a Dow Theory confirmation. For a short, we can wait for a pullback to 1.13 and look for a bearish confirmation to enter.
📅 USDT.D Analysis
Now onto Tether dominance: yesterday, after breaking 4.79, it moved up to 4.98. Following that, it reversed and is now back down to 4.79.
🔑 If 4.79 breaks, Tether dominance could drop further to 4.70 and 4.64. But if it holds and finds support there, another bullish leg may begin.
❌ Disclaimer ❌
Trading futures is highly risky and dangerous. If you're not an expert, these triggers may not be suitable for you. You should first learn risk and capital management. You can also use the educational content from this channel.
Finally, these triggers reflect my personal opinions on price action, and the market may move completely against this analysis. So, do your own research before opening any position.
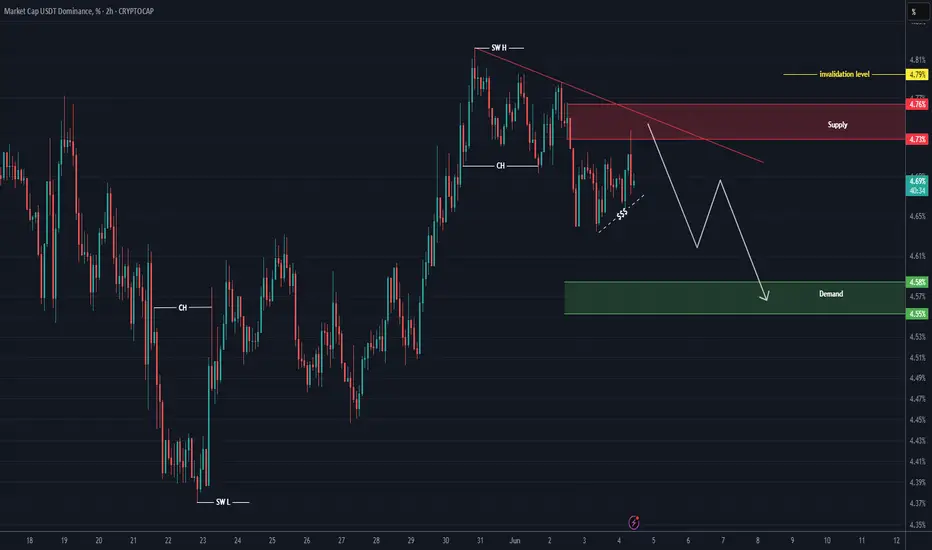
USDT Dominance Update (4H)First of all, as you know, the market has been going through complex corrections lately, and the scenarios are not very clear. So make sure to trade with proper risk management and a defined stop-loss.
It seems this index is preparing for a drop. It has tapped into the origin order block, and from here, it has the potential to move downward.
The good thing about this setup is that the invalidation level is close. If a 4-hour candle closes above this level, the analysis will be invalidated.
For risk management, please don't forget stop loss and capital management
Comment if you have any questions
Thank You
TradeCityPro | Bitcoin Daily Analysis #108👋 Welcome to TradeCity Pro!
Let’s dive into the analysis of Bitcoin and key crypto indices. As usual, in this analysis, I’ll review the futures session triggers for New York.
⏳ 1-Hour Timeframe
As you can see in the 1-hour timeframe, yesterday the 105087 trigger was activated, and now after a pullback to that level, the price is heading toward the 103899 support.
💥 If you entered a short position based on the 105087 trigger, you can hold it until 103899. If you haven’t opened a position yet, you can consider today’s triggers.
🔽 The first short trigger for today is the 103899 level. A break below this level can start a major bearish move. Personally, I’ll enter a short if this level breaks.
⚡️ Breaking below 38.95 on the RSI will give us a suitable momentum confirmation. If selling volume increases, the probability of a bearish move will rise.
📈 For long positions, our first trigger is the same 105087 level. If a higher low is formed compared to 103899 and this level breaks, it will provide a good long opportunity.
💫 The main long trigger is 106586. If this level is broken, the uptrend can resume and price could move toward higher resistance levels.
👑 BTC.D Analysis
Looking at Bitcoin Dominance, a range box has formed between 63.93 and 64.23.
✨ A break above 64.23 confirms bullish continuation, while a break below 63.93 confirms a bearish trend in dominance.
📅 Total2 Analysis
Moving to Total2, yesterday it closed below 1.17, and now after a pullback, it's heading toward 1.16.
✅ If 1.16 breaks, a short position can be opened. If the downward move turns out to be fake, a break above 1.18 gives us a long trigger.
📅 USDT.D Analysis
Looking at Tether Dominance, yesterday it confirmed above 4.70 and is now moving toward 4.79. A break of 4.79 could signal a continuation of the upward move.
📊 If it closes back below 4.70, the price could move toward 4.64. A break below 4.64 would signal a bearish trend in USDT dominance.
❌ Disclaimer ❌
Trading futures is highly risky and dangerous. If you're not an expert, these triggers may not be suitable for you. You should first learn risk and capital management. You can also use the educational content from this channel.
Finally, these triggers reflect my personal opinions on price action, and the market may move completely against this analysis. So, do your own research before opening any position.
TradeCityPro | Bitcoin Daily Analysis #107👋 Welcome to TradeCity Pro!
Let’s dive into Bitcoin and key crypto indices. As usual, in this analysis I’ll walk you through the triggers for the New York futures session.
⏳ 1-Hour Timeframe
As you can see in the 1-hour timeframe, yesterday the price made another upward move and formed its resistance at the 106586 level and a bottom at 105087.
📈 For a long position, considering the uptrend in higher timeframes such as the daily and weekly, we can enter upon a breakout of 106586. A bounce of the RSI from the 50 level can act as a good confirmation for the position.
📊 Buying volume is currently increasing, but the price is still sitting on the support bottom and hasn’t moved upward yet. If this volume inflow continues, a breakout of 106586 would be a strong confirmation for a long position.
🔽 For a short position, the first trigger is the breakdown of the 105087 bottom. If this level is broken, we can enter a short. The main short trigger is at 103899.
💥 Conditions are currently favorable for a short position, and the current candle has strong bearish momentum. So, if 105087 breaks, a short position would be appropriate.
👑 BTC.D Analysis
Let’s look at Bitcoin Dominance. After a pullback to the 64.23 level, the next bearish leg continued to 63.93. If 63.93 breaks, the downtrend is likely to continue and the price could fall to 63.50.
✅ If 63.93 holds, dominance may start moving back up toward 64.67.
📅 Total2 Analysis
Now let’s check out Total2. This index is still below the 1.18 level, and breaking this level would confirm a bullish move.
✨ A new bottom has also formed at 1.17. If this level breaks, we can look for a short position.
📅 USDT.D Analysis
Now to Tether Dominance. This index has formed a box between 4.64 and 4.70.
🔔 A breakout above 4.70 could initiate a bullish move in dominance, while a breakdown below 4.64 could trigger a bearish move.
❌ Disclaimer ❌
Trading futures is highly risky and dangerous. If you're not an expert, these triggers may not be suitable for you. You should first learn risk and capital management. You can also use the educational content from this channel.
Finally, these triggers reflect my personal opinions on price action, and the market may move completely against this analysis. So, do your own research before opening any position.
TradeCityPro | Bitcoin Daily Analysis #106👋 Welcome to TradeCity Pro!
Let’s dive into Bitcoin and the key crypto indices. As usual, I’ll be reviewing the futures triggers for the New York session.
⏳ 1-Hour Timeframe
On the 1-hour chart, the 105800 trigger was activated yesterday and Bitcoin’s trendline was broken. However, the price failed to hold above 105800 and quickly fell back below, making it a fake breakout.
⚡️ For now, I’m keeping the 105800 level as the long trigger to observe how the price reacts. We need to wait for a clear reaction to this zone to better refine the trendline. On the next test, if it breaks successfully, we can enter a long position.
🔍 If a higher low forms above 103899 and the RSI finds support above 50, the likelihood of breaking the 105800 resistance increases, potentially leading to a stronger upward move.
✨ On the short side, since the 105800 breakout failed, bearish momentum could increase. A breakdown below 103899 would trigger a short position with a target at 10750.
If you’ve already opened a short position before this trigger, be aware that it's a risky trade and shouldn’t be relied on as a long-term position.
👑 BTC.D Analysis
The downtrend in Bitcoin dominance has continued following the breakdown of 64.29, and now it has also broken below 64.15, heading toward 63.87.
⭐ For now, BTC dominance is temporarily bearish. If the market corrects, Bitcoin might fall harder, but if the market recovers, altcoins could perform better — unless BTC dominance reverses trend.
📅 Total2 Analysis
Yesterday, the long trigger at 1.16 was activated, and now the index has reached 1.18. Thanks to falling Bitcoin dominance, altcoins have outperformed Bitcoin.
✔️ If 1.18 breaks, the uptrend could continue. Key levels to watch next are 1.21 and 1.24.
📅 USDT.D Analysis
This index formed a lower high below 4.79 yesterday and is now retesting 4.70 after breaking below it.
🎲 If this pullback gets rejected, it confirms weakness in USDT dominance — which supports long positions on altcoins. However, if USDT.D climbs back above 4.70 and it turns into a fake breakdown, there’s a strong chance it could revisit 4.79 or even break that resistance.
❌ Disclaimer ❌
Trading futures is highly risky and dangerous. If you're not an expert, these triggers may not be suitable for you. You should first learn risk and capital management. You can also use the educational content from this channel.
Finally, these triggers reflect my personal opinions on price action, and the market may move completely against this analysis. So, do your own research before opening any position.
TradeCityPro | Bitcoin Daily Analysis #105👋 Welcome to TradeCity Pro!
Let’s dive into Bitcoin and key crypto indices. As usual, in this analysis, I’ll walk you through the triggers for the New York futures session.
⏳ 1-Hour Timeframe
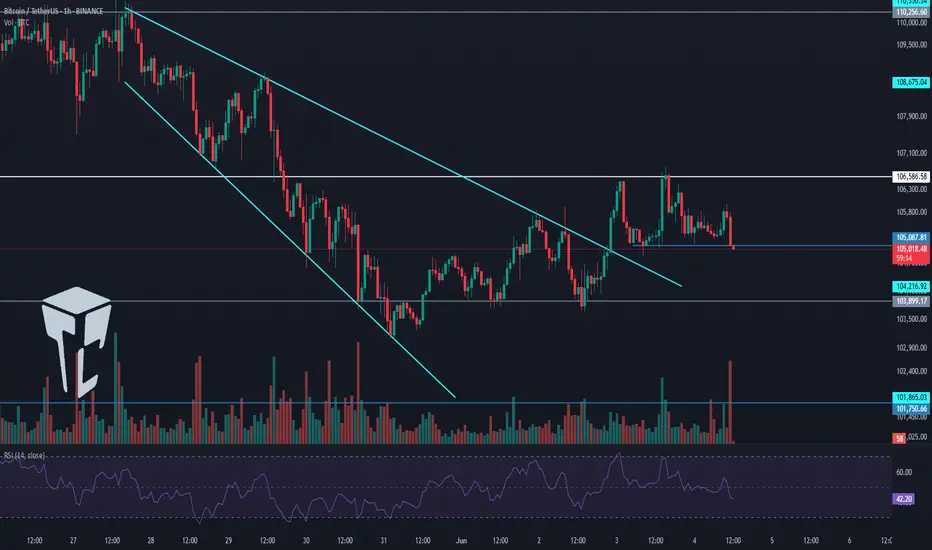
On the 1-hour chart, as you can see, Bitcoin’s correction phase began after the breakdown of the 107010 level. Currently, after pulling back to the 105673 area, it seems ready to begin its next corrective leg.
✔️ One of the reasons Bitcoin has moved downward over the past few days is the escalation of war between Ukraine and Russia. As the conflict intensified, risk assets like Bitcoin dropped while safe-haven assets like gold surged.
🔍 Currently, price action is forming an expanding triangle and is trending downward. It was recently rejected from the triangle’s top and is now sitting on a key support at 103899.
💥 If 103899 breaks, a short position targeting 101750 could be triggered. Selling volume has increased significantly, confirming bearish momentum, so opening a short upon a break of 103899 appears logical. However, keep in mind that the primary market trend remains bullish, and there is a high probability that any short may hit stop-loss.
📈 For a long position, the first trigger would be a breakout above the triangle. In this case, breaking 105673 could justify entry. Key overhead resistances are located at 107010 and 110256.
👑 BTC.D Analysis
Looking at Bitcoin dominance, the metric continued its upward move to reach 64.67 and has since been rejected from that level.
⚡️ If the bullish move continues, the breakout above 64.67 would act as a bullish trigger. On the other hand, a breakdown below 64.29 would confirm a bearish shift.
📅 Total2 Analysis
Total2 is currently ranging between 1.13 and 1.16. A breakout from either side could serve as a trigger for a directional position.
📊 If 1.13 breaks, a short position could be considered. Conversely, breaking above 1.16 would signal a potential long.
📅 USDT.D Analysis
After breaking above 4.70, USDT dominance has been ranging between 4.70 and 4.79. It’s now heading back toward the 4.79 resistance.
🧩 If 4.79 is broken, the next bullish leg in dominance may begin. A drop back below 4.70 would bring the dominance back into its previous range and could lead to further downside toward 4.49.
❌ Disclaimer ❌
Trading futures is highly risky and dangerous. If you're not an expert, these triggers may not be suitable for you. You should first learn risk and capital management. You can also use the educational content from this channel.
Finally, these triggers reflect my personal opinions on price action, and the market may move completely against this analysis. So, do your own research before opening any position.
Correlation between USDT.D and BTC.D
Hello, traders.
If you "Follow", you can always get new information quickly.
Have a nice day today.
-------------------------------------
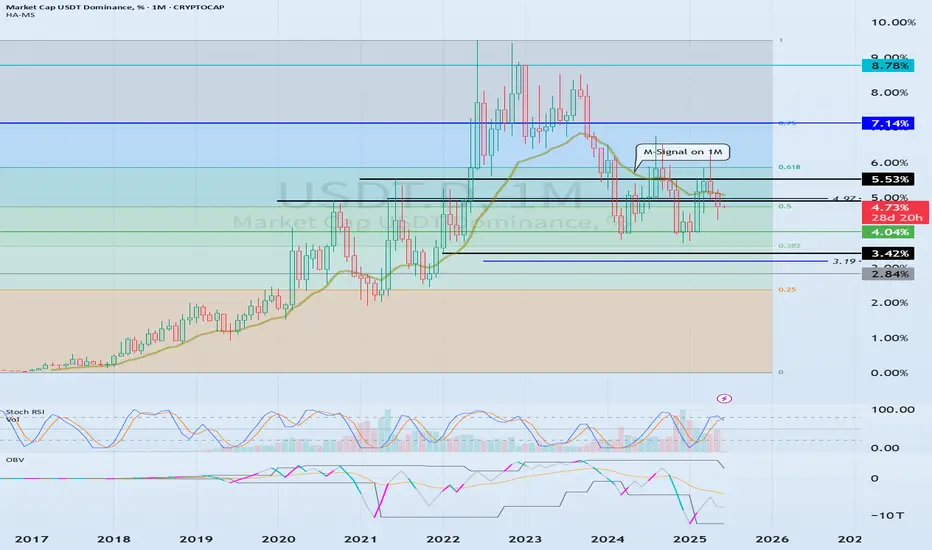
(USDT.D 1M chart)
If USDT dominance is maintained below 4.97 or continues to decline, the coin market is likely to be on the rise.
The maximum decline is expected to be around 2.84-3.42.
-
(BTC.D 1M chart)
However, in order for the altcoin bull market to begin, BTC dominance is expected to fall below 55.01 and remain there or show a downward trend.
Therefore, we need to see if it falls below the 55.01-62.47 range.
The maximum rise range is expected to be around 73.63-77.07.
-
In summary of the above, since funds are currently concentrated in BTC, it is likely that BTC will show an upward trend, and altcoins are likely to show a sideways or downward trend as they fail to follow the rise of BTC.
The major bear market in the coin market is expected to begin in 2026.
For the basis, please refer to the explanation of the big picture below.
-
Thank you for reading to the end.
I hope you have a successful transaction.
--------------------------------------------------
- This is an explanation of the big picture.
(3-year bull market, 1-year bear market pattern)
I will explain more details when the bear market starts.
------------------------------------------------------
USDT Dominance $USDT.D – Channel Breakout in Action!!USDT.D has officially broken out of the descending channel, indicating a potential shift in momentum.
Key Points:
- LTF bullish divergence supported the recent push.
- Price is now testing the breakout level with potential to move higher.
- Next key resistance levels are marked at 4.85%, 5.23%
Both levels align with Fibonacci retracement zones, adding to their importance.
If this move sustains, we might see temporary pressure on alts due to increased USDT strength.
However, if price fails to hold above the channel and confirms a deviation, alts may resume dominance.
Weekly close remains key — it will either validate this breakout or trap the breakout traders.

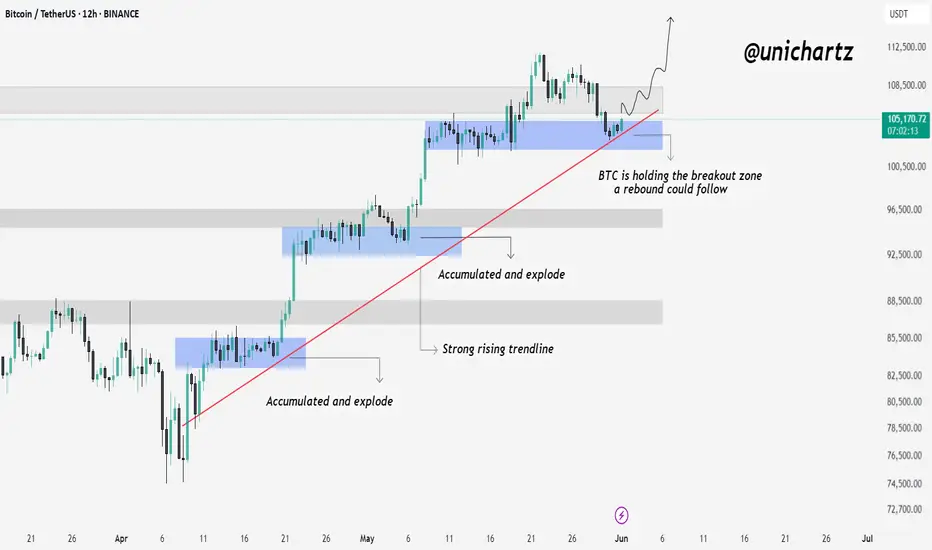
Bitcoin Retests Breakout Zone – Will It Bounce Again?Hello traders, here is the Quick CRYPTOCAP:BTC update
Bitcoin is currently holding right at the previous breakout zone, which also aligns with the rising trendline and previous accumulation area.
This zone has acted as a strong launchpad in the past — where BTC accumulated and exploded higher. If buyers defend this level again, we could see another rebound play out from here.
As long as BTC holds this structure, the bullish trend remains intact.
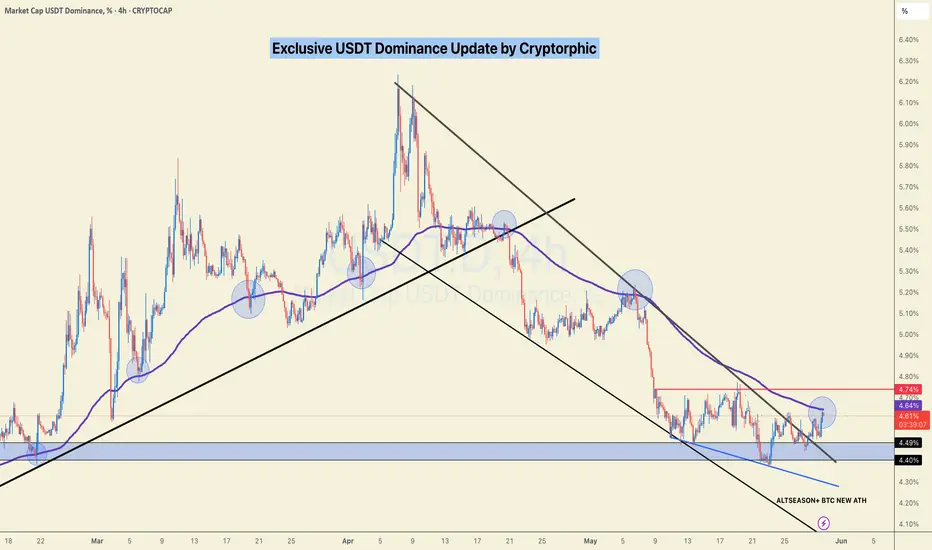
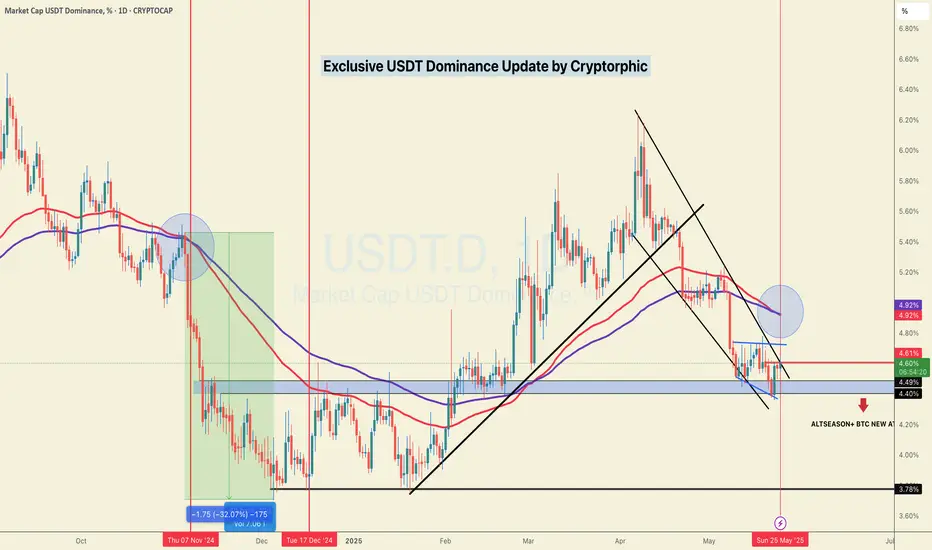
Important Update on USDT Dominance!This might get a little tricky, guys!
On the weekly timeframe, USDT.D has broken below the 100 MA. The last time this happened, it dropped by 33%, which was enough to trigger a solid rally in BTC and the broader market.
Currently, we may see dominance attempt to retest the 100 MA, which is now acting as resistance after the breakdown. This slight rebound could bring some correction to the market — so brace yourselves and stay cautious. ⚠️
In the long run, BTC still looks strong and is likely to go parabolic. Remember, consolidation is a natural part of the market cycle — and if you know how to navigate it, you’ll be just fine. 💪
Regards,
Dexter

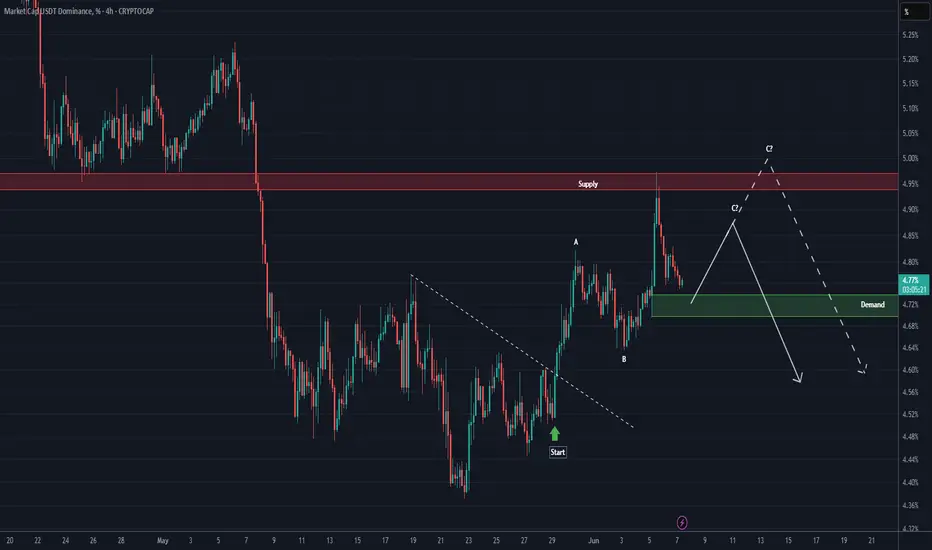
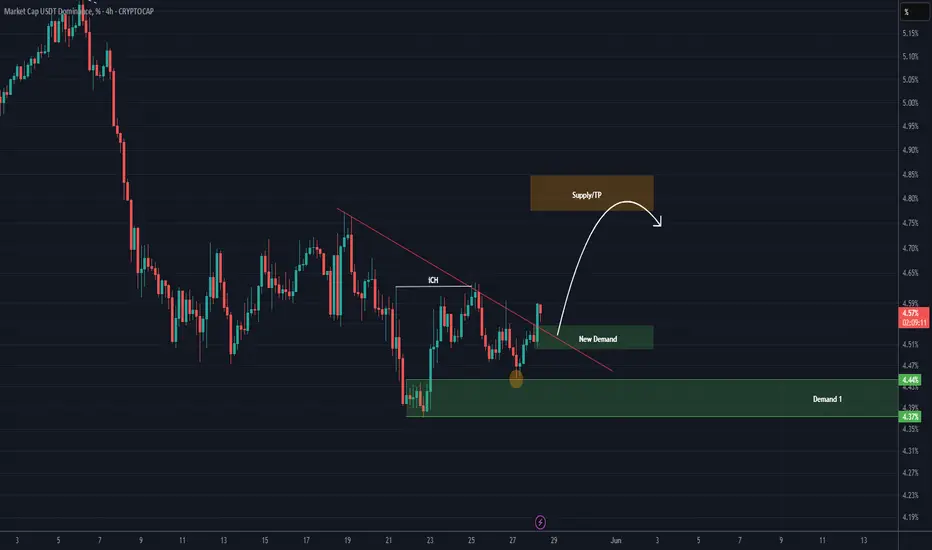
USDT DOMINANCE NEW UPDATE (4H)This analysis is an update of the analysis you see in the "Related publications" section
In the previous analysis, we mentioned that the price bounced upward from either Demand 1 or Demand 2.
Considering that the trigger line was broken with a valid candle, it seems the orders in Demand 1 were sufficient to push the price upward.
As long as the new demand zone holds, we expect the price to move toward the orange box.
The orange box appears to be a strong resistance zone, and we will definitely see a reaction there.
Let’s wait and see what happens.
For risk management, please don't forget stop loss and capital management
Comment if you have any questions
Thank You
USDT dominance chart!The chart shows USDT.D (Tether dominance) moving within a descending channel.
Currently, USDT.D is testing the upper resistance of the channel, around 4.65%.
If the dominance gets rejected at this level, the next potential target is the lower channel support around 3.9-4.0%.
This could indicate a risk-off environment where traders move capital from stablecoins (USDT) to more volatile assets like Bitcoin or altcoins.
The 50 and 200 moving averages provide dynamic resistance levels that support this potential downside move.
Thanks for your support!
DYOR. NFA

#MARKET DUMPED! What's Next?Honestly, I didn’t expect this move to play out the way it did.
I’ve been warning about a potential breakout on the lower timeframes, and in hindsight, the signs were all there, but I still missed it. It happens, even to the best of us.
Took a few hits with stop-losses today. But no complaints, it’s a small dent compared to what we’ve gained over the past few weeks.
Now, shifting focus. I’m watching this chart closely — this is the 130 EMA on the 4H, which has historically done a great job identifying short-term rejections and bounces. It’s already plotted, and I’ll continue tracking it.
If we break above this level, there’s a strong chance
CRYPTOCAP:BTC can revisit the 98k zone. Until then, stay cautious and avoid High leverage.
Holding LSE:TAO $EIGEN and a few more.
No need to force trades, let the setup come to you.
One more thing, I am still not Bearish, it's a shakeout right before the real move! So be alert when opportunities come to you.
I was planning to take a break today, but not like this tbh.
Stay tuned
We adapt and move forward. Always!
Cheers
Do show your support and hit that like button.
Thank you
#PEACE
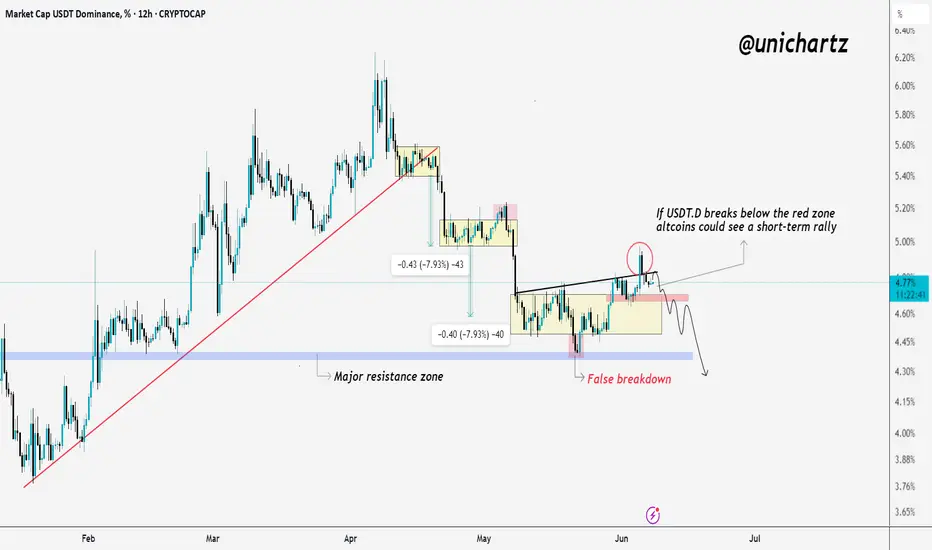
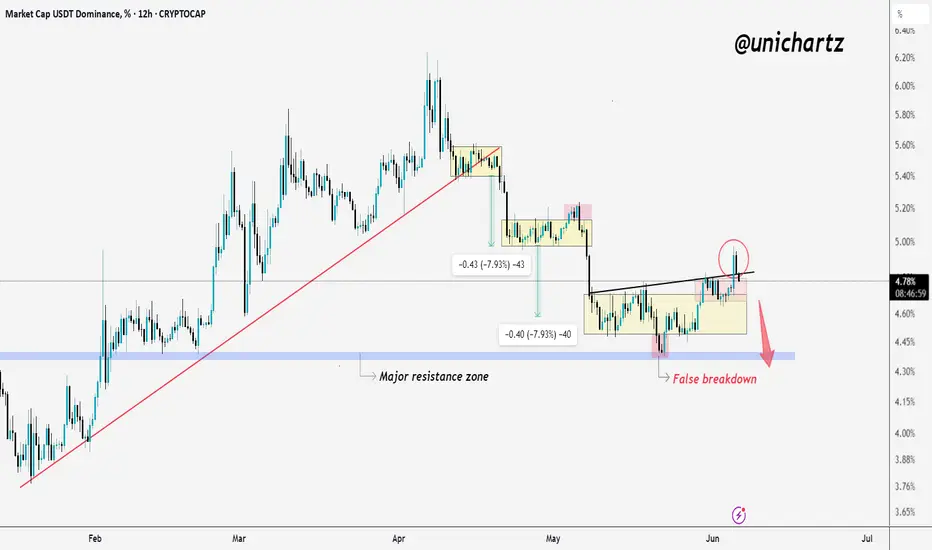
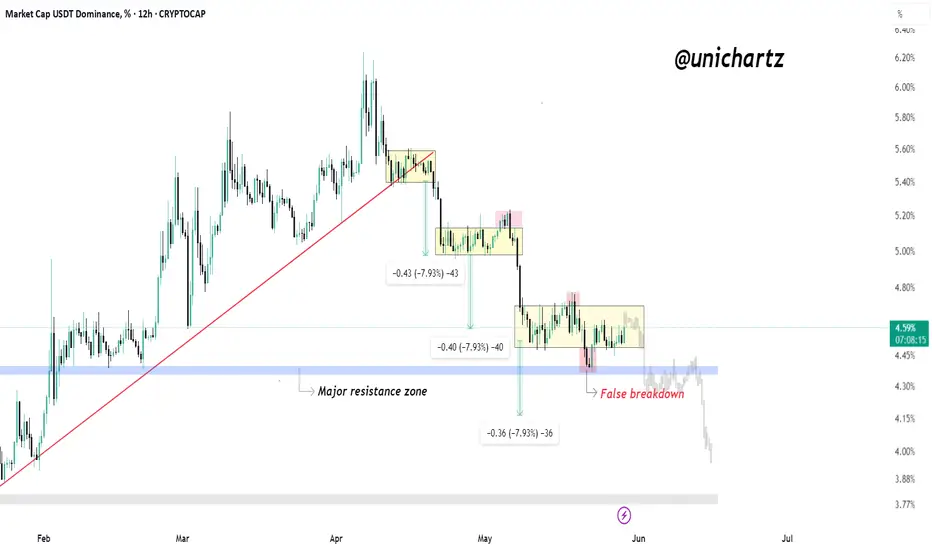
USDT.D Bounce Back After Fakeout – What It Means for Alts?USDT Dominance – 12H Chart Analysis
After a clean downtrend and multiple breakdowns, USDT.D recently attempted to break below a major support zone — but it turned out to be a false breakdown.
This move likely trapped altcoin buyers, who expected USDT.D to keep falling (which usually signals strength in altcoins). Instead, dominance quickly bounced back, showing money flowing back into stablecoins.
If USDT.D continues to rise from here, we could see pressure on altcoins in the short term.
Watch this level closely — the next move will be critical.
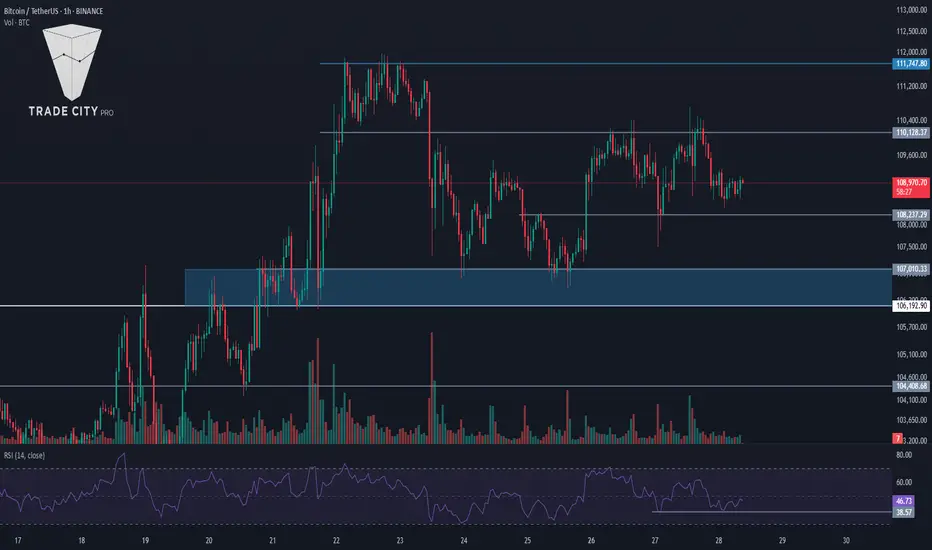
TradeCityPro | Bitcoin Daily Analysis #104👋 Welcome to TradeCity Pro!
Let’s dive into Bitcoin and key crypto indices. As usual, in this analysis I’ll walk you through the triggers for the New York futures session.
⏳ 1-Hour Timeframe
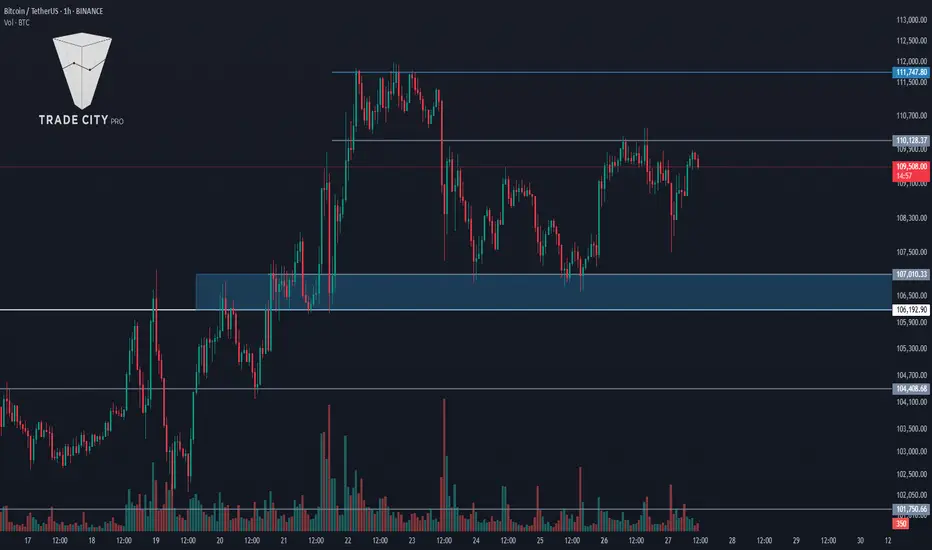
On the 1-hour chart, as you can see, Bitcoin was once again rejected from the 110128 level yesterday and is now hovering near 108237.
✔️ At the moment, price hasn’t yet touched the 108237 support. If it manages to stay above this level without breaking below, the chances of retesting 110128—and even breaking above it—increase.
🔍 If 108237 is broken, a short position could be considered. However, keep in mind that this setup goes against the current uptrend. As mentioned in previous analyses, the 106192–107010 range is a major support zone, and as long as price remains above it, the trend remains bullish.
📉 The main short trigger would be a break below this key support. If that occurs, it could introduce strong bearish momentum. An RSI break below 38.57 would serve as a momentum confirmation.
✨ During this pullback from 110128, market volume has been decreasing, which indicates the strength of the ongoing uptrend.
💥 If 110128 is broken, and considering the strong trend, a long position could be initiated. An RSI break above 50 would provide additional confirmation. The primary long trigger remains a break above 111747.
👑 BTC.D Analysis
Bitcoin Dominance continued to fall yesterday, reaching as low as 63.87. It has shown a slight bounce from that level and is currently in a mild upward correction.
⭐ If a lower high forms below 64.18, the chances of breaking below 63.87 increase. However, if the correction goes beyond 64.18, the probability of resuming the uptrend will grow.
📅 Total2 Analysis
Yesterday, Total2 was rejected from 1.24 and corrected down to 1.21. If price bounces from here and heads back toward 1.24, the chances of breaking that resistance will rise.
📊 If 1.21 fails to hold, a deeper correction toward 1.18 could follow.
📅 USDT.D Analysis
USDT Dominance is forming a lower high compared to 4.56. If this plays out and 4.49 is broken, it would confirm a bearish move.
⚡️ On the other hand, if 4.56 is broken to the upside, the move could extend toward 4.62.
❌ Disclaimer ❌
Trading futures is highly risky and dangerous. If you're not an expert, these triggers may not be suitable for you. You should first learn risk and capital management. You can also use the educational content from this channel.
Finally, these triggers reflect my personal opinions on price action, and the market may move completely against this analysis. So, do your own research before opening any position.
TradeCityPro | Bitcoin Daily Analysis #103👋 Welcome to TradeCity Pro!
Let’s dive into Bitcoin and key crypto indices. As usual, in this analysis I’ll walk you through the triggers for the New York futures session.
⏳ 1-Hour Timeframe
As you can see on the 1-hour chart, Bitcoin was rejected from the 110128 resistance yesterday and began a pullback, but it didn't reach the support at 107010 — instead, it formed a higher low and is now moving back toward 110128.
📊 Buy volume during this bullish leg has been relatively low, which isn’t ideal for a strong uptrend and indicates potential weakness.
📈 If the 110128 resistance breaks, a long position can be considered. However, if you take this trade, I suggest not setting your target at 111747 — instead, aim for higher targets and hold the position longer.
💥 The main long trigger remains at 111747. So if you missed or don’t want to trade the 110128 breakout, you can wait for this higher confirmation.
🔽 As for short setups, just like yesterday, it's still better to wait for a trend reversal. As long as the price remains above the support zone, the uptrend remains intact.
👑 BTC.D Analysis
Bitcoin Dominance broke above 64.32 yesterday but failed to hold and fell back below it, also breaking the 64.18 support. It’s now moving toward 63.97.
⭐ Currently, there is strong bearish momentum in BTC.D, and if 63.97 is broken, this downward move is likely to continue.
📅 Total2 Analysis
Total2 printed a higher low above 1.18 and has now broken above the 1.22 resistance.
✨ If it can hold above this level, we could see an upward move toward 1.26. For bearish confirmation and short positions, a break below 1.18 would be the key trigger.
📅 USDT.D Analysis
USDT Dominance printed a lower high compared to 4.62 and is now sitting on support at 4.49. A break below this level could push the dominance down to 4.38.
🎲 To confirm a bullish reversal in USDT.D, we would need to see a break above 4.62.
❌ Disclaimer ❌
Trading futures is highly risky and dangerous. If you're not an expert, these triggers may not be suitable for you. You should first learn risk and capital management. You can also use the educational content from this channel.
Finally, these triggers reflect my personal opinions on price action, and the market may move completely against this analysis. So, do your own research before opening any position.
$USDT: A Critical Close Is Approaching. BULL TRAP or ALTSEASON?This one’s more important than most people realise.
Alts will either explode from here, or this recent ATH turns out to be a bull trap, the last rally we've been waiting for may take a little more likely.
I personally think this is an unlikely scenario but if you really intend to make big bucks in this market, you gotta be ready for every outcome.
No bs. No noise. Just the facts.
I'll recommend that you bookmark this post to stay updated.
Do hit the like button if you like this post.
Thank you
Stay safe folks
#PEACE
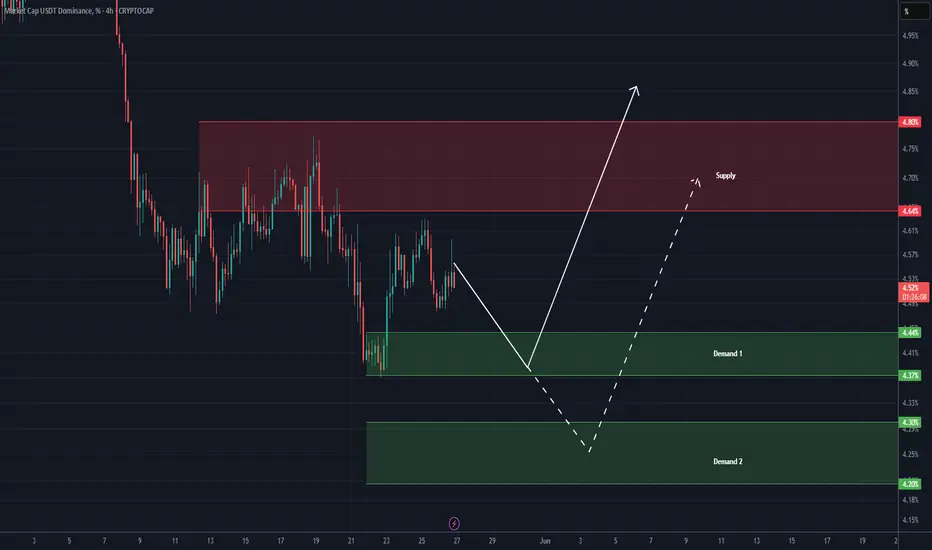
USDT DOMINANCE Update (4H) First of all you should know that "USDT Dominance" is always moving inverse of BTCUSDT .
This index is ready to retrace and bounce upward from either Demand 1 or Demand 2. Be cautious with this index and monitor it closely.
If the price gets rejected toward Demand 2, altcoins may experience some growth before undergoing another correction.
Let’s wait and see what happens.
For risk management, please don't forget stop loss and capital management
Comment if you have any questions
Thank You
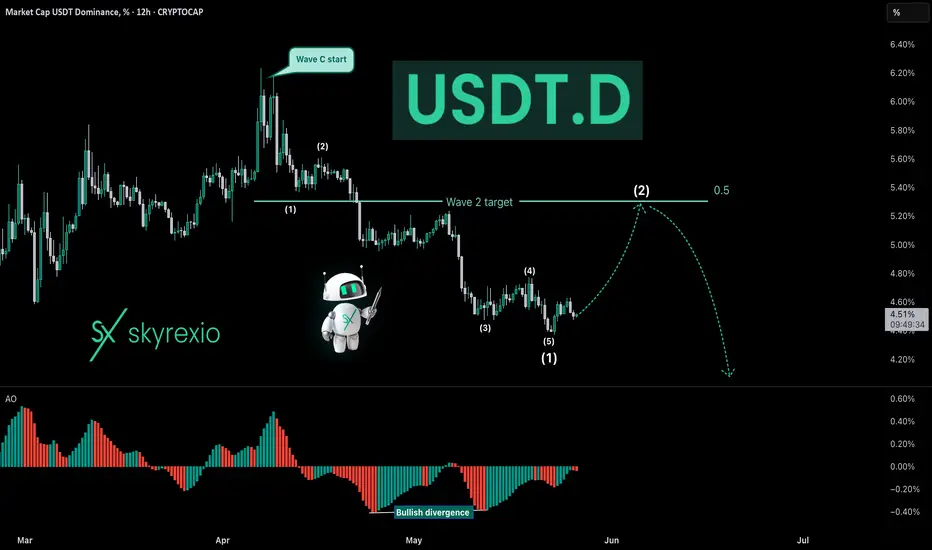
USDT Dominance Tells Us That Shakeout AheadHello, Skyrexians!
Despite most of traders now already do not believe in correction for Bitcoin, CRYPTOCAP:USDT.D is showing the potential warning sign. For sure my global forecast for this chart that Tether dominance will go below 2% is still actual. You can find it here . By the way it's playing out great. But in the short term shakeout is likely.
12 hours time frame Awesome Oscillator shows that wave 1 of global C has been finished. Now it's time for reactive wave 2. The most likely target is 5.3% at 0.5 Fibonacci. Only from there I expect crypto bull run continuation (for BTC) and start (for altcoins).
Best regards,
Ivan Skyrexio
___________________________________________________________
Please, boost this article and subscribe our page if you like analysis!