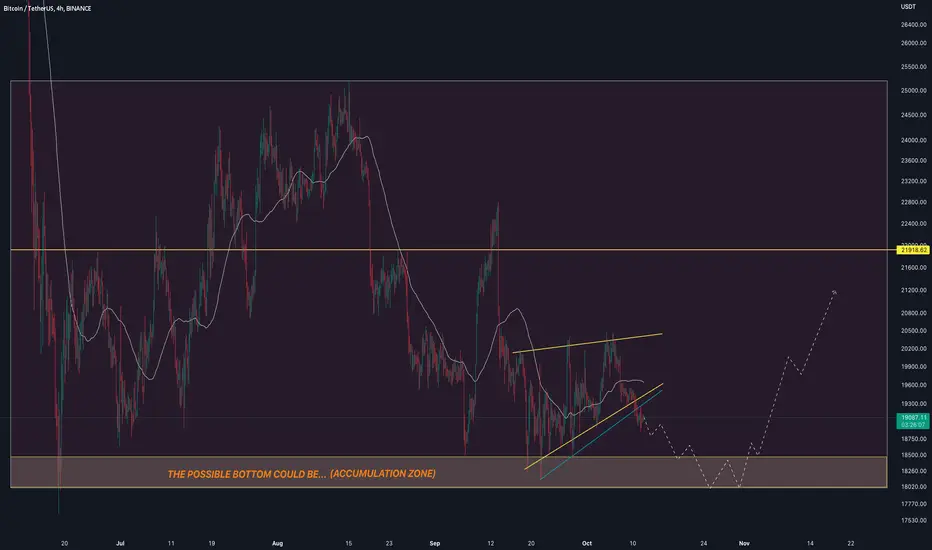
#BTC DAILY UPDATE !!As BTC broke below the rising wedge pattern and is currently it's moving downside towards its possible bottom of $18k which is almost 6% low from the current level.
There is a high chance that BTC can move down towards 18k which is not should be the reason for panic, if you are here for the long term then you will understand this, 18k level will be the better accumulation zone for the upcoming months.
Let’s see how it goes in the upcoming days, candle close below the lower support zone will be an invalidation of this chart analysis.
So, do your own research before any trade and hit the like button if you find this analysis helpful.
This is not financial advice.
Thank you.
Usdtdominance
#USDT DOMINANCE is trading inside this channel!!Hi guys, This is CryptoMojo, One of the most active trading view authors and fastest-growing communities.
Consider following me for the latest updates and Long /Short calls on almost every exchange.
I post short mid and long-term trade setups too.
Let’s get to the chart!
I have tried my best to bring the best possible outcome to this chart, Do not consider financial advice.
USDT DOMINANCE UPDATE
USDT DOMINANCE is at perfect resistance as you can see. The USDT.D will drop down and we can see the opposite reaction on BTC and other altcoins. In case it breaks the upper resistance then the chart will be invalid.
This chart is likely to help you make better trade decisions if it does consider upvoting it.
I would also love to know your charts and views in the comment section.
Thank you
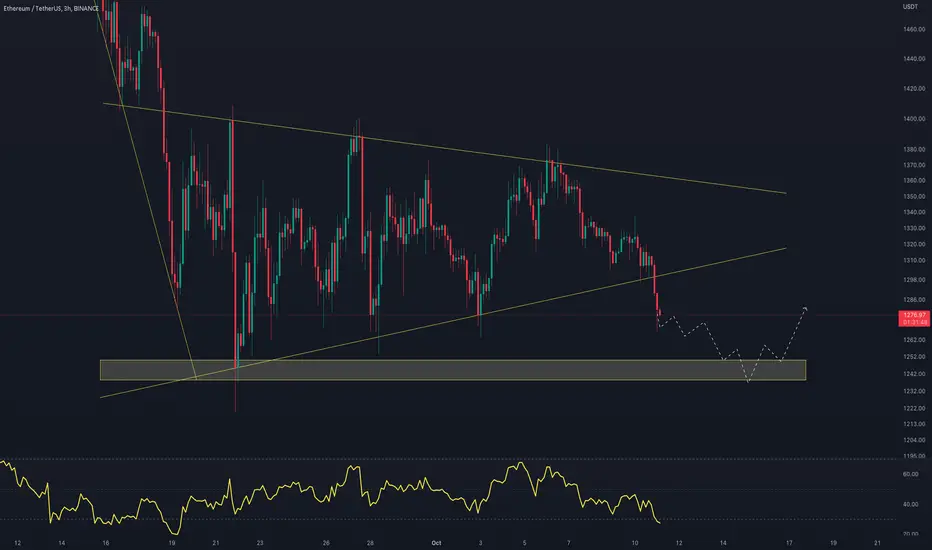
#ETHUSDT 3HR UPDATE !!Hello, traders welcome you all to another chart update on ETH/USDT
If you are reading my update for the first time hit the like button and comment in the comment section if you find this analysis helpful.
As ETH was trading inside the bearish pennant for a while, it broke below and currently moving downside.
According to the current scenario, it has a support zone at the $1250 level which it needs to hold to regain above again.
The candle closes below the lower support zone will invalidate this chart analysis.
This is not financial advice. This is for education purposes only. I am not responsible for the profits or losses you generate from your investments.
Do your research before making any trades.
Thank you.
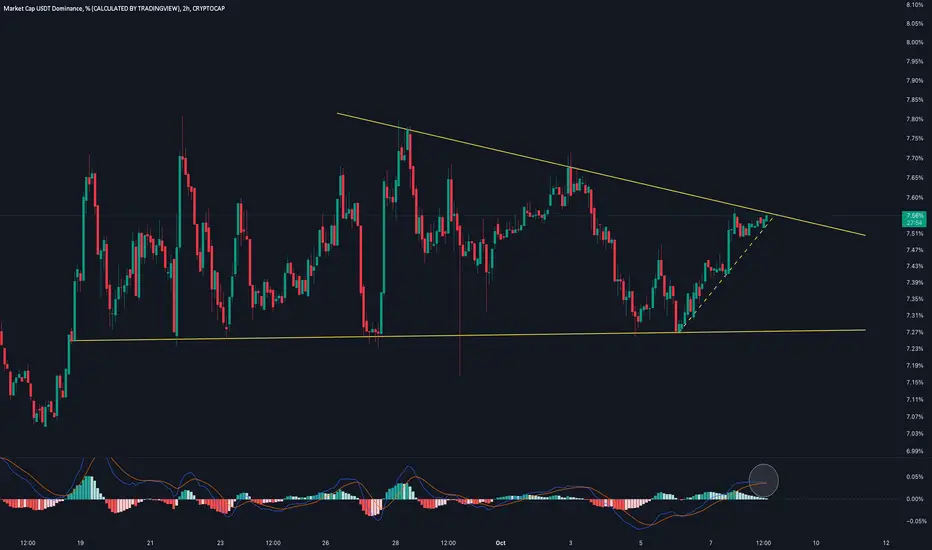
USDT.D AT LOCAL RESISTANCEHello, traders welcome you all to another chart update on USDT DOMINANCE.
If you are reading my update for the first time hit the like button follow and comments in the comment section if you find this analysis helpful.
As we saw how dominance bounced from the lower trend support at 7.27% and rallied almost 5%.
In the current frame, usdt dominance is facing a resistance trend line which could be the rejection point, for now, a break above will lead it to rally toward the 7.80% level.
MACD printing a bearish crossover which could be the signal of some drop.
Let’s see how this chart pays out in the upcoming hours.
This is not financial advice. This is for education purposes only. I am not responsible for the profits or losses you generate from your investments.
Do your research before making any trades.
Thank you.
USDT.DUSDT.D I share this chart a few months ago I told to people the bear market is coming very soon, and now after 2 months we can see the bear market, For now, I'm more bearish on BTC/USDT in the big picture lets see what happen.
#USDT DONINANCE is at resistance!!Hi guys, This is CryptoMojo, One of the most active trading view authors and fastest-growing communities.
Consider following me for the latest updates and Long /Short calls on almost every exchange.
I post short mid and long-term trade setups too.
Let’s get to the chart!
I have tried my best to bring the best possible outcome to this chart, Do not consider financial advice.
USDT DOMINANCE UPDATE
USDT DOMINANCE is at perfect resistance as you can see. The USDT.D will drop down and we can see the opposite reaction on BTC and other altcoins. In case it breaks the upper resistance then the chart will be invalid.
This chart is likely to help you make better trade decisions if it does consider upvoting it.
I would also love to know your charts and views in the comment section.
Thank you
Quick Update Long RVNUSDT FutureLong RVNUSDT Future
1hr Chart Showing Bullish
Entry- 0.03553
Target - 0.03704
Sl - 0.03516
I hope friends you understand my analysis.
Me & my Team trying to best analysis for you Friends.
~~Please Support Friends~~
(Not Financial Advice)
~~Best Of Luck~~
!! Thank You My Team !!

#BTC AT SUPPORT LEVEL.Hello, traders welcome you all to this BTC quick chart update.
If you find my updates helpful and productive, hit the like button follow and comment your view in the comment section, this motivates me to bring this kind of update regularly.
Let’s look into the chart,
According to my last higher time frame update BTC is still trading in a support zone, here at the lower time frame BTC is trading on a lower trend line support of the ascending triangle pattern.
If BTC holds this level and is able to gain above then we can see a good green rally from the current level.
This is not financial advice. This is for education purposes only. I am not responsible for the profits or losses you generate from your investments.
Do your research before making any trades.
Thank you.
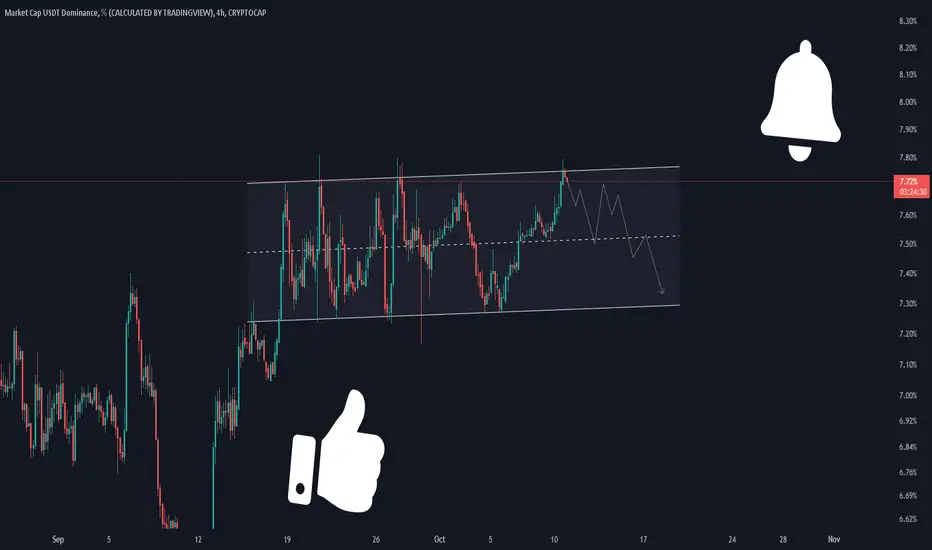
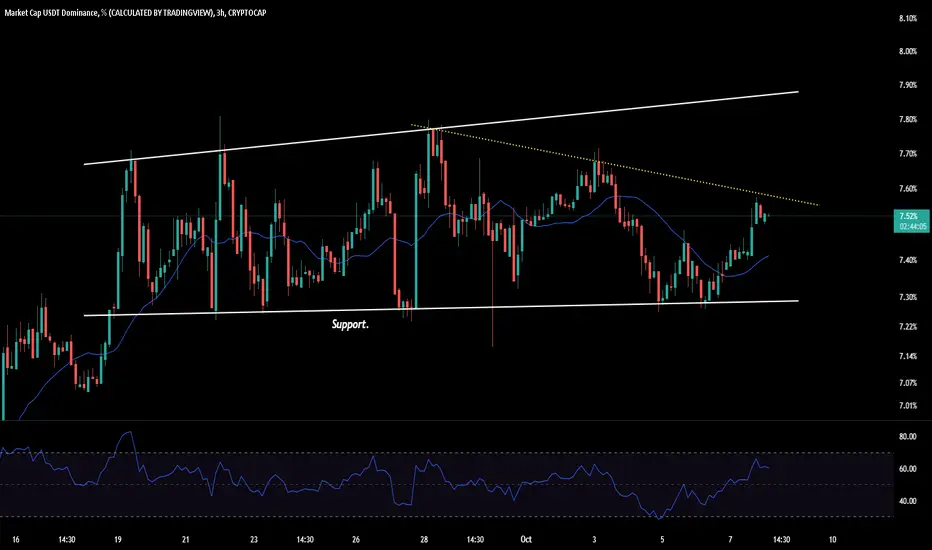
USDT DOMINNACE: CHANCES OF REJECTION.Hello traders, here's a quick update on the USDT dominance for you all.
Time frame: 3 hours.
Preview: In my previous update, I mentioned regarding the bounce back and how the 7.3% holds strong support. Things played out well so far.
Update: We saw how the market got dumped and the USDT.D rallied. Currently, we can see a slight resistance at the 7.58% range which could be the rejection point for USDT.D. To rally higher, the USDT.D must break out above the resistance level. A rejection on the other hand will pull back the price to 7.43% to 7.3%.
That's it for now. I hope this update will be helpful to you.
Trade safely.
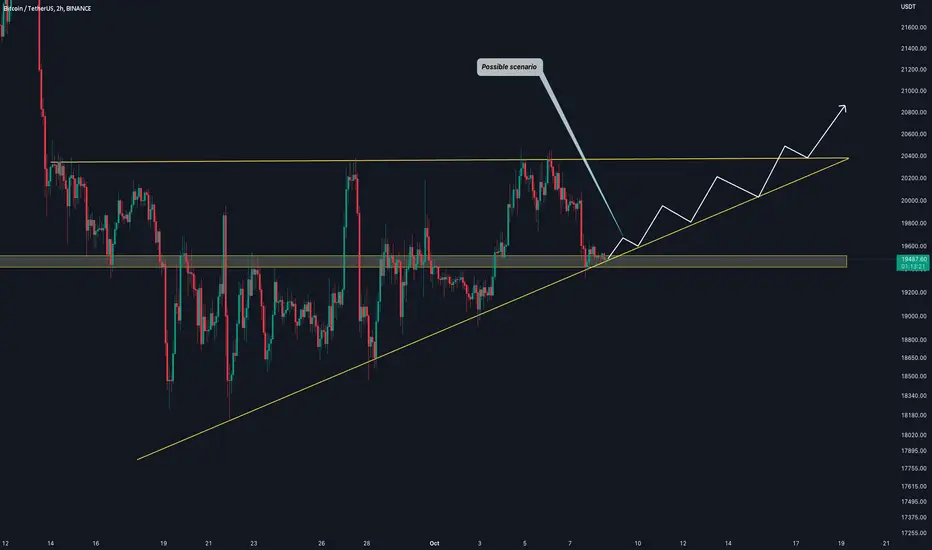
USDT Dominance at decisive point. Here's what to expect Next!!Understanding Dominance:-
USDT Dominance is inversely proportional to market movements.
If it dumps the market will pump and vice versa.
Technical Analysis:-
As we speak the dominance is approaching the resistance zone consisting of two trendlines intersecting each other.
This happens to be an important point for the market.
Remember if you zoom out, a break and close above this channel will result in more dumps in the market.
Whereas if we break the lower support, the green zone. BTC can rally towards $22k again.
Keep in mind we are stuck in the range of $18.5k to $20k.
CONCLUSION:- This last quarter is likely to be bullish IMO so sooner or later, am expecting this range to break to the downside.
Do your own research, this is not financial advice.
If you find this update helpful, Hit the like button and share your views in the comment section.
Thank you
#PEACE

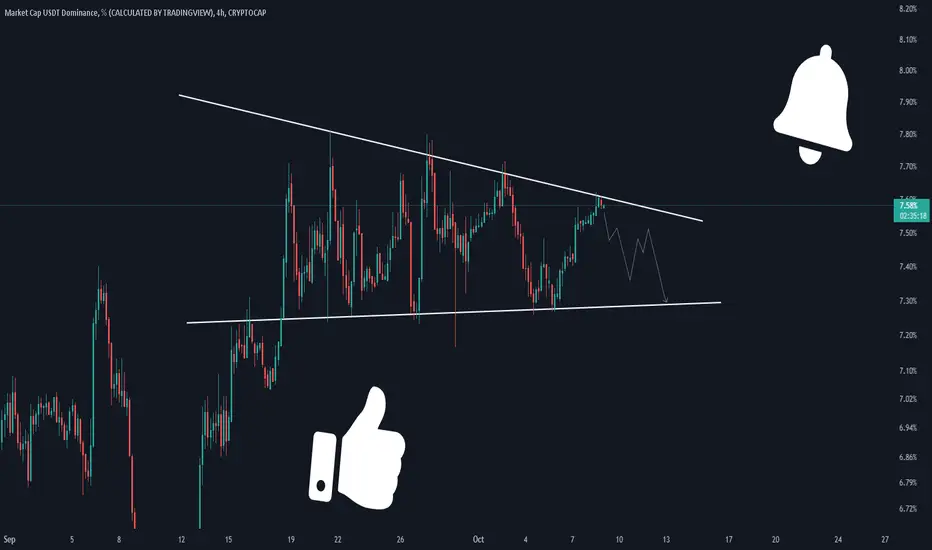
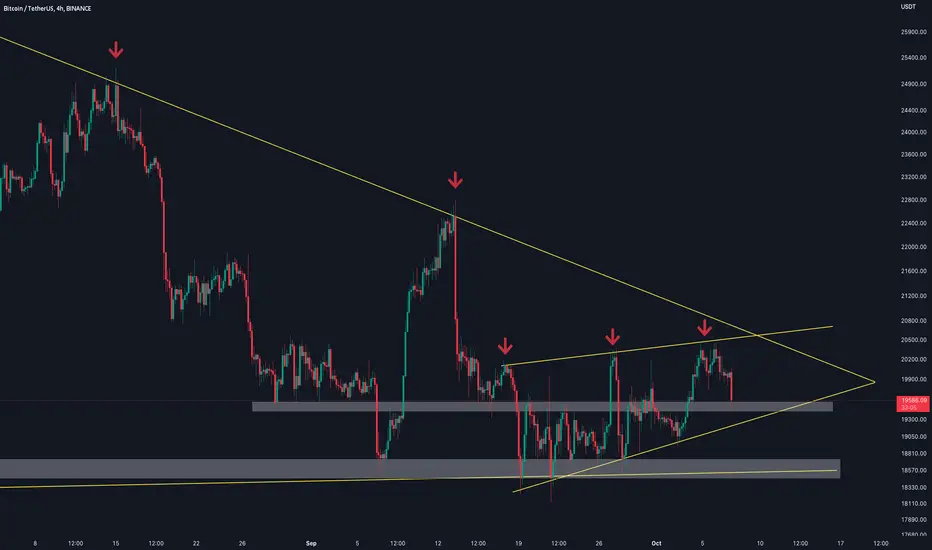
#BTC/USDT 4HR CHART UPDATE !!As BTC is currently trading inside a rising wedge pattern,
BTC moved back to the mid-lower support range after a bearish divergence below the upper trend line resistance.
BTC needs to hold this level to climb above again, rejection will lead it to touch 19k again.
This is not financial advice. This is for education purposes only. I am not responsible for the profits or losses you generate from your investments.
DO YOUR RESEARCH BEFORE MAKING ANY TRADES.
Thank you.
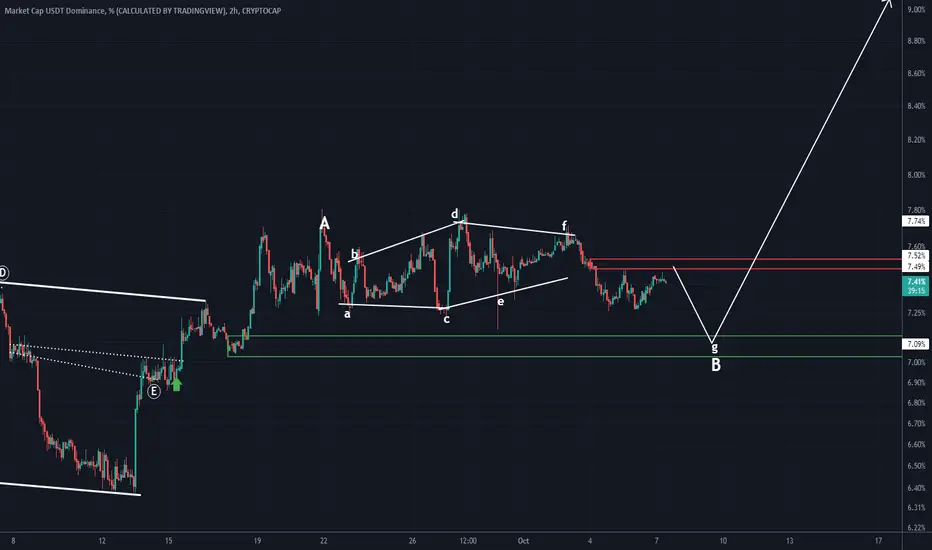
The dangerous situation of USDT.DIn terms of waves, we can have such fluctuations for the Tether market.
BITCOIN AND USDT DOMINNACE: SIDE-BY-SIDE COMPARISONHello traders, I hope you all are doing well. Today, I have an interesting update for you all. A side-by-side comparison of BTC and USDT.D.
I hope this idea will be helpful.
Time frame: 3 hours.
Update: As you can see in this chart, the USDT.D and BTC work like a parallel universe where things are totally opposite to each other. This is because BTC is in the USDT pair and the moment the sellers (in the majority) sell BTC, the USDT dominance increases. In the same way, when buyers (in the majority) purchase BTC in exchange for USDT, the dominance drops, and BTC increases.
Now, the current scenario shows a bearish move on BTC and a bullish move on USDT.D. If this pattern plays off accordingly, we can expect BTC to drop down close to $19k and the dominance to rally up to 7.9%. On the other hand, if BTC needs to be bullish again, it must break above the $20.4k resistance level. For the USDT dominance, 7.3% holds strong support.
I am not saying that we should rely only on these two charts for trades, a trader should always analyze other parameters before investing. There are other charts that we can analyze for better confirmation, the BTC dominance, the total2, DXY, USDC dominance, S&P 500, NASDAQ, etc., and of course the fundamentals.
That's it for now, I'll catch you up on my next update. Until then trade safely.
Thank you.

Bitcoin (BTC) - October 6Hello?
Welcome, traders.
By "following", you can always get new information quickly.
Please also click "Boost".
Have a good day.
-------------------------------------
(USDT 1D Chart)
(USDC 1D Chart)
If additional funds flow through USDT and rise above 68.468B, there is a possibility that the coin market will show an upward trend.
However, for this uptrend to continue, the outflow of funds through USDC must stop.
(BTC.D 1D Chart)
BTC dominance tells you how much money is being concentrated towards BTC or altcoins.
Therefore, when BTC dominance rises, it means that funds are being concentrated towards BTC.
(USDT.D 1D Chart)
USDT Dominance tells you if your funds are being utilized in the coin market.
If USDT dominance declines, the coin market is likely to rise.
However, since it is the flow of money throughout the coin market, if BTC or ETH leads the coin market to an uptrend, altcoins may decline or go sideways.
Therefore, care must be taken in interpretation.
The rising gap in USDT dominance means that new funds have flowed into the coin market.
A drop in the gap means that funds have flowed out of the coin market.
(NASDAQ100 1D Chart)
The key is whether it can support and rise above the 11371.9-11475.5 section.
If not, you should check to see if it is supported on the 10666.6-11169.5 section.
We need to see if we can continue with an attempt to break out of the short-term bearish channel.
------------------------------------------
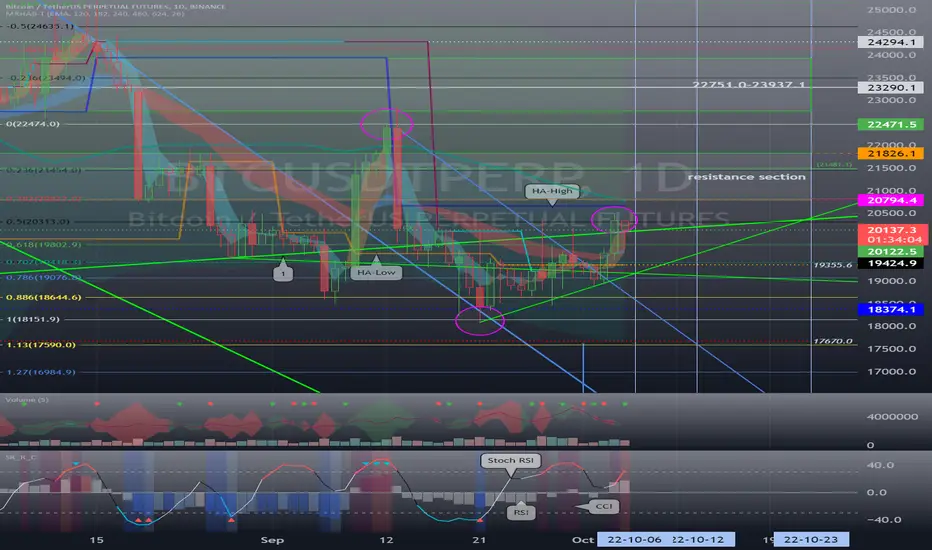
(BTCUSDTPERP 1D Chart)
- If it rises above 20794.4, the main position is 'LONG'.
- The 19424.9-20794.4 section is a quick response section.
- If it falls below 19424.9, the main position is 'SHORT'.
The key is to find support above 20122.5 and above the uptrend line (1).
To sustain the uptrend, the price must remain above the HA-High indicator.
So, it should either rise above 20794.4, or shake it up and down to make the HA-High indicator fall.
We need to see if we can sustain the price above 19424.9 during the volatility period between around 6-12 October.
If there is an upward trend this time, it is expected that the maximum hurdle will be the 20794.4-21826.1 section.
The SR_R_C indicator includes the Stoch RSI, RSI, and CCI indicators.
A trend reversal is highly likely to occur when two or more of these indicators enter the oversold or overbought zone.
Some indicators may be in the oversold zone and some may be in the overbought zone.
This is likely to be mixed, so it is recommended to pause trading and check the situation.
------------------------------
- big picture
I think you need to be supported in the 13K-15K section to gain the strength to rise.
So, whether it rises or falls from its current position, both require a short-term response.
A full-fledged uptrend is expected to begin when it rises above 29K.
------------------------------------------------------------ -------------------------------------------
** All descriptions are for reference only and do not guarantee a profit or loss in investment.
** If you share this chart, you can use the indicators normally.
** The MRHAB-T indicator contains indicators that indicate support and resistance points.
** SR_R_C indicators are displayed as StochRSI(line), RSI(columns), CCI(bgcolor).
** CCI indicator is expressed as overbought range (CCI > +100) and oversold range (CCI < -100).
(Short-term Stop Loss can be said to be a point where profit and loss can be preserved or additional entry can be made through split trading. It is a short-term investment perspective.)
---------------------------------
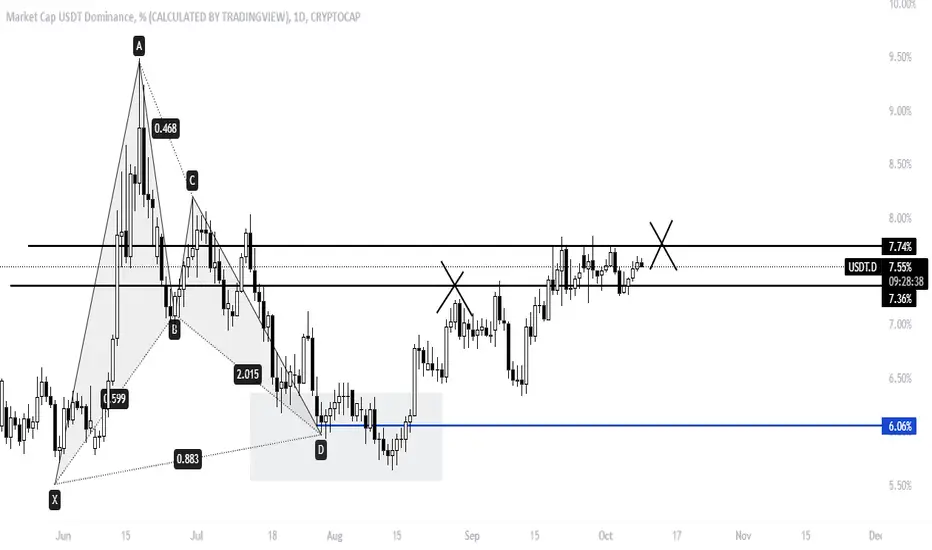
USDT DOMINNACE: PERFECT BOUNCE.USDT Dominance Update:
A perfect bounce as you can see. Damn! I did not see this trendline coming. The USDT.D is rallying up and we can see the opposite reaction on BTC and other altcoins. If this bounce is so good to be true then we may see some more dumps in the market.
I hope you guys followed my BTC update and acted accordingly. Congratulations to those who shorted the market and those who are in loss, if the loss isn't heavy just get out but if it is huge then bear with it.
That's it from my end. Trade safely.

USDT.D CONTINUATION BAD FOR CRYPTOUSDT.DOMINANCE CHART
Weekly and Daily timeframe Symmetrical Triangle in play with target as shown just past the Range High at 10%.
Not good for crypto because going above the blue line 0.382 labelled above market = Chaos.
RSI printing Bullish Divergence.
I also believe we are in the 5th Impulsive Elliot Wave with blow off top, followed by an ABC Corrective Waves.
It is just an idea but if it plays out very bearish for CRYPTO.
