Analysis of USDTRY 8.10.2019The price above 200 MA, indicating a growing trend.
The MACD histogram is above the zero lines.
The oscillator Force Index is above the zero lines.
If the level of resistance is broken, you should follow the recommendations below:
• Timeframe: H4
• Recommendation: Long Position
• Entry Level: Long Position 5.8500
• Take Profit Level: 5.9000 (500 pips)
If the price rebound from resistance level, you should follow the recommendations below:
• Timeframe: H4
• Recommendation: Short Position
• Entry Level: Short Position 5.7900
• Take Profit Level: 5.7600 (300 pips)
USDJPY
A possible short position in the breakdown of the level 107.00
GOLD
A possible long position at the breakout of the level 1505.00
USDCHF
A possible short position in the breakdown of the level 0.9910
EURUSD
A possible long position at the breakout of the level 1.1000
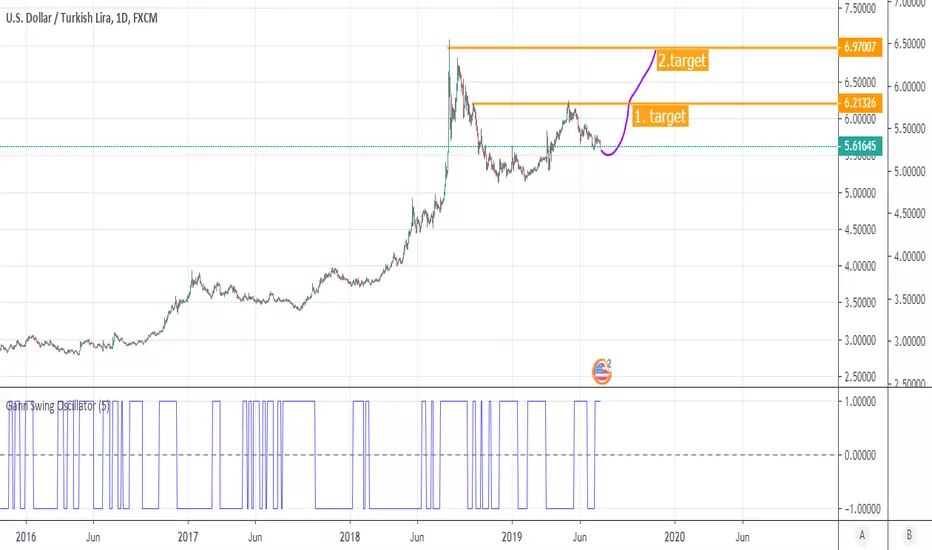
Usdtrylong

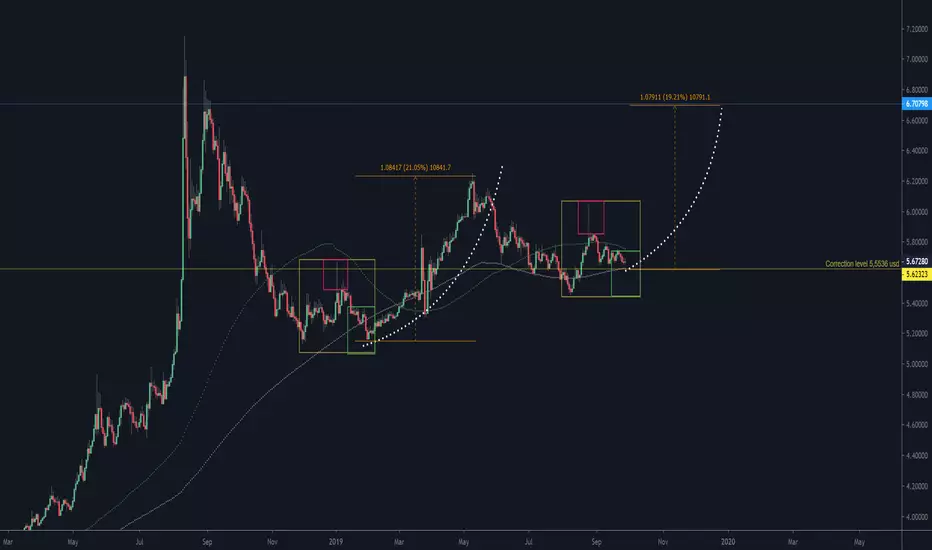
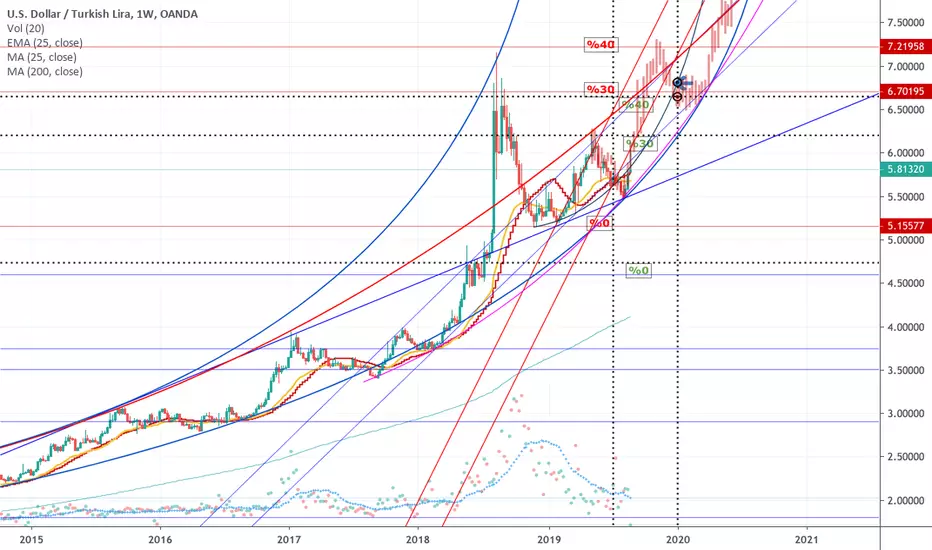
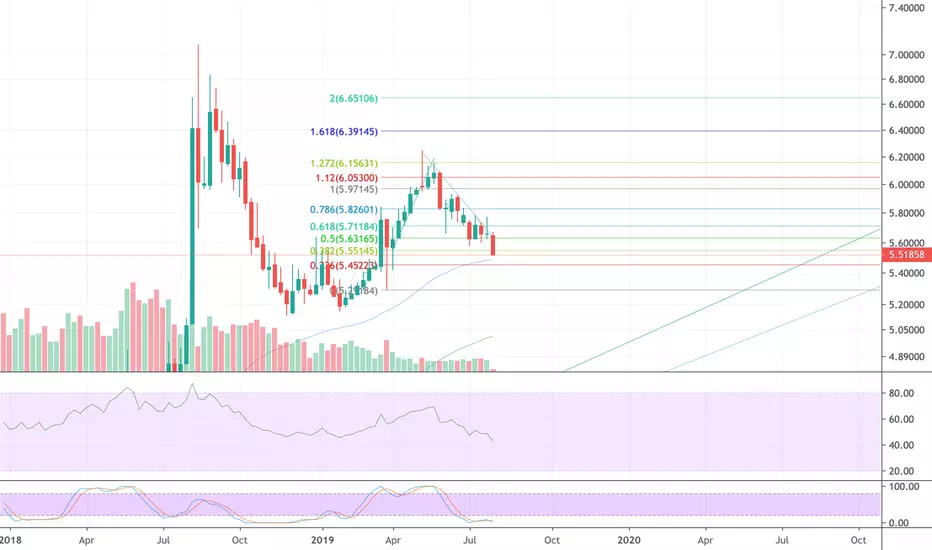
USDTRY before rising 19%... The exchange deals with the construction of the second part of a double fractal structure. If my current analysis is correct, the exchange rate may start to rise from the US $ 5.5536 correction level. The target price for this increase can be 6.70798 usd.
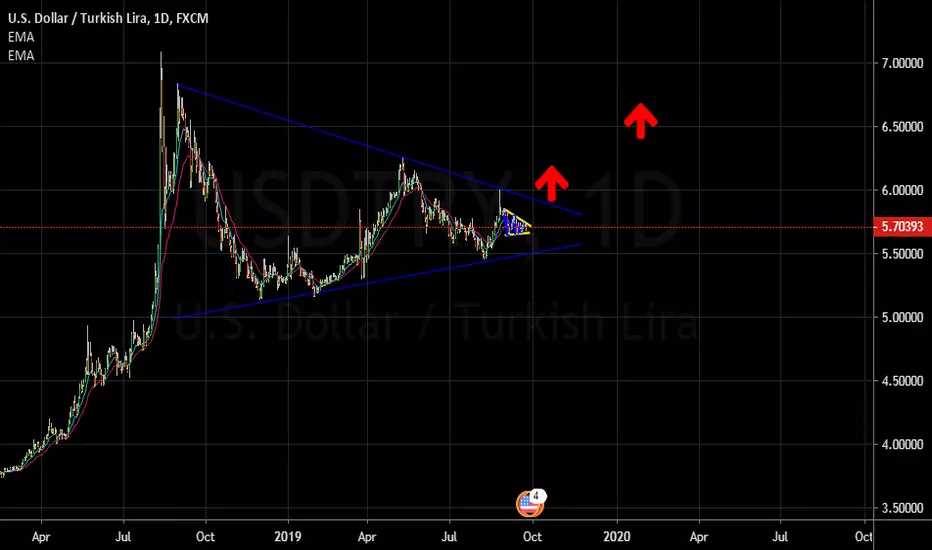
USDTRY Huge potential upsideThere is a huge potential for the currency usdtry to test August 2018 levels.

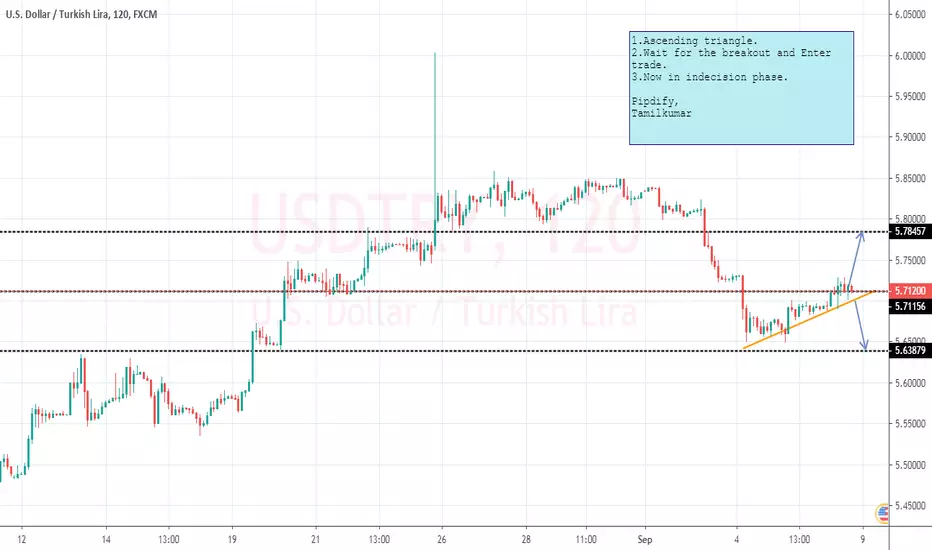
USDTRY - Ascending triangle - Breakout trade.OANDA:USDTRY --------Details on the chart.
Pipdify,
Tamilkumar.
USD/TRY is going in an uptrend channel to 5,92Due to short of cash in Turkey, USD is gaining power against TRY day by day. We can see some small corrections to support of chnanel like 5,78 - 5,80 but the trend is going upwards since 5,50's.
Uptrending channel will meet with the resistance at the end of August and than we can see some steep movements probably upwards or maybe some corrections. Until than, I expect the value will continue to 5,9x

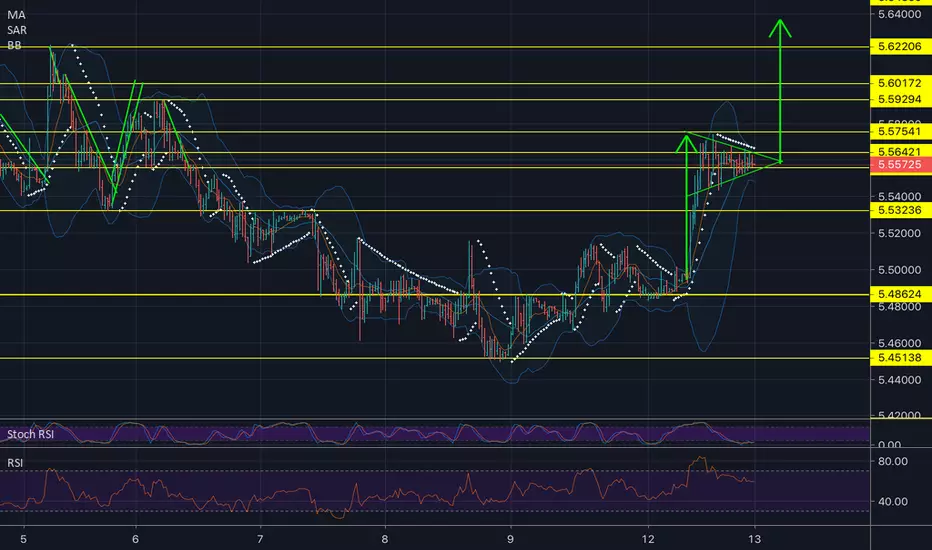
USD/TRY is forming a second pennant move We can see on the half hour graph that USDTRY is forming a second pennant formation.
We have to wait and see other indicators to support this move such as Parabolic SAR and RSI. Moving average is crossing the bollinger middle band as I'm publishing this. Volume is getting higher in each stick forms. Also bollinger bands narrowed down for a move. Target of this pennant will be around 5,81
This morning price made a false break of pennant support. Just like it did on the first pennant formation. And the steep uptrend started right after this false break. Most probably that false break stopped many people's trade.

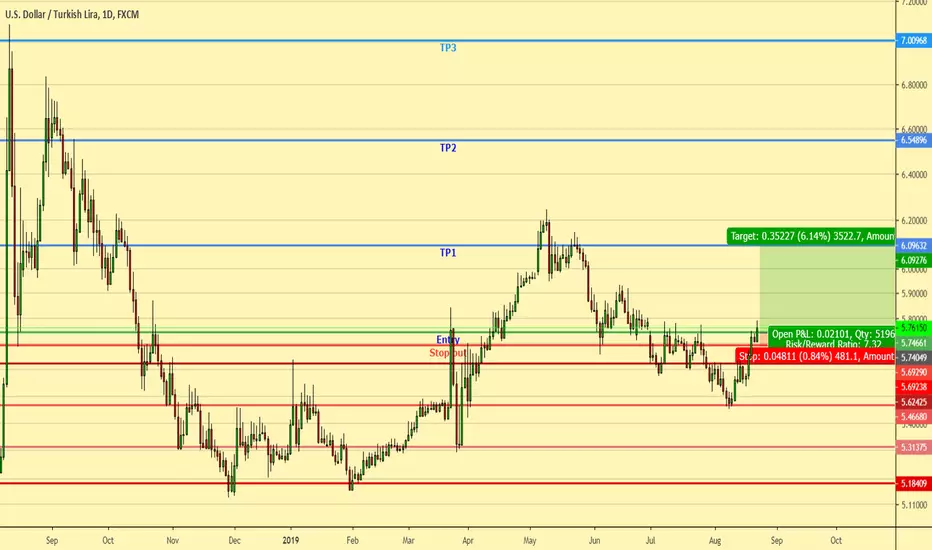
USDTRYGood setup for long position
PP: 5.76192
EP: 5.74
SL: 5.688
TP0: 5.92
TP1: 6.1
TP2: 6.5
TP3: 7
Good luck
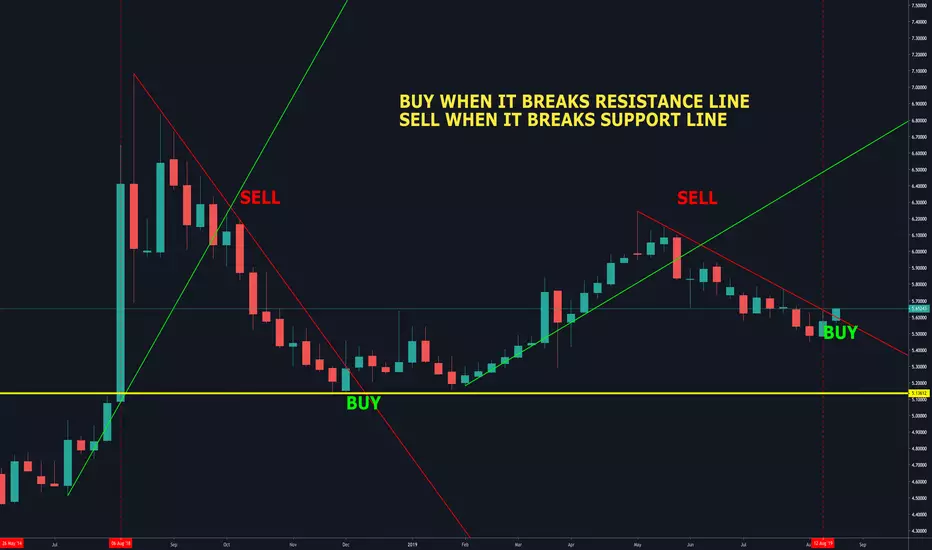
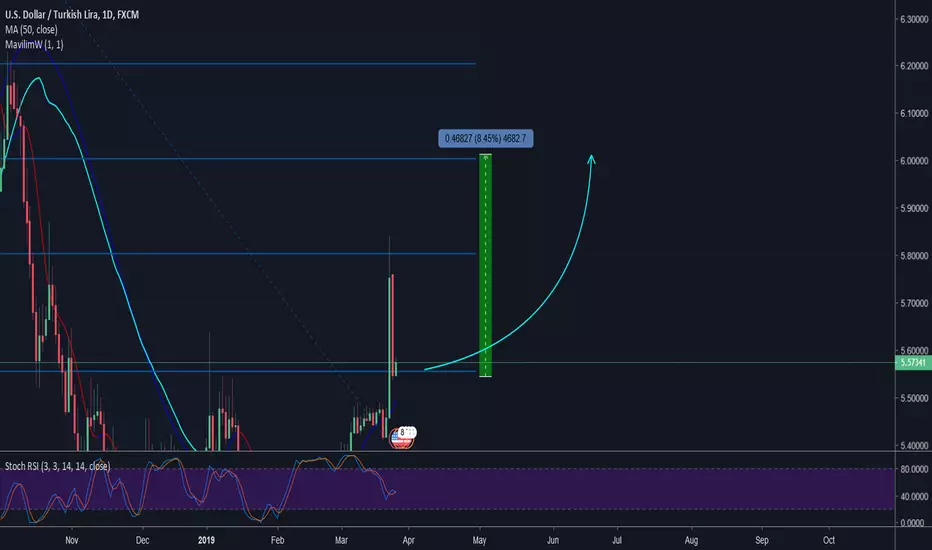
USDTRY BULLRUN HAS JUST STARTEDLast time MA50 crossed MA100 upwards @ 15.02.2019. Same thing possibly will happen today. Downtrend trend upper line broken.
Weekly and monthly over-sold
SL:5.63
TPs:Depicted with light green.(Take into account fibo resistance levels also.)
Good luck


Bullish pennant formation on USD/TRYDue to Turkish holiday TRY will be traded weakly until Thursday. At these times, values can be more volatile.
We can clearly see the bullish pennant formation on USD/TRY. Tomorrow we have to carefully watch the value. If it will break the pennants resistance, value may go up to 5,62-5,65 channel. We can see that there will be a steep movement from the narrowed bollinger bands.
Parabolic SAR shows the downturn and also moving average does not support the upmove so that we can also expect a steep down move. In case of a down break reaction, we have to watch 5,53 support line.
Good luck all.
6.39 TargetLast stop for usdtry,
Today or tomorrow, waiting for 5.48 first, then 5.45-5.44, then target is 6.39
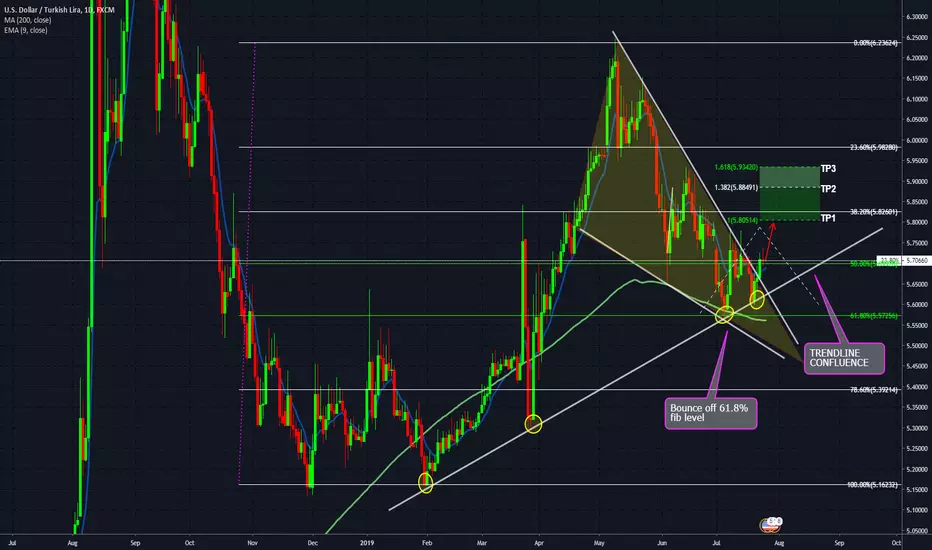
USD/TRY Take a Step Back - Higher Timeframe AnalysisThis post is for educational purposes only. Trade at your own risk. Please refer to my previous analysis today (below). This gives a high level overview of long term what we can see happen in the market with this pair. We have a descending wedge forming, alongside trendline confluence, and a bounce off the 61.8 fib level. Trade at your own risk. As this is high level outlook there is a lot of price action that goes on in the lower time frame. Most retail traders have to drill into lower time frame to capture pips on short price action. (see previous trade idea below)
USDTRY LONGI create a Fibonacci line. We on the support line and we have to ready long position.
Because
- Bull trend
- Elections
- Turkey economic and politic problems (First and the bigger problem is RTE)
- Turkish lira is very useless and powerless
- Turkey Central Bank thaw reserve
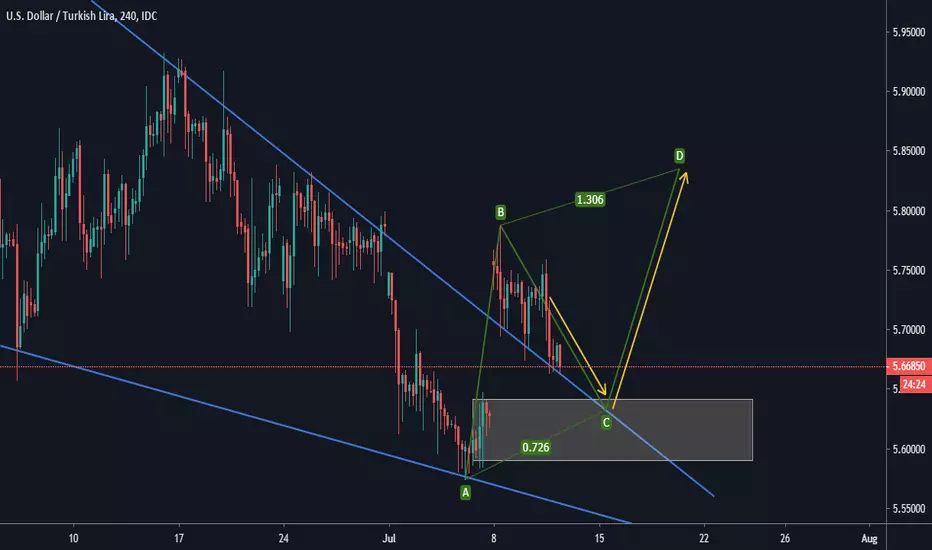
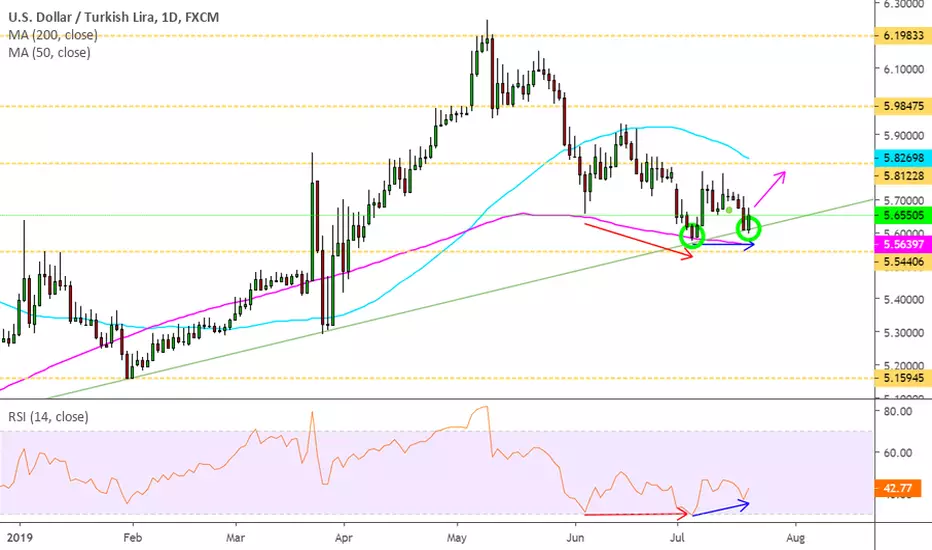
USDTRY confluence to go longVery similar idea to my EURTRY idea posted yesterday. You can find the link in this post.
The price is hitting an ascending trendline (green) dating from February. That is a very strong support. It is also supported by the fact that it is a double bottom and we are seeing bullish signals. RSI confirms this view with a bullish divergence and the pair is very close to an important area of horizontal support and MA200.
All that makes me think that price will rebound to the next resistance at 5.812 where it will face resistance by MA50 too.
The problem I see in this pair is the 4H chart:
First thing we see is that the price action is not very clean and that always concerns me a little bit. We also see that the price is below the MA50 and below the descending trendline (green line) that is pretty much following the MA200. That is a lot of resistance and if we wait to see if it breaks them it will probably be too late to enter the trade as we will be approaching a horizontal level.
So what do we do???
We can stay in the sidelines or we can buy at the actual price level (supposing there is no gap on Monday) and place a SL at around 5.589. This level is important because it would mean that the price broke below the ascending trendline and that it broke the closing price of the lowest point on the 5th of July.
This is a risky trade but what is life without risk and excitement!
Trade safe and share your views in the comments below!
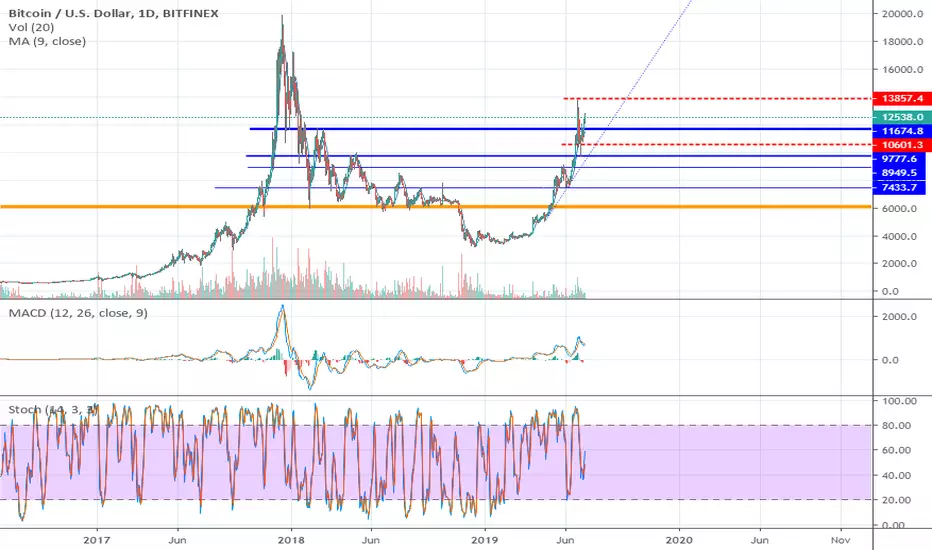
USD-TRY Cup and Handlethere is a definently cup and handle formation which is the very bullish continuation pattern.
USDTRY - Expanding wedge offers upside baisFX:USDTRY
OANDA:USDTRY
SAXO:USDTRY
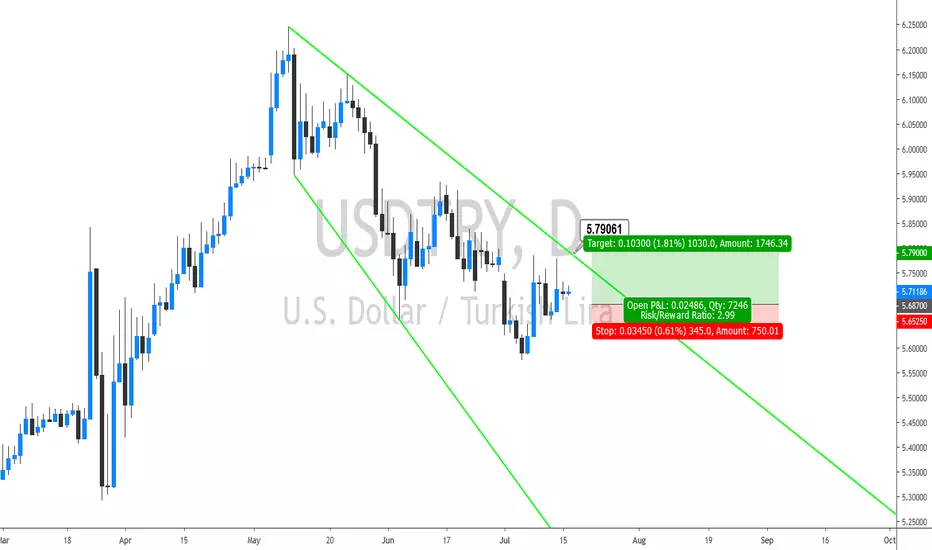
USDTRY - Intraday - We look to Buy at 5.6870 (stop at 5.6525)
Posted Mixed Daily results for the last 47 days. Price action has formed an expanding wedge formation. The medium term bias remains bullish. The trend of lower highs is located at 5.7905. However, with the intraday chart now highlighting higher lows we are possibly forming an ascending triangle pattern. Further upside is expected although we prefer to set longs at our bespoke support levels at 5.6870, resulting in improved risk/reward.
Our profit targets will be 5.7900 and 5.8000
Resistance: 5.7905 / 5.8000 / 5.9500
Support: 5.6870 / 5.6460 / 5.6300
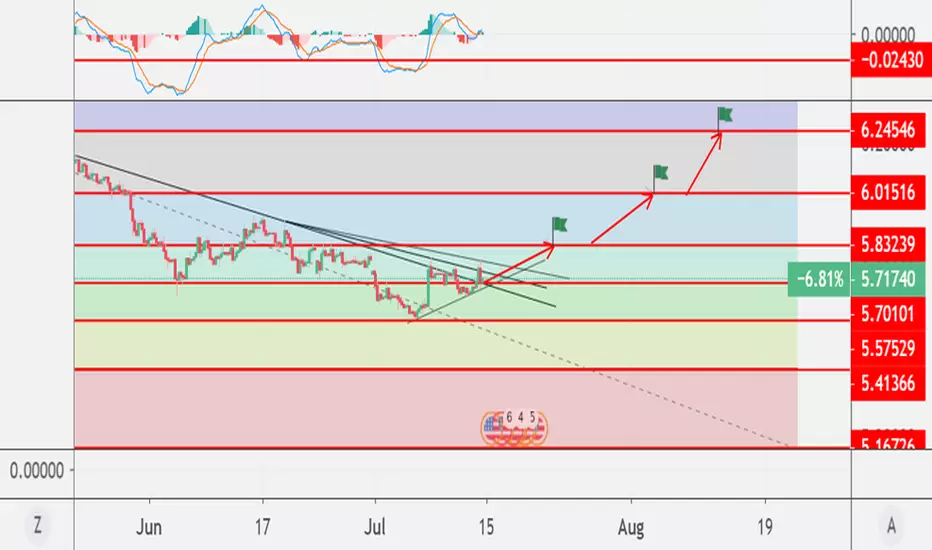
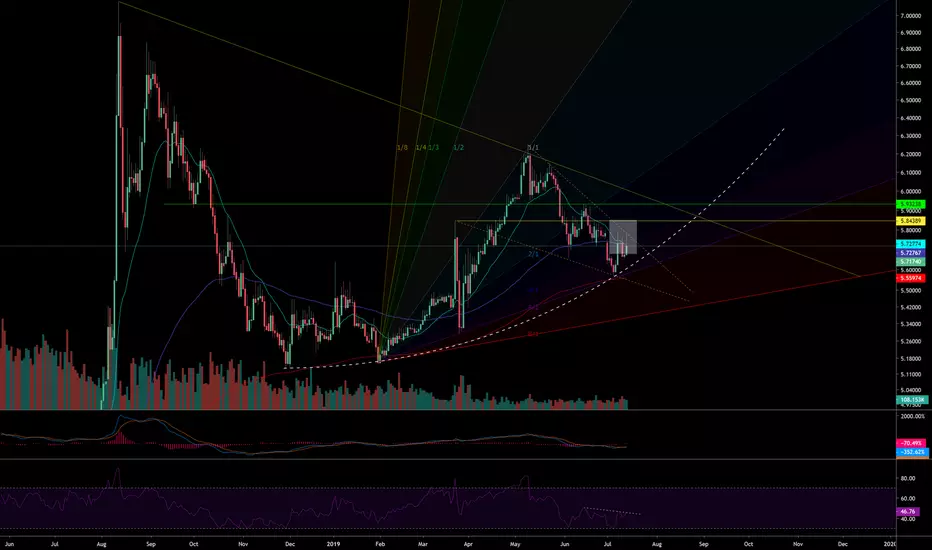
USDTRY Decision Time is CloseSo far price was loyal to the descending wedge formation, and as expected, 200 EMA held the defense perfectly. Parabolic support also seems to be working.
Next step will be conquering the 20 & 100 EMA resistances along with the upper line of the descending wedge formation. All these converged on the same zone (the area shown as faint white box), which made that zone super important.
20 EMA is about to cross 100 EMA, which would create downward price pressure. However MACD and RSI all bullish.
If the price breaks the descending wedge formation, buy orders will surely increase.
If the price breaks yellow price level (5.84-85) I consider that as the second confirmation for the rally.
Green price level would be the final confirmation for the next big rally.
Fundamental developments are all against TRY unfortunately. (CB president just sacked by Erdogan unlawfully, Fitch downgraded Turkey's credit rating again, S400 related developments might cause more pressure from the US (like more sanctions?) etc...)
USDTRY, Buy on H4**Disclaimer** the content on this analysis is subject to change at any time without notice, and is provided for the sole purpose of assisting traders to make independent investment decisions, -