NAS100 Technical Analysis Report - NASDAQ & US Market# NAS100 Technical Analysis: NASDAQ Comprehensive Multi-Timeframe Trading Strategy
Executive Summary
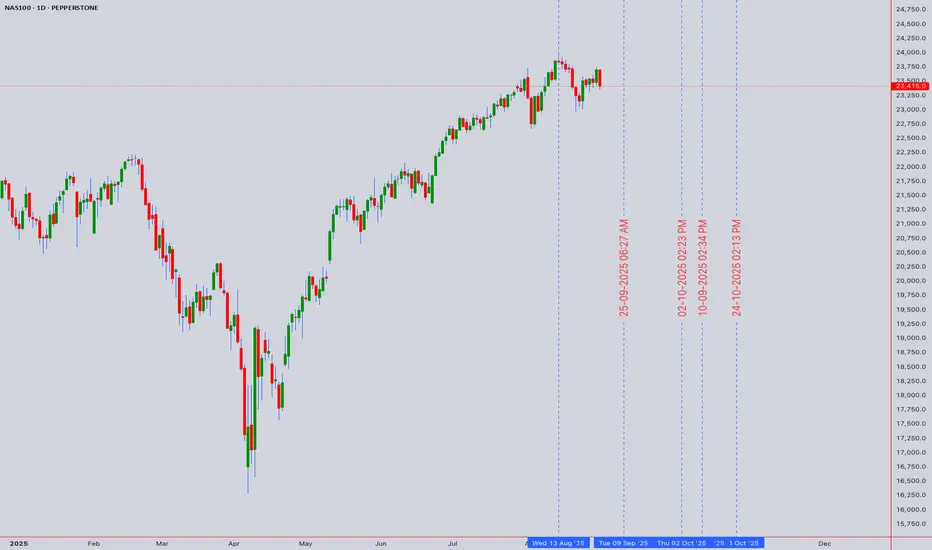
Current Price: 23,415.0 (August 30, 2025, 12:54 AM UTC+4)
Market Sentiment: Cautiously Bullish with Rate Cut Optimism
Primary Trend: Uptrend with consolidation characteristics
Key Catalyst: Fed Chair Powell's Jackson Hole speech signaling potential September rate cut
The NASDAQ-100 continues to demonstrate resilience following Fed Chair Jerome Powell's dovish signals at Jackson Hole, with markets pricing in high probability of September rate cuts. The index benefits from renewed optimism in technology sectors and artificial intelligence themes, though elevated valuations warrant selective positioning.
Market Context & Fundamental Backdrop
Federal Reserve Policy Outlook
Following Powell's Jackson Hole speech, markets have significantly increased bets on a September rate cut. The Fed Chair indicated that "conditions may warrant" interest rate cuts, with the balance of risks to employment and inflation shifting. Current federal funds rate remains at 4.25%-4.50%, but CME FedWatch Tool shows high probability of cuts beginning in September 2025.
Economic Environment
The US economy has shown resilience despite policy uncertainties, with the dual mandate of the Fed becoming more balanced. Labor market data shows some "unusual" behavior that could become concerning, supporting the case for monetary policy adjustment.
Technology Sector Dynamics
The artificial intelligence boom remains robust, providing fundamental support for NASDAQ constituents. However, chipmaker volatility has created intermittent pressure on the index, requiring careful sector rotation analysis.
Market Performance Context
Recent trading sessions have shown volatility, with the NASDAQ experiencing both significant gains and pullbacks. The index closed at 21,449.29 in late August trading sessions, demonstrating the current consolidation phase around elevated levels.
Technical Analysis Framework
Japanese Candlestick Analysis
Weekly Pattern: Long-legged doji formation indicating indecision at current levels
Daily Pattern: Inside bar sequences suggesting consolidation before next major move
Intraday Patterns: Morning star and evening star formations frequent in 4H timeframe
Volume Analysis: Average volume during recent consolidation phase
Elliott Wave Analysis
Primary Wave Structure:
Major Degree: Wave 5 of secular bull market potentially in final stages
Intermediate Degree: Subwave 5 of major Wave 5 showing extension characteristics
Minor Degree: Currently in subwave 4 correction within intermediate Wave 5
Wave Count Analysis:
Impulse Wave: Completed from 2020 lows to recent highs
Corrective Phase: Current consolidation representing Wave 4 of larger structure
Target Projection: Wave 5 completion targeting 25,000-26,000 zone
Critical Levels: Wave 4 support at 22,800-23,200 maintains bullish count
Harmonic Pattern Recognition
Active Harmonic Structures:
Bullish Cypher Pattern: Potential completion at 22,900-23,100 zone
ABCD Extension: Current formation targeting 24,200-24,500
Potential Bearish Gartley: Formation risk above 24,800 indicating reversal
Fibonacci Confluence Analysis:
- 61.8% retracement of major swing: 23,150
- 50% retracement level: 23,400 (current area of interest)
- 38.2% retracement: 23,650
- 1.618 extension target: 24,300-24,500
Wyckoff Method Analysis
Phase Assessment: Accumulation Phase D - Testing resistance
Market Structure:
- Sign of Strength (SOS) evident on rate cut optimism
- Last Point of Support (LPS) established around 23,000
- Backup to Edge of Creek (BUE) tests showing institutional accumulation
- Spring action potentially completed in August lows
Composite Operator Activity: Evidence of large player accumulation during recent weakness
W.D. Gann Technical Analysis
# Square of 9 Application
Current Position: 23,415.0 = 152.98° on the Gann wheel
Critical Resistance Levels:
- 23,409 (153°) - immediate geometric resistance
- 23,716 (154°) - intermediate resistance zone
- 24,025 (155°) - major resistance confluence
Key Support Levels:
- 23,104 (152°) - immediate geometric support
- 22,801 (151°) - strong support zone
- 22,500 (150°) - major psychological and geometric support
# Time Theory Application
Critical Time Cycles:
- September 3-6: 90-degree time angle from recent high
- September 21: Autumn equinox - natural market turning point
- October 12-15: 144-degree time cycle completion
- November 2-8: 180-degree cycle from major low
# Price and Time Squaring Analysis
Square Root of Price: √23,415.0 = 152.98
Next Significant Square Levels:
- 154² = 23,716 (key resistance zone)
- 155² = 24,025 (intermediate target)
- 156² = 24,336 (extended resistance)
- 160² = 25,600 (long-term target)
Support Square Levels:
- 152² = 23,104 (immediate support)
- 151² = 22,801 (strong support)
- 150² = 22,500 (major support)
# Gann Angle Analysis
Primary Angles from Major Low:
- 1x1 Angle: Providing dynamic support around 23,200
- 2x1 Angle: Resistance trend line near 23,800
- 1x2 Angle: Long-term support at 22,600
Ichimoku Kinko Hyo Analysis
Cloud Configuration:
Tenkan-sen (9): 23,425 - Price slightly below, neutral bias
Kijun-sen (26): 23,380 - Price above, mild bullish confirmation
Senkou Span A: 23,402 (cloud top)
Senkou Span B: 23,150 (cloud bottom)
Chikou Span: Above price action 26 periods ago (bullish)
Assessment: Price trading at cloud top resistance with mixed signals requiring breakout confirmation for directional clarity.
Multi-Timeframe Technical Indicator Analysis
5-Minute Chart (Scalping Focus)
RSI(14): 51.3 - Neutral territory with slight bullish bias
VWAP: 23,408 - Price oscillating around VWAP equilibrium
Bollinger Bands: Middle band at 23,410, bands contracting (low volatility environment)
Stochastic: 48.2 in neutral zone
Volume: Below average, typical for consolidation phase
Key Scalping Levels:
Micro Resistance: 23,435, 23,460, 23,485
Micro Support: 23,390, 23,365, 23,340
15-Minute Chart (Scalping Focus)
MACD: Histogram near zero line, momentum neutral
Williams %R: -52% indicating no extreme conditions
Moving Averages: EMA(20) converging with SMA(20) around 23,400
Volume Profile: High volume node at 23,380-23,430
Scalping Strategy Levels:
Long Bias Zone: 23,385-23,405
Short Bias Zone: 23,445-23,465
Breakout Alerts: Above 23,480 (bullish) / Below 23,360 (bearish)
1-Hour Chart (Day Trading)
RSI(14): 54.7 - Slight bullish momentum without overbought conditions
VWAP: 23,395 providing dynamic support
ADX(14): 28.3 indicating moderate trend strength
Parabolic SAR: Below price at 23,350 (bullish signal)
Day Trading Framework:
Primary Resistance: 23,500-23,550
Secondary Resistance: 23,650-23,700
Primary Support: 23,250-23,300
Secondary Support: 23,100-23,150
4-Hour Chart (Swing Trading)
RSI(14): 58.9 in bullish territory but not overbought
MACD: Positive momentum with slight bullish divergence forming
Bollinger Bands: Price near upper band, expansion needed for continuation
Ichimoku: Price at cloud resistance requiring break for bullish confirmation
Swing Trading Levels:
Key Resistance Zone: 23,700-23,800
Breakout Target: 24,000-24,200 on sustained break
Support Structure: 23,200-23,300
Stop Loss Consideration: Below 23,100 invalidates bullish structure
Daily Chart (Position Trading)
RSI(14): 61.4 showing healthy bullish momentum
MACD: Positive with momentum building
Volume: Consolidation pattern with average participation
Moving Averages: All major MAs (20, 50, 100, 200) aligned bullishly
Position Trading Analysis:
Triangle Pattern: Ascending triangle formation approaching apex
Breakout Targets: 24,500-25,000 on upside resolution
Support Defense: 23,000-23,200 critical for trend continuation
Time Factor: Resolution expected within 2-3 weeks
Weekly Chart (Long-term Analysis)
RSI(14): 65.8 approaching overbought but sustainable
MACD: Strong positive momentum with room for extension
Long-term Trend: Powerful uptrend since 2020 lows intact
Major Resistance: 25,000-25,500 psychological zone
Monthly Chart (Strategic View)
RSI(14): 71.2 significantly overbought (caution warranted)
Long-term Structure: Multi-year cup and handle completion
Secular Target: 28,000-30,000 based on pattern measurement
Major Support: 20,000-21,000 long-term trend support
Comprehensive Support and Resistance Analysis
Primary Support Structure
1. 23,380-23,420: Kijun-sen and VWAP confluence (immediate)
2. 23,300-23,350: Previous consolidation zone with volume
3. 23,200-23,250: Triangle support and trend line confluence
4. 23,100-23,150: Cloud bottom and Fibonacci support
5. 23,000-23,050: Major psychological level and institutional interest
6. 22,800-22,900: Elliott Wave 4 support and harmonic completion
7. 22,500-22,600: Extended support and Gann square level
Primary Resistance Structure
1. 23,450-23,480: Immediate intraday resistance
2. 23,550-23,600: Short-term resistance and previous reaction high
3. 23,700-23,750: Triangle resistance and Gann confluence
4. 23,900-24,000: Intermediate resistance and psychological level
5. 24,200-24,300: Major resistance zone and measured targets
6. 24,500-24,700: Extended targets and harmonic projections
7. 25,000-25,200: Major psychological resistance and long-term targets
Weekly Trading Strategy (September 2-6, 2025)
Monday, September 2, 2025 (Labor Day - US Markets Closed)
Market Environment: Limited trading due to US holiday
Strategy Focus: Pre-positioning for Tuesday's resumed activity
International Markets: Monitor for any overnight developments
Pre-Market Analysis:
Gap Scenarios: Assess any gap formation from Friday's close
Global Sentiment: Monitor Asian and European markets for cues
News Flow: Fed speakers or economic data releases
Tuesday, September 3, 2025
Market Environment: Resumption of full trading after holiday
Primary Strategy: Range trading with breakout preparation
Volatility Expectation: Above average due to holiday catch-up
Intraday Trading Strategy:
Opening Range: 23,350-23,480 expected
Long Setup: 23,380-23,400
- Stop Loss: 23,350
- Target 1: 23,450 (1:2 R/R)
- Target 2: 23,500 (1:3.5 R/R)
Short Setup: 23,460-23,480
- Stop Loss: 23,510
- Target 1: 23,400 (1:1.2 R/R)
- Target 2: 23,350 (1:2.2 R/R)
Key Levels to Watch:
Breakout Above: 23,500 targets 23,600-23,650
Breakdown Below: 23,320 targets 23,250-23,200
Wednesday, September 4, 2025
Market Environment: Mid-week momentum potential
Primary Strategy: Trend following with momentum confirmation
Focus: Economic data and Fed speakers impact
Trading Approach:
Bullish Scenario: Break above 23,500 with volume
- Entry: 23,510-23,530
- Stop: 23,450
- Targets: 23,600, 23,700, 23,800
Bearish Scenario: Break below 23,300 with momentum
- Entry: 23,290-23,270
- Stop: 23,330
- Targets: 23,200, 23,100, 23,000
Risk Management: Reduce position sizes by 30% if range-bound continues
Thursday, September 5, 2025
Market Environment: Potential high-volatility day
Primary Strategy: Breakout trading with volume confirmation
Critical Factor: Triangle pattern resolution expected
Triangle Breakout Strategy:
Upside Breakout: Above 23,650
- Volume Requirement: 150% of 20-day average
- Initial Target: 23,800-23,850
- Extended Target: 24,000-24,200
- Stop Loss: 23,550
Downside Breakdown: Below 23,200
- Volume Requirement: 130% of 20-day average
- Initial Target: 23,000-22,950
- Extended Target: 22,800-22,700
- Stop Loss: 23,280
Position Management:
- Scale into positions on confirmed breakouts
- Trail stops aggressively after first target achieved
- Monitor sector rotation for continuation signals
Friday, September 6, 2025
Market Environment: Week-end positioning and profit-taking
Primary Strategy: Consolidation trading and weekly close analysis
Focus: Jobs data potential and weekly settlement
End-of-Week Strategy:
Weekly Close Bullish: Above 23,500 sets up next week advance
Weekly Close Neutral: 23,300-23,500 maintains current pattern
Weekly Close Bearish: Below 23,300 suggests pattern failure
Day Trading Approach:
Morning Session: Follow Thursday's breakout direction
Midday: Range trading within established boundaries
Final Hour: Position adjustments for weekend risk
Non-Farm Payrolls Impact:
Strong Data: Could delay Fed cuts, potential market negative
Weak Data: Supports Fed cut narrative, likely market positive
In-Line Data: Maintains current rate cut expectations
Advanced Risk Management Framework
Position Sizing Matrix
Risk Allocation by Timeframe:
5M Scalping: 0.25-0.5% of capital per trade
15M Scalping: 0.5-0.75% of capital per trade
1H Day Trading: 1-1.5% of capital per trade
4H Swing Trading: 1.5-2.5% of capital per trade
Daily Position Trading: 2.5-3.5% of capital per trade
Dynamic Stop Loss Framework
Volatility-Adjusted Stops:
Low Volatility (<1% ATR): Stops at 0.75% of entry
Medium Volatility (1-2% ATR): Stops at 1.25% of entry
High Volatility (>2% ATR): Stops at 2% of entry
Timeframe-Specific Stops:
5-Minute Charts: 40-60 points maximum
15-Minute Charts: 80-120 points maximum
1-Hour Charts: 150-250 points maximum
4-Hour Charts: 300-450 points maximum
Daily Charts: 600-900 points maximum
Profit-Taking Methodology
Systematic Profit Realization:
First Target (40%): 1:1.5 Risk/Reward ratio
Second Target (35%): 1:2.5 Risk/Reward ratio
Third Target (25%): 1:4+ Risk/Reward ratio
Trailing Implementation: After second target achievement
Maximum Exposure Limits
Daily Risk Limits:
Total Portfolio: Maximum 5% risk across all positions
Single Strategy: Maximum 3% risk concentration
Sector Concentration: Maximum 40% in tech-related trades
Emergency Stop: -2% daily account drawdown triggers cessation
Geopolitical and Economic Risk Assessment
Federal Reserve Policy Impact
September FOMC Meeting: High probability of 25bp rate cut based on recent communications
Policy Path: Markets pricing 2-3 cuts through end of 2025
Communication Risk: Any hawkish surprises could trigger sharp correction
Independence Concerns: Political pressure on Fed policy creates uncertainty
Economic Data Dependencies
Labor Market: "Unusual" behavior noted by Powell requires monitoring
Inflation Trends: Sticky services inflation remains concern
GDP Growth: Resilience continues but tariff impacts uncertain
Consumer Spending: Holiday season performance critical for Q4
Geopolitical Considerations
Trade Policy: Tariff implementation timeline and magnitude
China Relations: Technology sector exposure to policy changes
Energy Security: Minimal direct impact on NASDAQ constituents
Dollar Dynamics: Strength/weakness affecting multinational earnings
Technology Sector Risks
AI Regulation: Potential oversight affecting major constituents
Semiconductor Cycle: Global chip demand and supply chain risks
Cybersecurity: Increasing threat landscape affecting valuations
Competition: Antitrust scrutiny on major tech platforms
Sectoral Analysis and Rotation Themes
NASDAQ 100 Sector Breakdown
Technology (45%): Apple, Microsoft, NVIDIA, Meta driving performance
Communication Services (15%): Google, Netflix, streaming platforms
Consumer Discretionary (12%): Amazon, Tesla leading components
Healthcare (8%): Biotech and medical device innovation
Other Sectors (20%): Diversified exposure across growth themes
Current Outperformers
1. Artificial Intelligence: NVIDIA, Microsoft, Google benefiting from AI boom
2. Cloud Computing: Amazon Web Services, Microsoft Azure expansion
3. Digital Advertising: Meta, Google capturing online spending shift
4. Electric Vehicles: Tesla maintaining technological leadership
Underperforming Areas
1. Traditional Software: Legacy platforms facing cloud migration pressure
2. Hardware Manufacturers: Margin pressure from supply chain costs
3. Streaming Services: Subscriber growth saturation concerns
4. Biotech: Regulatory approval timelines creating uncertainty
Rotation Indicators
Growth vs Value: Quality growth at reasonable prices favored
Large Cap vs Small Cap: Mega-cap technology leadership maintained
Secular vs Cyclical: Long-term secular themes outperforming cycles
Advanced Pattern Recognition and Trading Setups
Ichimoku-Based Strategies
Cloud Breakout Setup:
Bullish Signal: Price above cloud with Tenkan above Kijun
Entry: Break above 23,450 with volume confirmation
Stop: Below cloud at 23,150
Target: Measured move to 24,200-24,500
Kijun-sen Bounce:
Setup: Price return to Kijun-sen (23,380) with support
Entry: Bounce confirmation above 23,400
Stop: Below 23,350
Target: Previous high resistance at 23,650
Gann-Based Trading Approaches
Square of 9 Methodology:
Long Trades: Buy at 152° (23,104) targeting 154° (23,716)
Short Trades: Sell at 154° (23,716) targeting 152° (23,104)
Breakout Trades: Above 154° targets 155° (24,025)
Time Cycle Trading:
Major Turns: September 21 equinox reversal window
Minor Cycles: 90-degree angles creating intraweek pivots
Momentum Confirmation: Volume spikes during cycle completions
Wyckoff Accumulation/Distribution
Phase D Characteristics:
Testing Supply: Price probing resistance without heavy volume
Institutional Activity: Large lot accumulation on weakness
Markup Preparation: Successful tests lead to significant advances
Distribution Warning Signs:
Climactic Volume: Heavy selling on any approach to 25,000
Weakness Signs: Unable to hold gains on good news
Phase A Risk: Sharp reversal from resistance levels
Market Microstructure and Execution Considerations
High-Frequency Trading Impact
Algorithm Activity Zones:
23,000 Level: Heavy HFT support algorithm activity
23,500 Level: Resistance algorithm concentration
24,000 Level: Major psychological algorithm participation
Optimal Execution Windows:
9:30-10:00 EST: Maximum volatility and opportunity
11:00-11:30 EST: Mid-morning momentum continuation
14:30-15:00 EST: European close overlap activity
15:30-16:00 EST: Final hour positioning
Liquidity Considerations
High Liquidity Zones: 23,300-23,500 range with tight spreads
Reduced Liquidity: Above 24,000 and below 23,000 requiring careful sizing
After-Hours Trading: Limited liquidity requiring smaller position sizes
Order Flow Analysis
Institutional Patterns:
Accumulation: Evidence of large block buying 23,200-23,400
Distribution Zones: Monitor for heavy selling above 23,700
Momentum Algorithms: Active participation on breakout moves
Technology Integration and Trading Tools
Essential Trading Platforms
1. TradingView: Comprehensive charting with advanced indicators
2. Think or Swim: Professional-grade execution and analysis
3. Interactive Brokers: Direct market access and low commissions
4. Bloomberg Terminal: Institutional-grade data and news flow
Critical Alert Systems
Price-Based Alerts:
- Triangle breakout: 23,650 (bullish) / 23,200 (bearish)
- Psychological levels: 23,500, 24,000, 24,500
- Gann squares: 23,104, 23,716, 24,025
Volume-Based Alerts:
- Unusual volume spikes (>200% of 20-day average)
- Block trade notifications (>$10M trades)
- Dark pool activity indicators
News and Event Alerts:
- Fed speaker comments and policy communications
- Economic data releases (employment, inflation, GDP)
- Earnings announcements from major NASDAQ constituents
- Geopolitical developments affecting technology sector
Advanced Analysis Tools
Options Flow: Monitor unusual options activity for directional clues
Futures Positioning: Track institutional positioning in NQ futures
Sector Rotation: Monitor NASDAQ sector ETF performance relative to index
International Correlation: Track correlation with technology indices globally
Seasonal and Calendar Considerations
September Seasonality
Historical data shows September as traditionally weak month for equities, though technology sectors often show resilience. Current rate cut optimism may override seasonal weakness.
Federal Reserve Calendar
September 17-18: FOMC Meeting (high probability of rate cut)
October 29-30: Next FOMC Meeting
December 17-18: Final 2025 FOMC Meeting
Earnings Season Timeline
Q3 2025 Reporting: October-November period critical for NASDAQ constituents
Key Companies: Apple, Microsoft, NVIDIA, Google, Amazon reporting impact
Guidance Focus: AI spending, cloud growth, consumer demand trends
Holiday Impact Calendar
Labor Day (Sep 2): US markets closed
Columbus Day (Oct 14): Bond markets closed, equities open
Thanksgiving (Nov 27-28): Shortened trading sessions
Christmas/New Year: Year-end positioning effects
Conclusion and Strategic Outlook
The NASDAQ-100 stands at a critical inflection point, benefiting from Fed Chair Powell's dovish pivot while facing elevated valuation concerns and seasonal headwinds. The technical picture presents a compelling consolidation pattern with multiple breakout scenarios, requiring careful risk management and tactical positioning.
Key Investment Themes for September:
1. Fed Policy Pivot: Rate cut cycle beginning supports risk assets and growth stocks
2. AI Revolution Continuation: Technology leadership themes remain intact
3. Triangle Resolution: Current consolidation pattern approaching decision point
4. Seasonal Navigation: September weakness vs. Fed optimism dynamic
Tactical Trading Priorities:
Range Trading: Capitalize on 23,300-23,650 range until breakout
Breakout Preparation: Position for triangle resolution with volume confirmation
Risk Management: Elevated levels require disciplined position sizing
Sector Selection: Focus on AI beneficiaries and Fed-sensitive growth names
Medium-Term Outlook (1-3 Months):
The combination of Fed policy accommodation, robust AI/technology themes, and strong corporate fundamentals provides a constructive backdrop for NASDAQ advancement. Technical analysis suggests potential for significant upside toward 24,500-25,000 on successful breakout, though any hawkish Fed surprise or geopolitical shock could trigger sharp corrections.
Risk Scenario Analysis:
Bull Case: Fed cuts + AI momentum = targets 25,000-26,000
Base Case: Consolidation 23,000-24,000 through October
Bear Case: Fed disappointment + valuation concerns = correction to 21,500-22,000
Strategic Positioning Recommendations:
1. Maintain tactical long bias with disciplined risk management
2. Focus on high-quality technology leaders with AI exposure
3. Prepare for increased volatility around Fed meetings and earnings
4. Monitor triangle pattern resolution for significant directional moves
The multi-timeframe technical analysis framework presented provides robust tools for navigating the current market environment. Success will depend on maintaining discipline around the identified support/resistance levels while adapting to the evolving Fed policy landscape and technology sector dynamics.
Traders should remain flexible and prepared for both continuation and reversal scenarios, with particular attention to volume confirmation on any major breakout attempts. The convergence of technical patterns, fundamental catalysts, and seasonal factors creates a complex but opportunity-rich environment for skilled practitioners.
---
*This comprehensive analysis integrates multiple technical methodologies with current market fundamentals. All trading recommendations should be implemented within individual risk tolerance parameters and adapted to evolving market conditions. The technology-focused nature of the NASDAQ requires particular attention to sector-specific developments and regulatory considerations.*
---
For individuals seeking to enhance their trading abilities based on the analyses provided, I recommend exploring the mentoring program offered by Shunya Trade. (Website: shunya dot trade)
I would appreciate your feedback on this analysis, as it will serve as a valuable resource for future endeavors.
Sincerely,
Shunya.Trade
Website: shunya dot trade
---
Disclaimer: This post is intended solely for educational purposes and does not constitute investment advice, financial advice, or trading recommendations. The views expressed herein are derived from technical analysis and are shared for informational purposes only. The stock market inherently carries risks, including the potential for capital loss. Therefore, readers are strongly advised to exercise prudent judgment before making any investment decisions. We assume no liability for any actions taken based on this content. For personalized guidance, it is recommended to consult a certified financial advisor.
Usmarket
SPY to continue fallingSPY reached a top (resistance) fork line and started to fall. Based on this I entered long on VIX on July 28, when VIX was at its lowest point. I expect this fall of the market to continue.
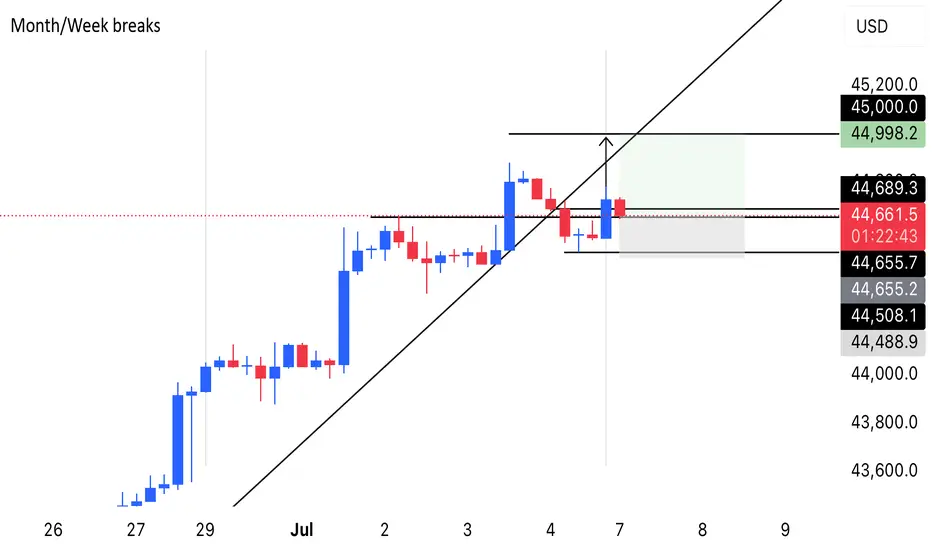
US30 LONG There's still bullish momentum on US30. Price has done third touch on US30, it printed a strong bullish signal for another bullish push, potentially to 45,000 psychological level.

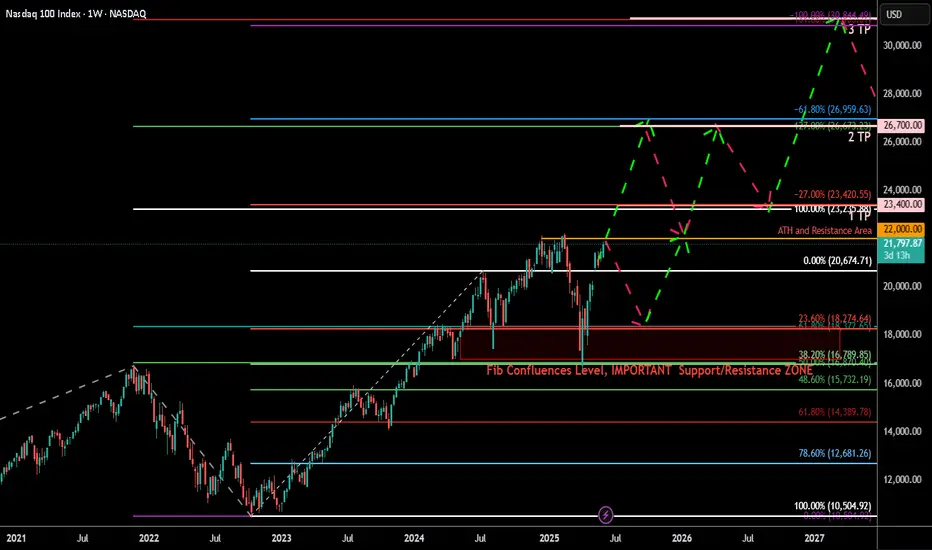
Nasdaq-100 (NDX) Weekly Chart 2025 Chart Context
This weekly timeframe analysis of the Nasdaq-100 Index (NDX) forms a key pillar in our 2025 macro analysis series. Following the breakout structure seen in TOTAL, TOTAL2, BTC.D, and US10Y, this chart utilizes 2 Fibonacci tools (1 trend-based extensions and 1 retracement) to project potential corrective and expansion scenarios.
Fibonacci Tools Used:
Fibonacci Retracement : Applies to the recent smaller swing to determine micro retracement zones and cluster supports.
0=20674 and 100=10504
Trend-Based Fibonacci Extension: Drawn using a three-leg structure (point A= 3993 to B=16724 to C10504) to forecast upside targets beyond ATH.
All take-profit (TP) levels: TP1 (~23,400), TP2 (~26,700), and TP3 (~30,344.49)—are located at confluence zones where Fibonacci levels from different tools align, reinforcing their validity and strength.
There is a 4TP above all the Visible TPs
Key price references:
0% retracement: ~20,674.71
Next Resistance ~23,400 (confluence of extensions and psychological resistance)
Projected TPs:
1TP=~23,400,
2TP=~26,700,
3TP=~30,344.49,
4TP=44000
Support/Resistance:
Red zone: ~16,700–18,300 (historical S/R and correction target and Fib Confluences)
Resistance zone: ~23,000–23,400 ,
22000(ATH area)
Key Technical Observations:
Fibonacci Retracement from ~20674 to ~15732 marks the initial corrective range.
Trend-Based Extensions forecast:
TP1 (~23,400): First breakout resistance
TP2 (~26,700): Medium-term expansion zone
TP3 (~30,344): Long-term target if macro tailwinds persist
Scenario Pathways:
Bullish Continuation: Breaks above ATH to reach TP2/TP3
Healthy Correction: Pullback to ~20,600 or deeper ~18,300 before resumption
Deep Correction: Revisits ~16,700 zone if macro environment deteriorates
Fundamental Context:
Tech Stocks & Economic Sentiment: NDX is often the first to move during liquidity expansions. Its performance signals risk-on behavior across global equity markets.
Rate Cuts in 2025: With anticipated Fed rate cuts, tech stocks are primed for inflows. Forward earnings valuations rise, justifying extended upside in high-beta tech.
AI Boom & Earnings Growth: Nasdaq is heavily weighted toward AI, cloud, and semiconductors—sectors expected to lead earnings surprises.
NDX Influence on Gold and Crypto
When NDX rallies:
Crypto: Risk appetite improves. Capital rotation flows into altcoins and layer-1 assets.
Bitcoin: Often sees parallel inflows, especially during strong tech rallies (e.g., 2020).
TOTAL & TOTAL3: Begin breakout patterns if NDX continues to surge.
Gold: May stall or correct as investors favor risk assets. However, gold still holds due to macro hedging and real yield pressures.
When NDX corrects:
Crypto: Volatility spikes. Altcoins bleed faster.
Bitcoin: Short-term dip but may decouple if viewed as digital gold.
Gold: Benefits from flight-to-safety behavior.
US10Y: Often reacts inversely to NDX moves—used for confirmation.
Search Highlights (2024–2025):
Institutions view NDX correction as signal to rotate into commodities (incl. gold).
Cross-market correlations show NDX peaks often precede crypto mini-rallies.
De-risking from NDX often triggers gold strength, especially in geopolitical or inflationary backdrops.
Bias & Strategy Implication
Primary Bias: Bullish
Expecting upside continuation to 26,700–30,000 zone
Multiple correction opportunities are present even during rally
Strategic Actions:
Monitor for correction to yellow/red zones for accumulation
Use NDX behavior as leading macro signal for crypto rotations
Watch resistance at 23,400 closely; breakout confirms trend extension
Time Horizon
Short-Term (1–2 months): Watch for breakout or correction to ~20,600–18,300
Mid-Term (3–6 months): Probable test of ~26,700
Long-Term (6–12 months): Potential expansion to ~30,344.49
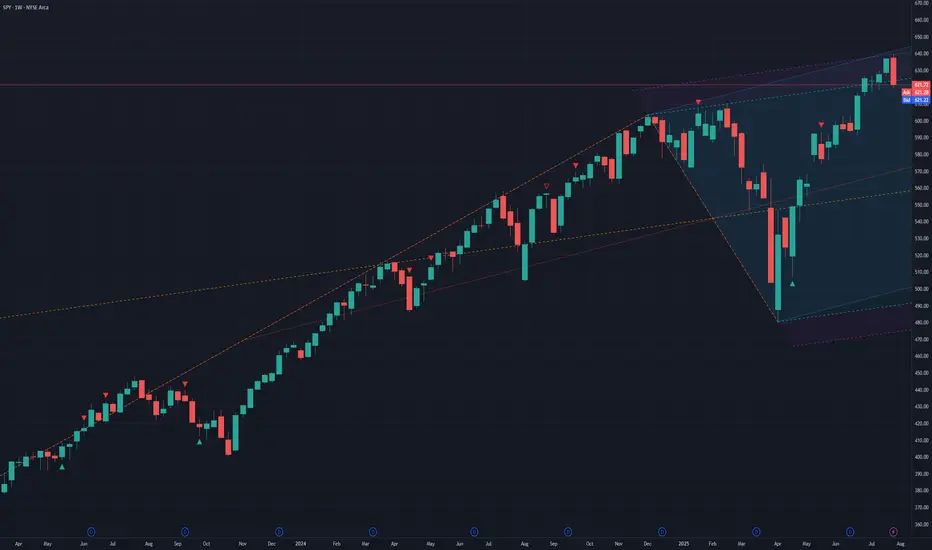
S&P is Shaping a Bull Flag While Awaiting the FED DecisionLast week was characterized by increasing selling pressure that hindered upward price progression but failed to trigger any substantial pullback. The market has not even retested the previous consolidation zone ( 598-601 ), which highlights the weakness of the sellers.
Looking at the daily chart, the recent price action resembles a bull flag, favoring a continuation of the upward trend. For sellers to demonstrate their strength, they must not only break this pattern to the downside but also breach the 598 support level and drive the price further down to 594 .
Much will depend on the Federal Reserve's interest rate decision this week, alongside the release of key economic data. The most favorable outcome for the bulls would be a 0.25% rate cut. Any other scenario could spark concerns—either about an impending recession (if the cut is larger) or about a prolonged high-interest-rate environment (if the cut is absent).
The market outlook remains bullish; however, the current price level is not ideal for new long positions. Buyers would be better served by waiting for a more meaningful pullback (e.g., to the 600 level), provided it is not driven by a negative shift in economic sentiment.
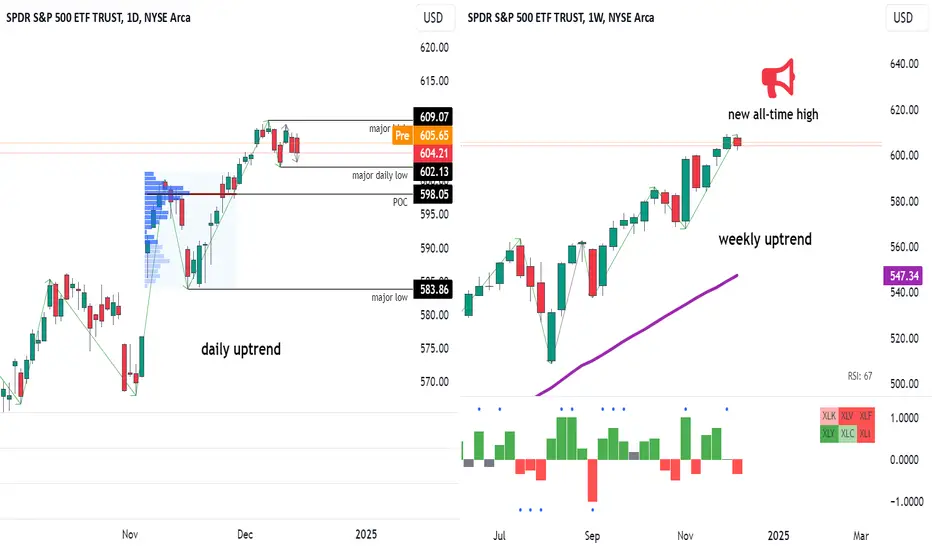
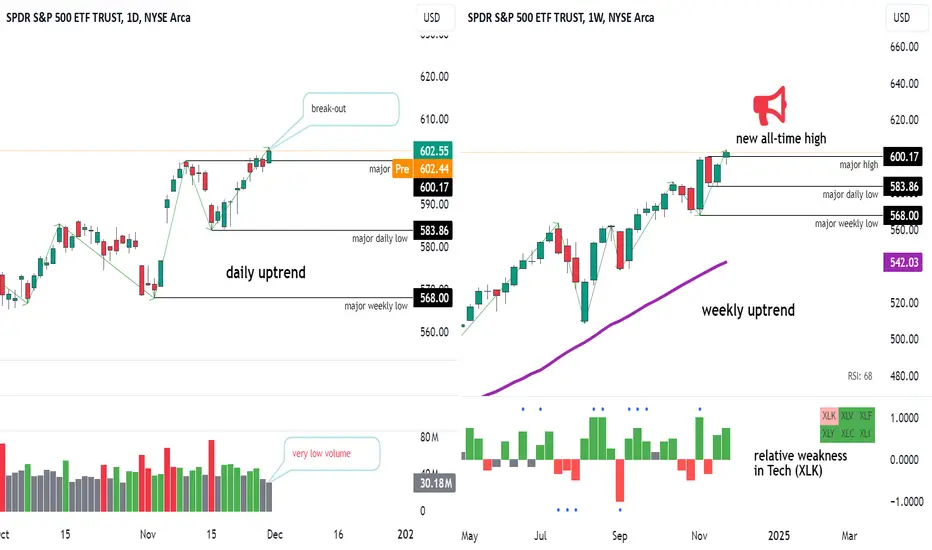
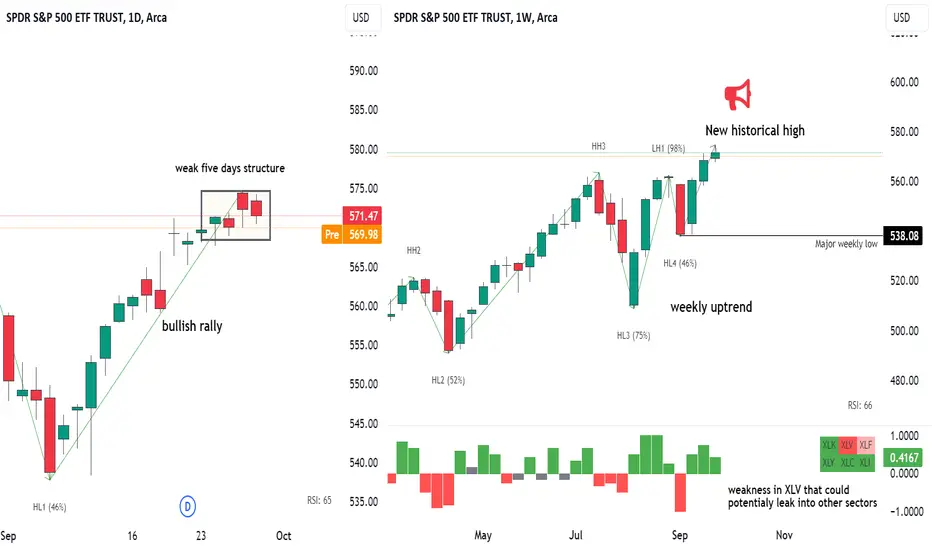
S&P: Weekly Recap and OutlookLast week, the market opened with a gap up that was quickly filled, after which price hovered near the previous all-time high. Bolstered by new economic data, which delivered no negative surprises, bulls pushed the price out of the trading range, establishing a new all-time high.
While this is undoubtedly a positive development that reinforces the bullish thesis, a few warning signs warrant closer attention:
1. Low Breakout Volume: The breakout occurred on significantly low volume. While volume is less critical in indices and ETFs compared to individual stocks, observing below-average volume during such an important event raises concerns about the breakout’s sustainability.
2. Relative Weakness in the Tech Sector (XLK): This deviation signals hesitancy among growth investors, which could potentially ripple through to other market participants.
Additionally, concerns highlighted in my previous review remain unresolved and continue to be relevant.
At this stage, there is no concrete evidence of a sentiment shift or technical signals pointing to a broad trend reversal. However, there is a growing impression that the rally may be nearing temporary exhaustion, which could lead to a significant pullback.
Key Focus for the Upcoming Week
Investors will be closely watching the employment data, which has already hinted at labor market weakness. If new data further support this trend, it could heighten bearish sentiment.
Price action this week will likely provide important clues:
• Bullish Confirmation: If the breakout is followed by a swift continuation, this will confirm buyers’ conviction and overall market strength.
• Bearish Signals: Conversely, if the price pulls back below 600 or oscillates indecisively around this level, it may signal uncertainty among buyers, creating an opportunity for short sellers to capitalize.
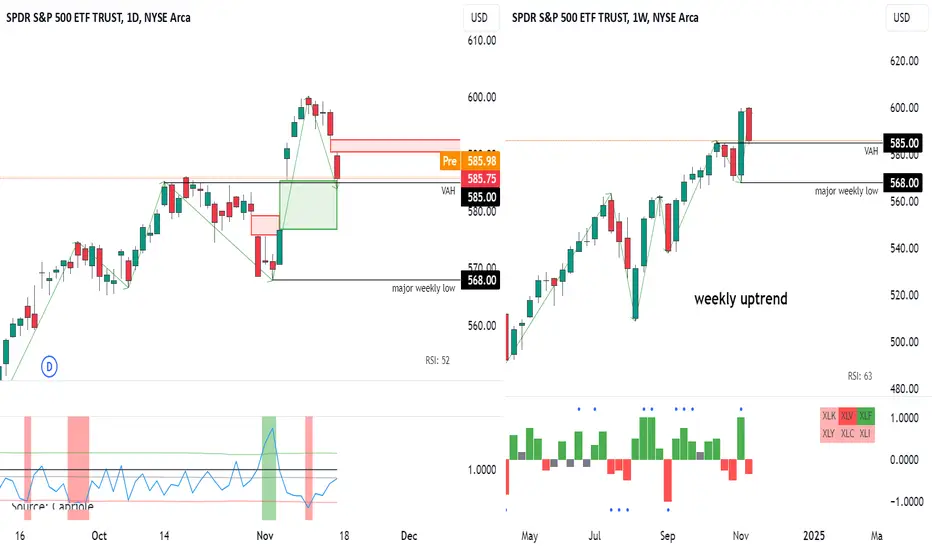
S&P 500 Weekly Recap: A Struggle to RecoverLast week’s market action reflected the ongoing struggle for recovery after the previous week’s sell-off. The market opened cautiously, with buyers stepping in to regain ground lost during the prior downturn. Despite early hesitation, bulls managed to push prices higher, eventually filling the gap created by the earlier sell-off. However, this recovery faced significant resistance from sellers, resulting in minimal upward progression in daily closes.
Strength in the recovery was primarily driven by Financials (XLF), which set a new all-time high. Other sectors, however, remained subdued, aligning with the broader market's hesitant tone. While this selectivity isn’t necessarily negative on its own, when combined with other signals, it may indicate growing risk aversion and a lack of conviction among market participants.
It is also worth zooming into the lower timeframes.
The 584 level provided key support but was retested multiple times during the week, which is not a good sign for buyers. Persistent tests of support typically indicate weakening demand, and bulls should be cautious of this development. Additionally, it was remarkable to observe how the rally went precisely to the Value Area Low ( 596 ) of the previous consolidation zone. Buyers should note that the market failed to push higher and close within the value area, signaling potential exhaustion of the current recovery attempt.
The immediate objective for the bulls is to push above 596 , reclaiming the previous value area, which would provide stronger validation for the recovery. On the other hand, bears will be focused on taking down the 584 level, where there is likely big liquidity pool.
Next week is rich in terms of key events.
The FOMC minutes are scheduled for release on Tuesday, preceded by significant economic data on Wednesday. These releases will be closely scrutinized as investors remain deeply concerned about the possibility of a recession. Any signals pointing toward a slowing economy could spark fear and trigger increased volatility.
While the long-term market trend remains intact, the warning signs outlined above suggest that investors should hold off on adding to their positions for the time being.
P.S. ES futures are currently rising in the pre-market session. If this momentum doesn't transform into a sell-off after the bell, it will certainly be a positive sign for the buyers.

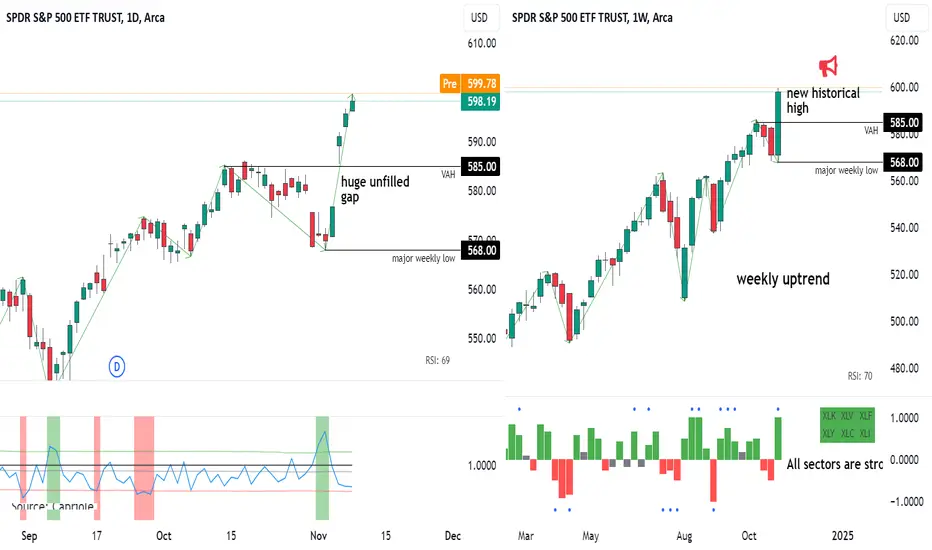
S&P Weekly Recap: Rally Falters Amid Lack of ConvictionLast week’s market action delivered a reversal in sentiment, highlighting the fragility of the rally that had persisted since the so-called "Trump rally." The week began slowly, with the market testing buyers’ conviction to push prices higher. After confirming a lack of such conviction, sellers stepped in, driving prices sharply lower. As suggested in my previous recap, 585 (VAH) provided temporary support, and the week closed near this critical level.
Interestingly, most major sectors participated in the downward move, aligning with the broader market trend. However, XLF (Financials) stood out as the exception, managing to post gains despite the sell-off. This divergence suggests that there is still buying interest, with money continuing to flow selectively into the market.
The immediate objective for the bulls is to hold 585 and attempt to fill Friday’s gap. Failure to do so, with the price returning to the 568-585 range , would indicate that the rally is nearing exhaustion. While this would not immediately signal a transition into a bear market, it would mark a notable shift in sentiment. The 568 level remains critical for buyers; as long as it holds, the broader uptrend stays intact, and bulls maintain the upper hand. Meaning that I keep "bullish" outlook.
This week, the market’s attention will be on NVIDIA's earnings on Wednesday. While the previous report didn’t cause much volatility, traders will be closely watching for any surprises that could influence market momentum.
S&P Soars on Election Results in a Stunning RallyLast week's market movements provided a strong example of how impactful certain events can be on sentiment and momentum. In the last market recap, I highlighted uptrend continuation as the most likely scenario. However, at the start of the week, there was absolutely nothing on the chart suggesting a V-shape pivot.
Week started on a weak note, but Tuesday marked a shift, as buying interest began to surface, quickly escalating into a stunning overnight gap once preliminary election results emerged. Essentially, the election results had a similar impact on the market as an earnings report can have on a company's stock price. This influx of optimism solidified bulls' control over the market, reinforcing a strong weekly uptrend.
The buying wasn’t limited to a few sectors; instead, it was widespread, touching every major sector by the week’s end. Such broad-based buying underscores that the rally is not sector-specific but part of a larger, systemic movement. While we’re seeing robust upward momentum, it’s worth noting that both weekly and daily RSI levels are approaching overbought territory. However, as often observed in strong uptrends, prices can comfortably persist in the overbought zone. With no clear resistance above, I would strongly discourage trying to catch the top.
Important levels to watch include 585 (VAH) , which is key in the event of a potential retest of the last consolidation zone, and 568 (major weekly low) , which buyers must protect to maintain control.
P.S. If you missed this insane rally, don’t blame yourself too much. Had the election outcome been different, it’s easy to imagine the market would have plunged just as dramatically. So holding short-term position was similar to trading company earnings, which is, in a way, a form of gambling.
S&P Weekly RecapLast week saw significant moves in the S&P 500 , with Thursday’s open revealing a sharp gap down that quickly intensified into a strong sell-off. This correction unfolded despite strong earnings from “Big Tech” and was likely driven by weakness in key economic indicators, such as GDP growth and Non-Farm Payrolls, combined with uncertainty surrounding the upcoming U.S. elections. Still, the broader weekly uptrend remains intact for now, as long as the index holds above key levels.
One area to watch closely is the 566.6 support, which has been tested by recent volatility. There’s no guarantee that this level will hold if selling pressure continues, so it’s a crucial line to monitor. That said, the general uptrend is considered safe above 538 , which is the major weekly low. Another significant level to watch is 561.5 , the Value Area High (VAH) of the recent weekly consolidation zone.
An interesting signal was the elevated call/put ratio on Friday. This uptick suggests that, despite the sell-off, bullish sentiment remains alive, with many viewing the dip as an opportunity. The continued strength of the XLC sector further reflects this optimism, as it managed to hold firm even through the broader index’s pullback.
Considering all the above, the long-term market outlook remains bullish. Key levels to watch in the coming days are 566.6 for immediate support, 561.5 as an important pivot point, and the weekly major low at 538 .
Next week is packed with high-impact events, including the U.S. elections and the Federal Reserve’s interest rate decision . Both are likely to drive heightened volatility and could serve as key catalysts for market direction.

S&P uptrend continues as the market cheers strong earningsLast week, the bulls finally gained the conviction needed for a breakout. Fueled by strong banking earnings, the market has moved upward from its trading range, reaffirming the long-standing uptrend.
Both the short- and long-term outlooks remain bullish. More earnings reports are set to be released next week, but unless there are significant surprises, nothing is expected to change.
S&P bulls maintain control but no initiative yetLast week was characterized by controlled selling, with prices drifting down slowly as the market awaited the unemployment data released on Friday. As we can see on the daily chart, sellers were unable to close the day below the previous day's low, even after a significant sell-off on Tuesday. Once the unemployment data was published, alleviating concerns about a potential recession, the bulls regained control, and the week closed on a positive note.
The next key objective for buyers is to break through the resistance around 574.7 . Given that this level has been retested multiple times, it's unlikely to hold. However, we still need to closely monitor the price's reaction to this level and observe what happens immediately after the breakout.
The long-term outlook remains bullish. In the short term, there is still a high possibility that prices will continue consolidating within the 565–575 range , as the market remains influenced by political uncertainty in the U.S.

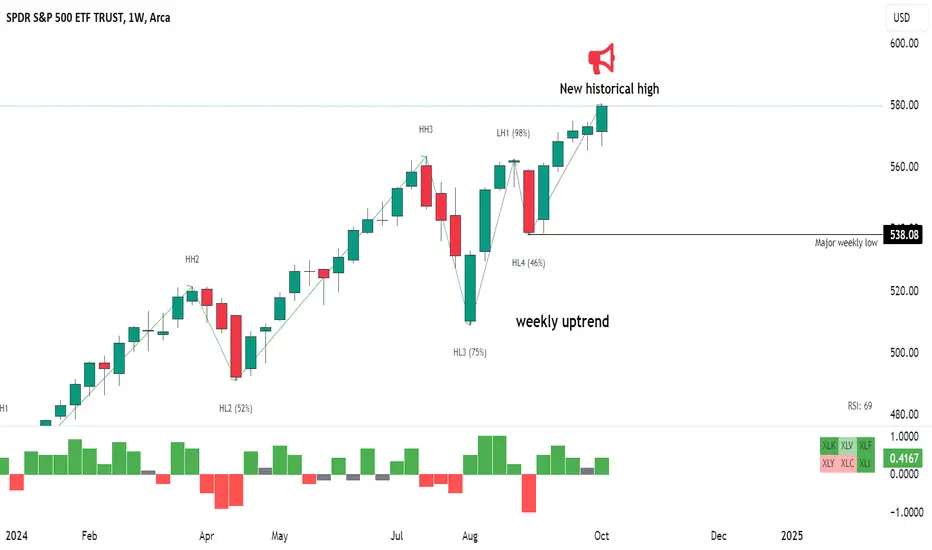
S&P sets new high but weakness is mountingLast week, the market traded within a narrow range, yet still managed to reach new highs. The bulls remain in control of both the daily and weekly timeframes, although I’m not entirely comfortable with the structure that has developed over the past five days. Most of the growth occurred during extended hours, while during regular trading hours, the market either remained in a tight range or moved downward. This structure is fragile and could easily break, though I’m not ready to call for shorts just yet.
Firstly, it hasn’t broken. We're still in a bullish wave on the daily timeframe — in the past two weeks, none of the days have closed below the previous day's low. Secondly, even if the structure breaks, we should not expect significant follow-through, as the market remains very bullish.
Here's a quick recap of the key points supporting the bullish thesis (you can find the rest in my previous review):
1. The Fed cut interest rates by 0.5 percentage points, which is positive for both the economy and the stock market for several reasons, such as cheaper borrowing costs.
2. The SPX has reached a new all-time high, which is highly bullish.
3. Both the weekly and daily charts show a strong uptrend.
For the market to reverse, there would need to be a significant shift in sentiment, likely triggered by some fundamental event. From a technical standpoint, the uptrend remains intact as long as the bulls hold the previous major low ( 538 ). Until then, any "red" waves should be viewed as mere pullbacks within the broader upward movement.
The S&P rally continues, defying all fears of a recessionLast week was marked by erratic price movements, leading many to recall the old adage, "no trade might be your best trade." The most confusing (and devastating) price action occurred on Thursday following the FOMC's interest rate decision. The Fed cut rates by 0.5 percentage points, sparking fears of an upcoming recession. Wednesday ended with a strong bearish "falling star" candle, tempting traders to take large SHORT positions. To be honest, I would have likely done the same if I had been trading that day (luckily, I wasn’t), as the least one would have expected was an overnight rally that wiped out short positions when the market opened on Thursday.
This series of events is a perfect example of what makes trading so challenging— even a solid setup can fail spectacularly without any clear reason.
Now, let's try to assess the current situation :
1. The Fed cut rates by 0.5 percentage points – This is actually positive for the economy and the stock market for many reasons (e.g. cheaper borrowing costs). At the same time there are no objective signs of a recession, only fears.
2. The SPX reached a new all-time high – How can this be bearish?
3. Both weekly and daily charts show a strong uptrend.
4. Almost all major SPX sectors closed the week strong, reflecting investor confidence.
In summary, the market remains very bullish , with no indication that the trend is reversing anytime soon. Short term price action might be erratic, but long-term things look good both from technical and fundamental perspectives.
Let’s stay calm and prudent.
Important levels:
Last major weekly high (538). As long as it holds buyers have control over weekly chart.

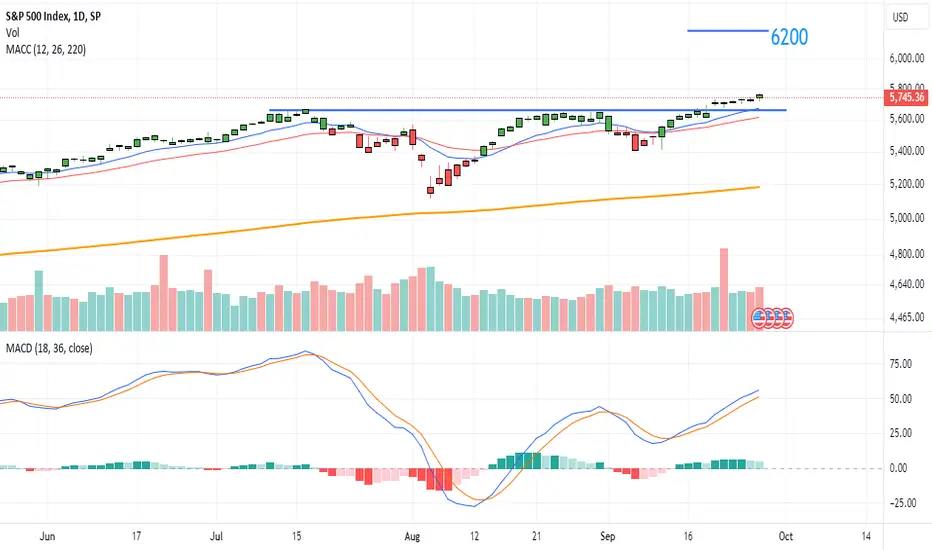
[S&P 500] Cup & Handle pattern is completeSP:SPX has completed its cup & handle pattern. The price target would be 6200, let see if it could find the needed fuel.
Stop loss is simple: at the breakout line.
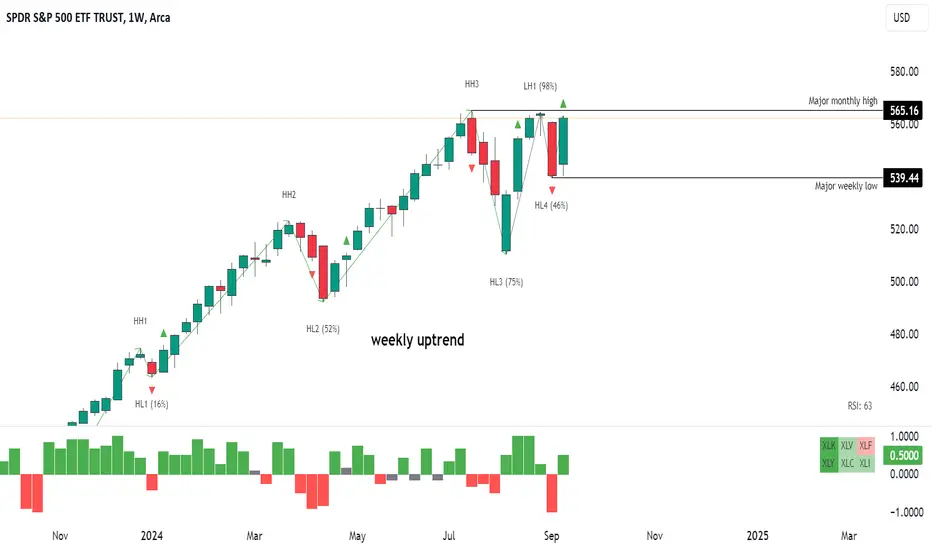
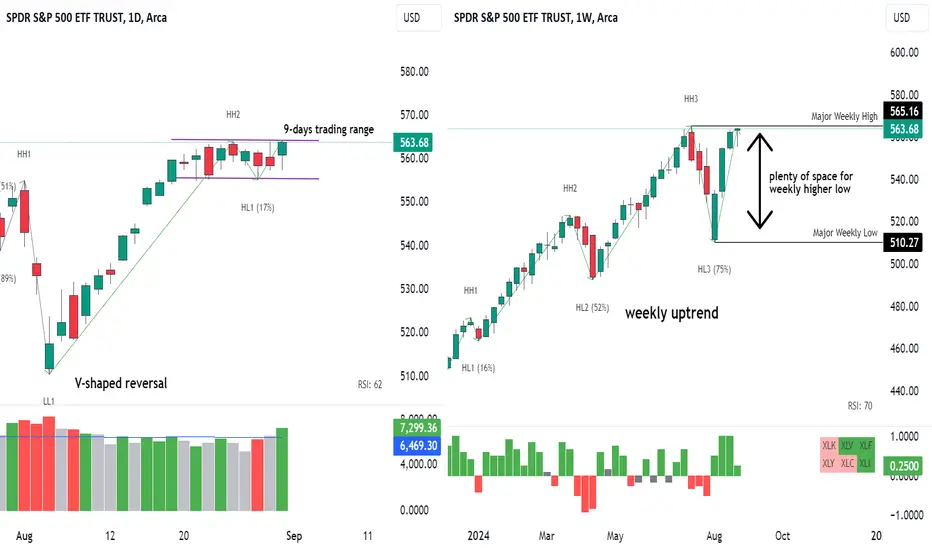
S&P bulls regain control, aiming for the new highAfter the major sell-off in the first week of September, the market has made a U-turn, rebounding to its previous highs. This outcome was anticipated as highly likely in my last review, though, as is often the case, the market exceeded boldest expectations.
Currently, we have confirmed a weekly higher low, which provides a solid foundation for the continuation of the uptrend. It’s also worth noting that the rally is being driven by risk-on assets like XLK and XLY, reflecting growing investor confidence.
The mid- and long-term outlook remains bullish, though heightened volatility is expected as we approach the US elections.
Important levels:
539.4 - major weekly low. Bulls must protect this level to keep uptrend intact
565.2 – major monthly high. There might be some resistance at this level. Bulls must clear it for uptrend continuation.
FOMC meeting is set for Wednesday but it is not expected to bring big surprises.
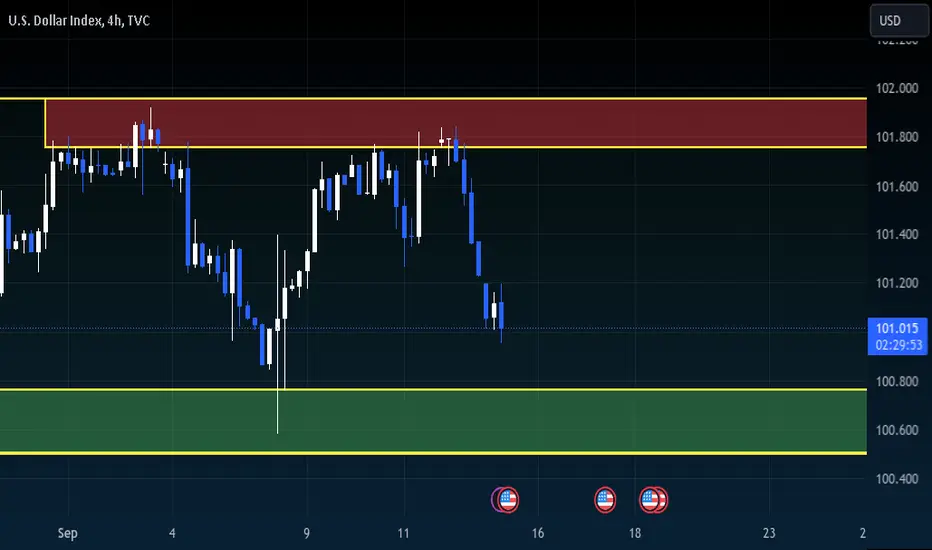
US DOLLAR - Boxed RangeUS DOLLAR is trading SUPPORT and RESISTANCE zones within a boxed RANGE.
It is respecting a range of 100.53 - 101.93, with respective bounces on either end, keeping it within its BOXED RANGE.
When I'm speaking about a BOXED RANGE, what I mean is that the RANGE ISN'T TIGHT like a normal range, where its looking for volume before a big move, these types of ranges have volume and are easier to read as they respect KEY ZONES, for example right now they are respecting 100.53 - 101.93.
We should wait for the US DOLLAR to enter either SUPPORT or RESISTANCE to enter a trade, we can wait for a rejection + bounce or wait for a breakout.
If the US DOLLAR breaks to the downside (BEARISH) I would expect for the overall US markets to continue it's BULLISH movements, as usually the US MARKET IS INVERSELY PROPORTIONAL TO THE US DOLLAR INDEX...
Conversely if it shows BULLISH signs and begins to move towards the SUPPORT ZONE, I will be looking for the US MARKET to move BEARISH.
S&P recovers; bulls maintain long-term controlThe last week of August was sluggish, despite several exciting events. First, NVDA’s earnings, although very strong, failed to boost the market beyond its daily trading range. The GDP and inflation data (positive) released later also didn’t provide sufficient momentum, and the market continued to bracket. The week closed at the high, but buyers didn’t manage to break out of the trading range and confirm control of the daily timeframe. We can conclude that the market has reached a temporary balance—both bulls and bears seem content with the current price and lack the conviction to initiate strong moves.
Zooming out to the monthly view, August closed green, near the historical high. The long lower wick signifies a bullish rally that brought the price up from the low, indicating the strength and conviction of the bulls. Although the bulls didn’t manage to achieve a new high, they still maintain long-term control.
Overall, the market is still in a monthly and weekly uptrend. Even if sellers manage to set a weekly lower high in September, it is unlikely to mark the start of a trend reversal. Buyers have created enough space for potential weekly consolidation that will not threaten their long-term control.
Important levels:
Last major weekly trend high (565). If buyers manage to move above and hold they will confirm continuation of monthly uptrend.
Last major weekly trend low (510). Buyers must protect this level if they want to keep long term control
Short Term Trading range (555-564). Breaking out from the range in either direction will mark gaining of a short-term control.
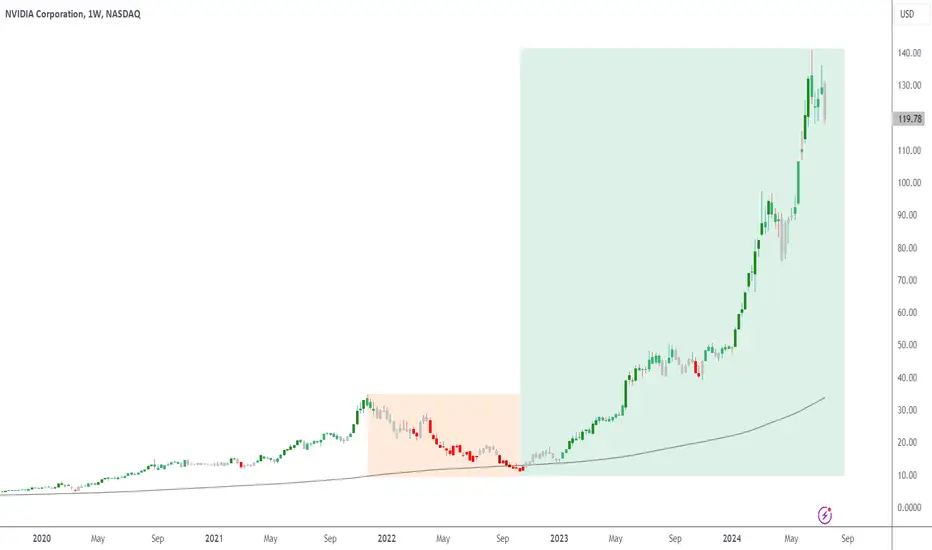
Nvidia Climbs 155% While Facing AI Ethical CriticismNvidia remains a significant player in the AI industry, grouped with companies like Apple and Anthropic, which have been criticized for training their AI technologies by extracting subtitles from 173,536 YouTube videos across over 48,000 channels, including content from notable creators such as MrBeast and PewDiePie. This practice violates YouTube's terms by using content without creator consent, posing legal and ethical issues.
Financially, Nvidia's stock experienced a substantial 86% rise from mid-April to June, followed by a stabilization period with prices oscillating between $117 and $140. Despite this slowdown, the company's year-to-date growth is impressive at 155%, with a potential for stock values to climb past $150 if demand for AI continues to surge.
The ongoing ethical debate around AI data usage underscores the importance of regulatory compliance and maintaining trust in the tech industry's use of content. This dialogue is crucial for shaping future AI governance.
HERE´S HOW YOU OUTPERFORM THE S&P500S&P 500 Index
4Hour Timeframe
RSI
Moving Average
Elliot Waves
Overall Summary
Hello and welcome back everybody!
I hope you are doing good at today's monthly close!
We are watching a 13$ S&P500 gain this month, which is absolutely crazy! Gains were possible, though the cliff to the downside looks scary as hell. Mixed feelings everywhere, uncertainty, fear but kind of hope- very ambivalent mental condition everywhere.
Since 22% of the whole SP500 Index is divided into the six FAANG companies (Facebook, Amazon, Apple, Netflix, Google(Alphabet)) and Microsoft, these are the drivers of the US markets right now.
Oil, as well as touristic, hotel, and accommodation markets took big hits, while a few made gains, which has led to the recent bull market/recovery from all-time high/coronadump.
Well, today I´d like to show you something I just have read about recently, it is the Elliot Wave counting technique. As you guys know, I do not give too much about technical analysis systems and techniques, but it is worth trying out and see why they have become such popular.
As you can see, in the ABC-Correction, which is part of the wave counting, the number A marks the all-time high, number B marks the bounce, and C marks the very last low the SPX at 2190.
As you already noticed, the price is coming near the 200MA (Moving Average of the past 200 candles). Historically the top has been a little lower of it, but a few times it actually broke it for a short period of time, after which a massive decline/selloff followed.
RSI looking good, not oversold, but testing the market strength of all-time high. So the market is strong basically, even though volume declines since the bull market started. Spikes here and there happen, but nothing which delivers serious information about it respectively to make predictions out of it.
What does it mean for us?
1. The top might have been reached already, though tonight after market close Apple and Amazon gonna present their earnings, which possibly leads to a temporary boost of the market while looking at the monthly close and the end of the reporting season! :)
At that point, when the bull market of the last month started, we set our first wave up to the number 1, which continues to 5.
We do not know how high 5 will be nor if we already hit the "fifth Wave". Afterward, in most cases, people count ABC and call that an ABC-Correction - whatever it is. You know, in technical analysis, if you wanna fit something to a chart, you fit it. Since lines, shapes, and whatever seem to be fit perfectly, in most it is not. So look at them, but do not trust them too much.
Furthermore, Elliot waves and other techniques are instruments, to describe what happened and make predictions out of it. Nobody can tell the future, nobody knows what is gonna happen in the coming days, weeks, and months.
Personally I am bearish since Q1 might have been "still ok" when talking about earnings, even though many took big losses, but I think upcoming reporting seasons of Q2 and Q3 will be a devastating disaster.
That is it already for today, hope it brightened up your view on the market :-)
Keep you, safe guys, make sure to wash hands and whatever, you know what you gotta do! Be careful with your funds and I´d like to know what do you think?
Will we see a bearish Q2 and Q3 or did the new bull market of the decade already kick in? Just tell me in the comment section!! If the content pleased you, make sure to hit the like button or leave a follow, would help a lot!
Best, Roman

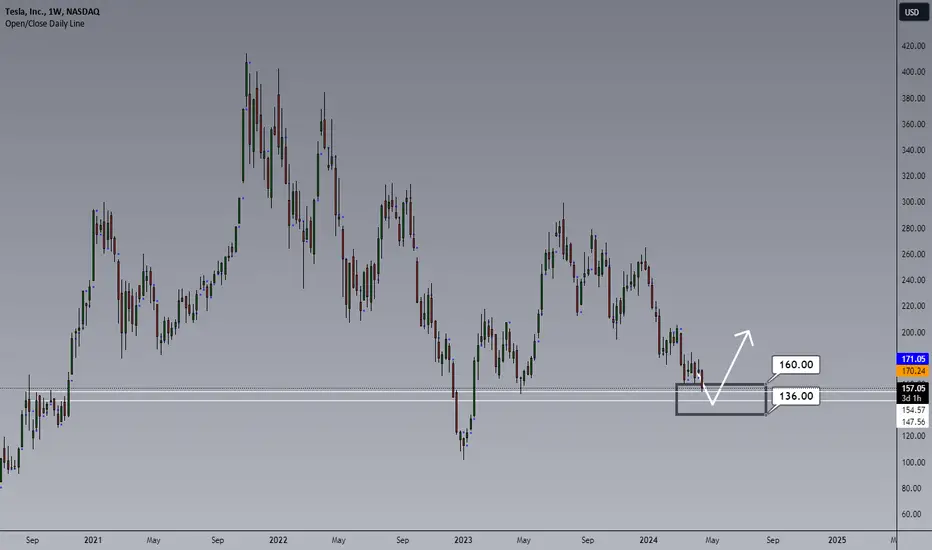
Tesla (TSLA) | Arrived To The Destination - Lezzz See!?Hi,
The box marks the spot :)
For me, it is the strong area that I've been waiting for and now let the market decide is it a strong enough?!
Good luck,
Vaido
S&P bears attack, bulls still holdLast week was marked by the aggressiveness of sellers and the resilience of buyers. On Monday Buyers were ideally positioned for another break out but they didn’t have enough steam to accomplish it. Sellers, long awaiting their opportunity, pushed the price down, breaking the weekly support. However, they couldn’t develop this into something more significant, as the bulls returned with a firm "no". The rest of the week continued in the same tug-of-war fashion.
The most confusing days were Thursday and Friday. Thursday started very bullish but ended with a dramatic bearish turn. Friday, expected to be bearish, unfolded under the bulls' control.
This was a story. Now, let’s now review all the signals more formally:
Bearish Signals
• Confirmed downtrend on the daily chart, indicated by a lower high and lower low.
• Weekly consolidation has begun.
Bullish Signals
• The week closed right at the previous week's low after price shaped hourly higher low
• Friday’s value zone is within the value zone of the previous four days.
The context remains very bullish – price is in a strong weekly uptrend, last month closed very strong. Overall, it is a very ambiguous case with neither side having a clear advantage. Buyers are exhausted, yet not willing to capitulate. Bears are attempting to play their game but lack sufficient strength.
The short-term outlook is neutral. From this position market can go in any direction. We need additional signs of one side gaining an upper hand. Until then, it is not advisable to place big bets on either side.
Wednesday is a very important day, with both the release of inflation data and the FOMC meeting
Disclaimer
I don't give trading or investing advice, just sharing my thoughts.
