Usmarkets
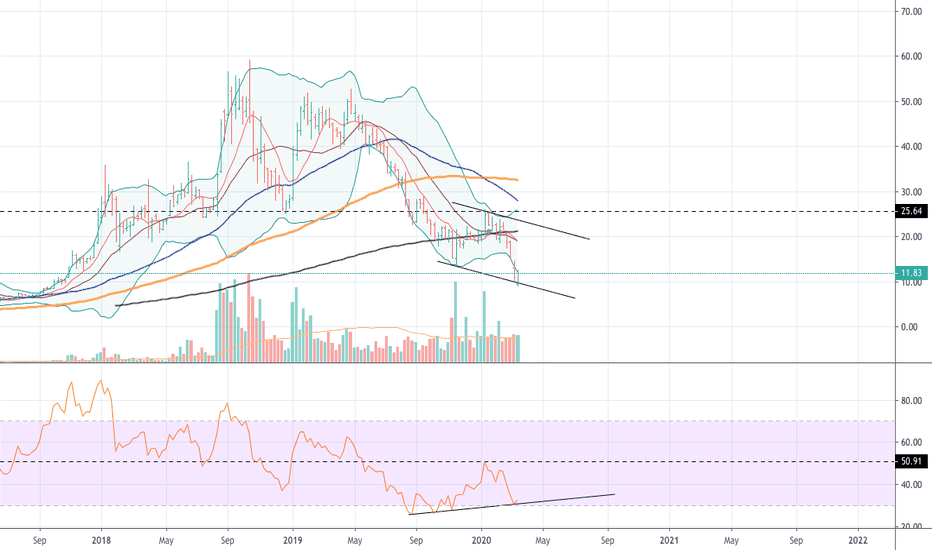
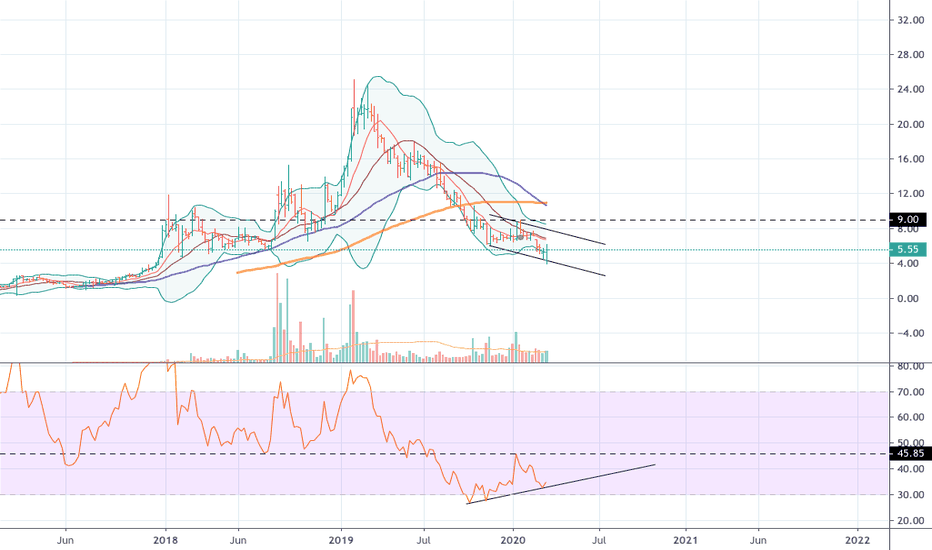
Canopy Growth Corporation $CGCdouble bottom and positive divergence for $CGC. Watch for break out of $25.64
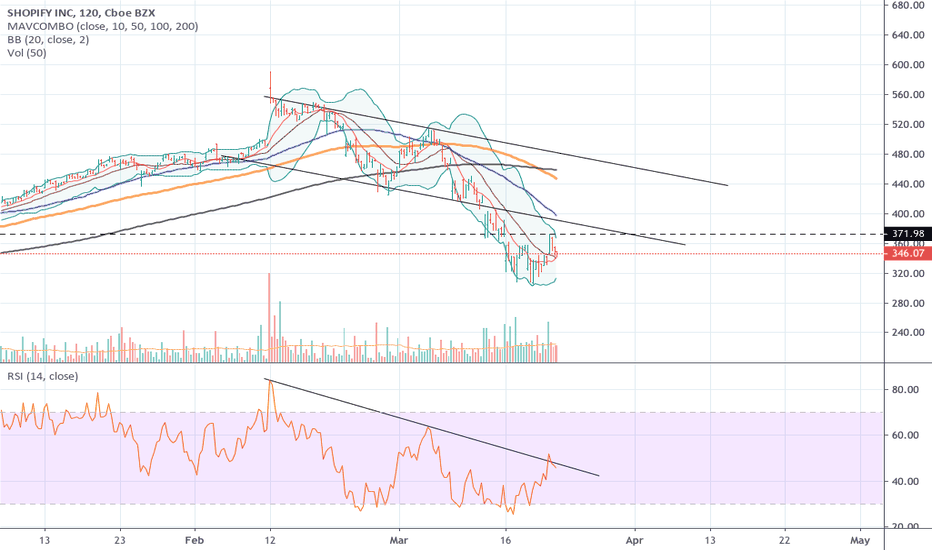
"SHOPFIY" is rounding back?It needs to get in the channel before to be trusty. $371.98 is first resistance to overcome and watch for rsi break out as well
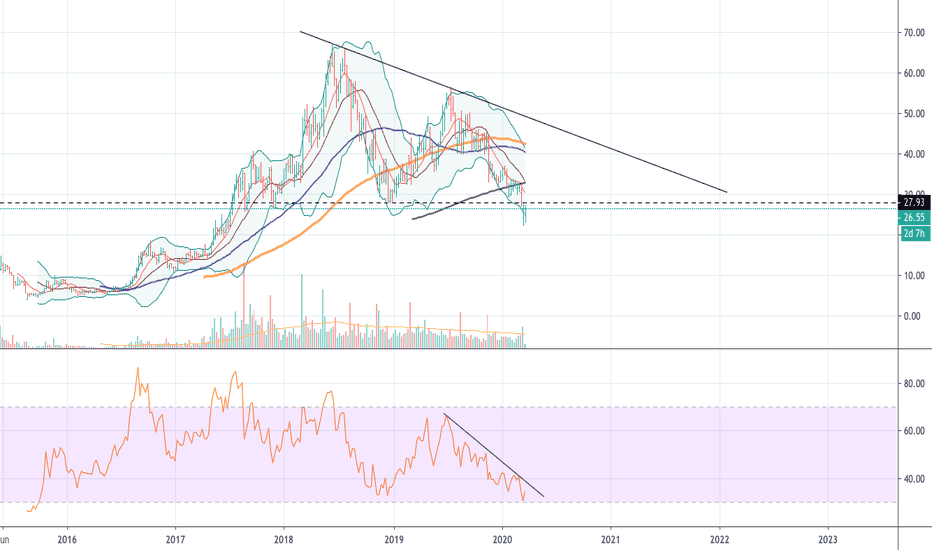
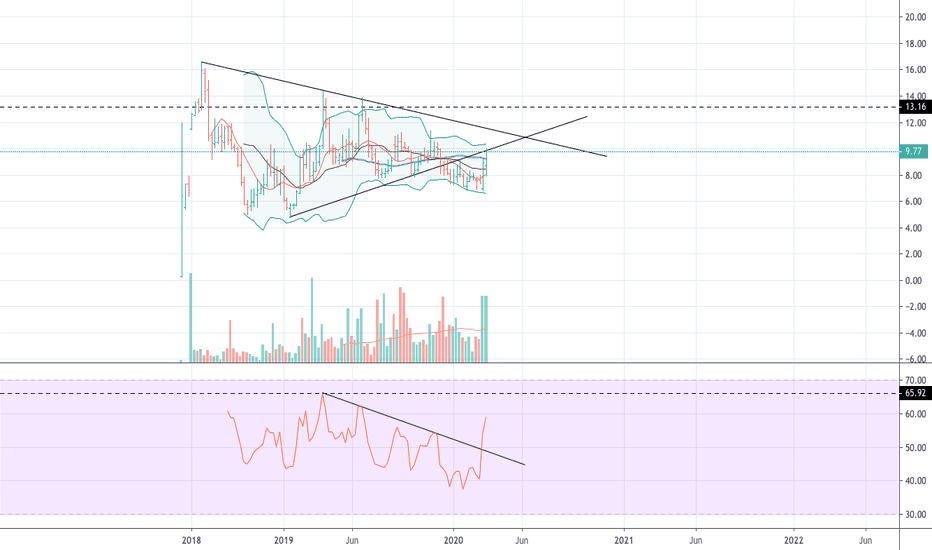
"Translate Bio is heading up"It hit the trend resistance, rsi broke the trend though. This stock would be healthy after it broke $13. However, weekly volume is well above average for two weeks.
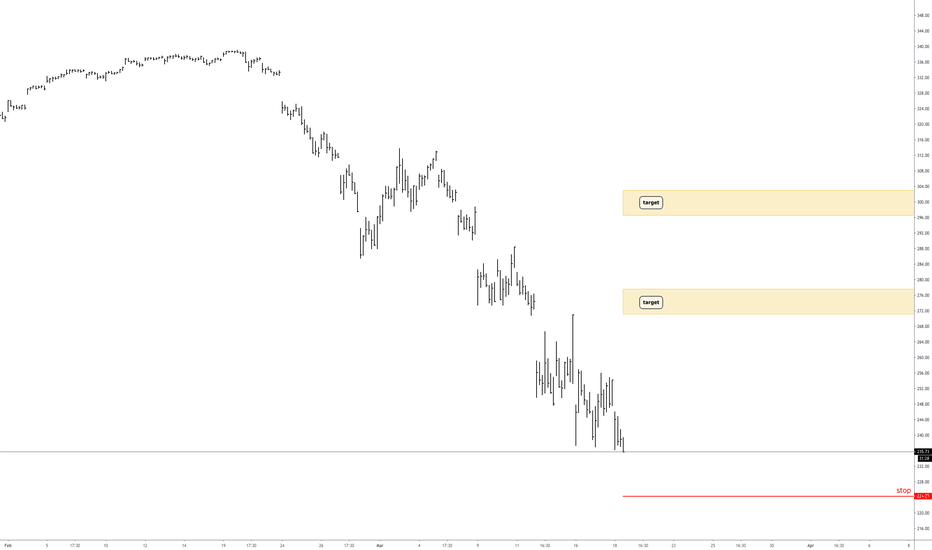
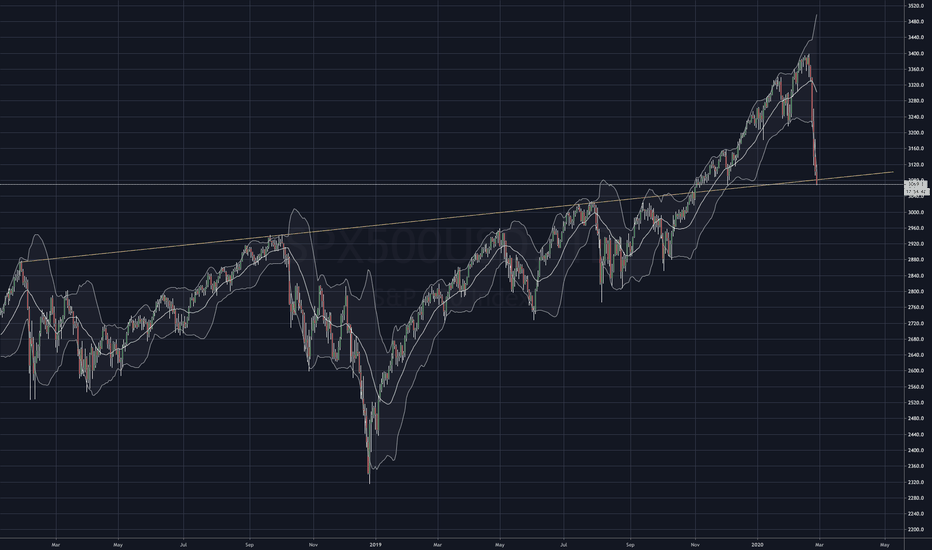
SPX Long IdeaJust a trading idea, not trading advice.
Quit the shock of a move over a little bit of virus fear that will almost certainly soon blow over.
Not even 100,000 recorded patients infected to date, with a world population of over 7,700,000,000.
Some predict further, some predict recession, some predict the end of the world.
At least in the short term, I predict a dip that is about to reverse.
Let's see where it goes shall we?
Opinions?
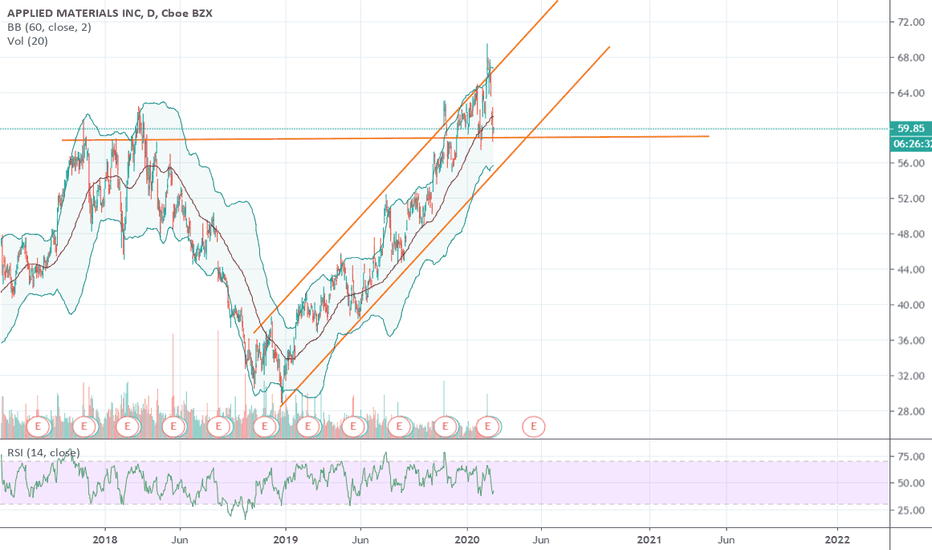
Applied Materials: watching behaviour in the resistence lineAfter the little downtrend from the last days I see a possible entry possition in this stock.
But, I will wait a little bit in order to see how it will bahve in the resistence line.
What do I mean?
If the RSI and Stochastic revert it might indicate that the trend is changing and the price will increase.
Besides, the stock is trading quite below the moving average from the bollinger band (important).
It is also worth to mention that the stock have had performed quite well during 2019 showing a bullish trend (which has been shown with the orange lines).
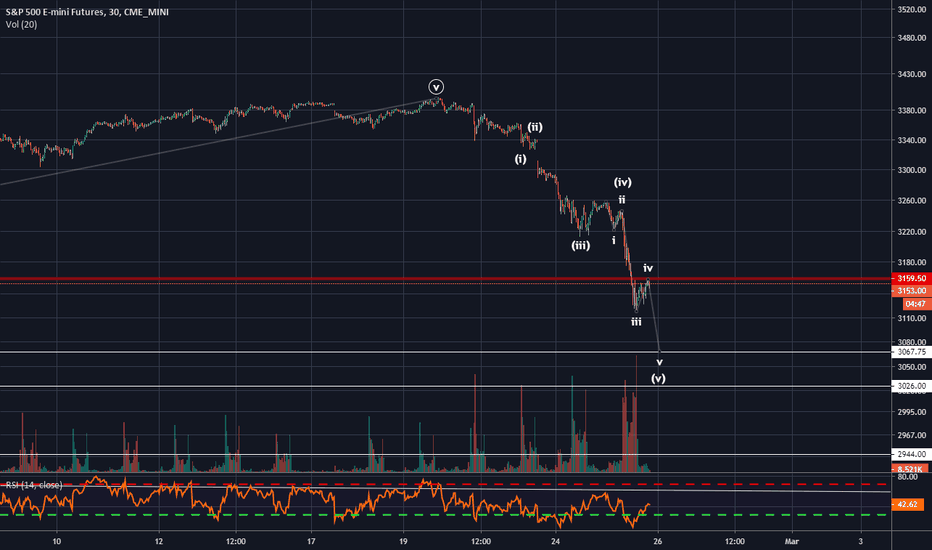
Full Bear ModeI honestly thought we'd get a better pullback than we did last night in the futures. Obviously that didn't play out and right when I went to bed, the futures started selling off.
Now...I'm an Elliott wave trader by trade, so I use that lens to view the technical aspects of charts.
What I can see here is that we may be looking at another bloody day tomorrow (02/26), however we need to keep an eye on the open tomorrow. IF we get some sustained buying tomorrow, it will indicate that we're in for a larger pullback up to ~3250. IF we continue to have selling tomorrow, I would target that next support line for a buying entry.
Know that we will probably get a large pullback up eventually, whether that is tomorrow or the next day. It's a bit hard to time with all of the mania around the virus going on.
Honestly right now I'm focusing on gold and silver, and some good tech plays for long term calls as these prices go down.
Good Luck My Friends!
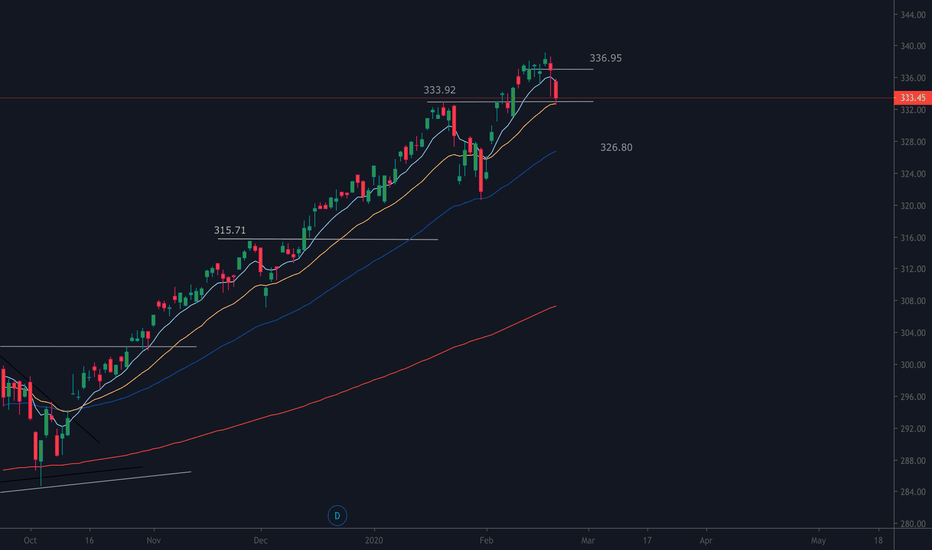
$SPY Weekly Outlook Feb 24 2020Futures are pointing towards a lower Monday open, 333.92 is key pivot point, if we can push above this area in pre trading or at market open longs could be profitable on the day. the 21 day ema as seen on chart is also key, a break of this could provide more downside to the 50 day ema 326.80.
I will update during the week...
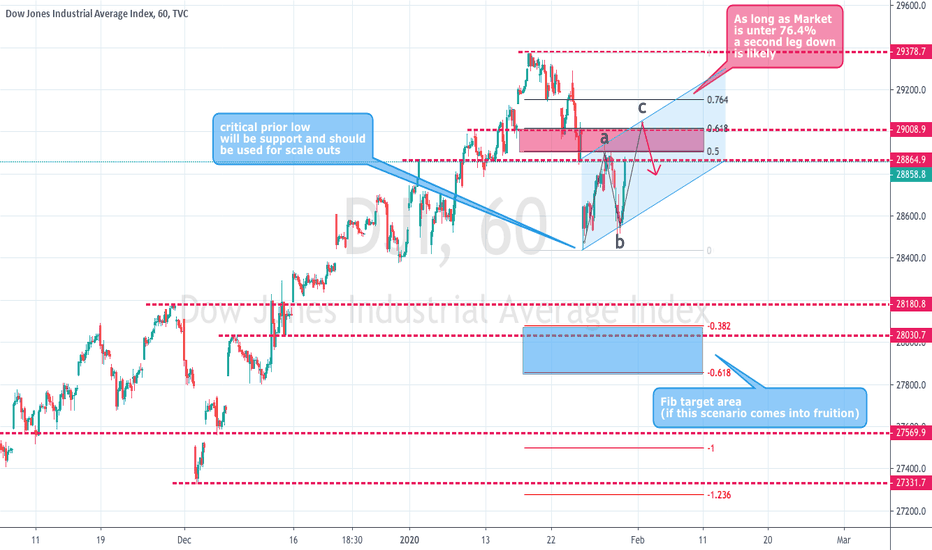
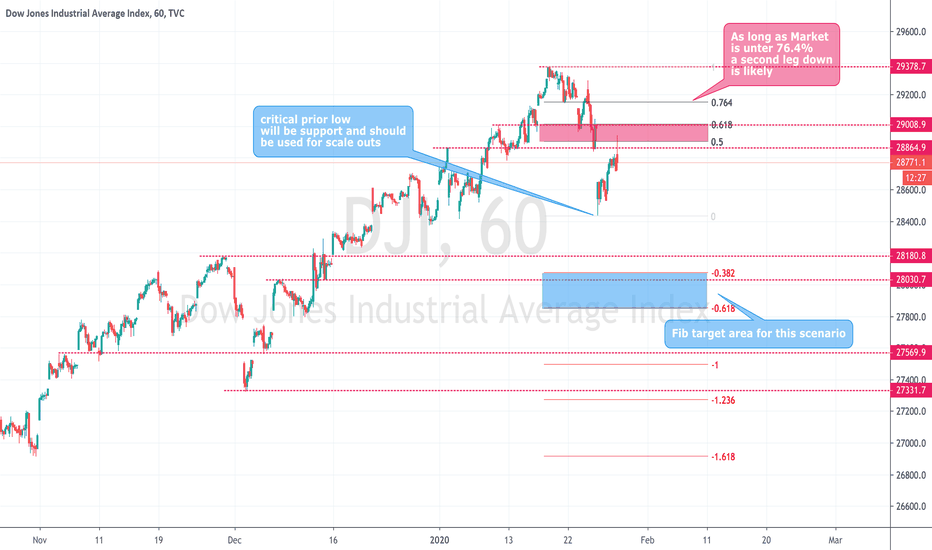
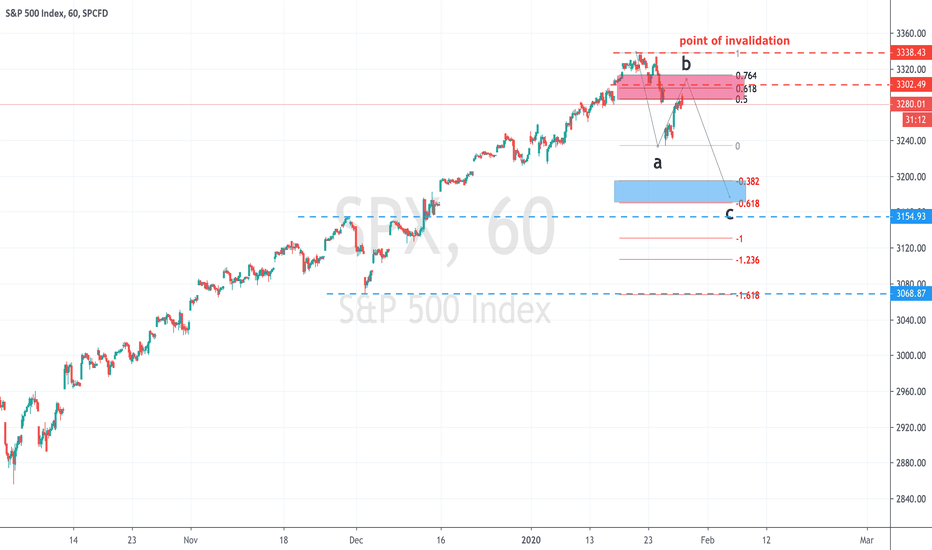
Dow Jones 1H -> Turnaround already or just corrective ABC?Dow Jones as well as S&P500 are interesting on the 1h chart. Lets see what todays session brings. At the moment I prefer the scenario that we are currently in a corrective ABC up which will find its end around the 61% retracement. At this level another leg down could very well start, target area blue box. However should we rise over the 76.4% retracement this scenario becomes rather unlikely. During todays session the 61.8% should be in focus for a potential short swing setup.
US Markets reaching interesting pullback area prior FED meetingIs another leg down in the US Markets coming? If yes than it would be highly possible that this move originates in the 50-76.4% area. Trump Impeachment Process and Coronavirus (especially the shut down of china) are we weighing heavy on the markets can the FED tonight save the situation? It will get interesting.
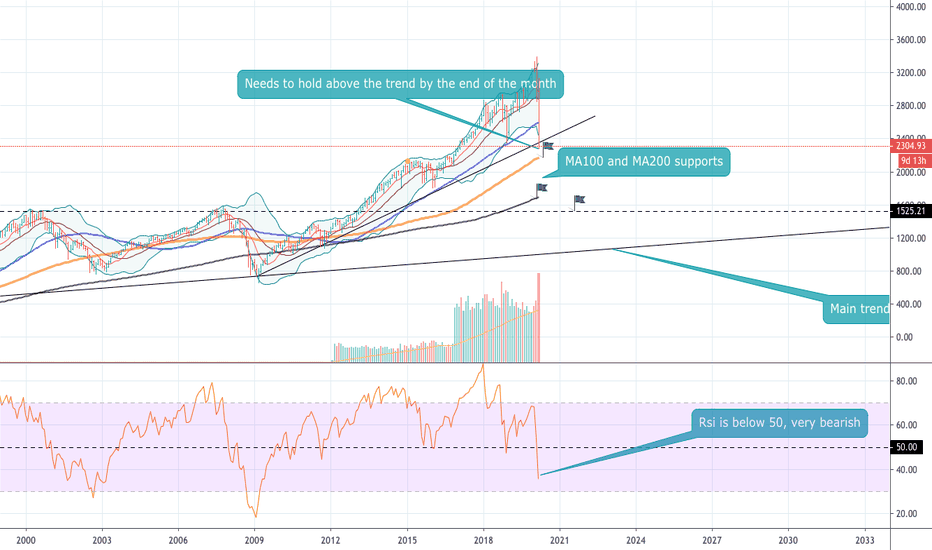
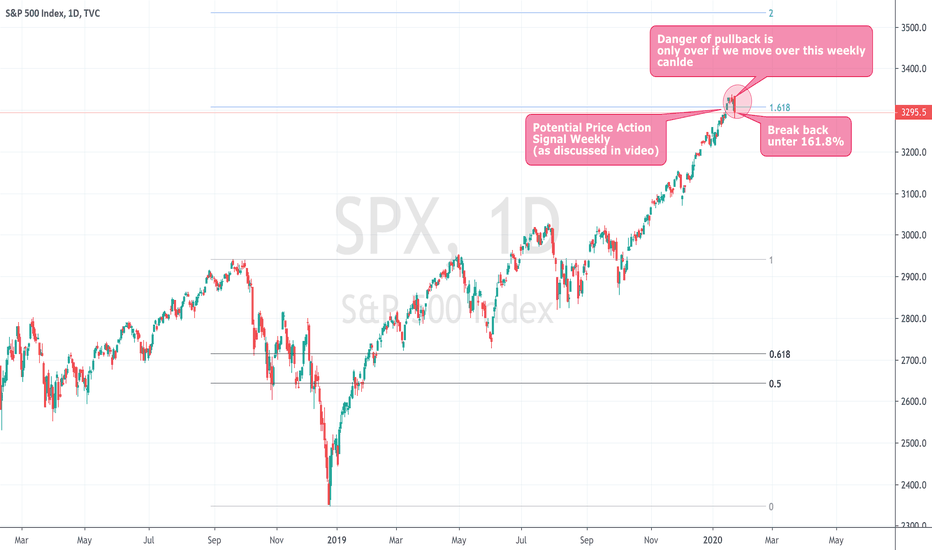
S&P500 short as long as under 3335 levelAs long as the S&P500 stays under 3335 price level there is a danger of a bigger correction which could play out. There pullbacks in the S&P500 on smaller timeframes can be used for short positioning at the moment, since we do got a valid signal in the weekly price action signaling us at least a brief correction over the next couple of weeks. Please watch my last video analysis of the S&P500 big picture to understand why we are potential at a major level at the moment. (Video linked below)
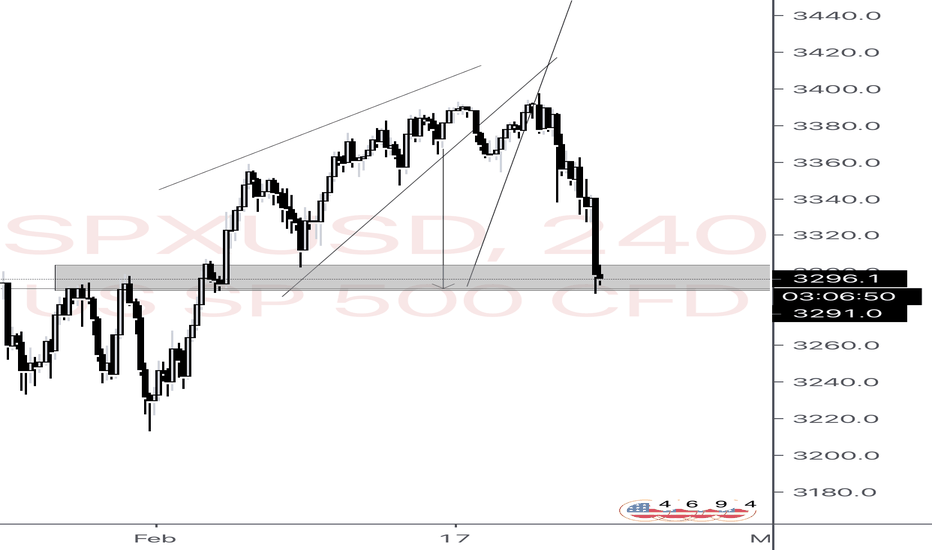
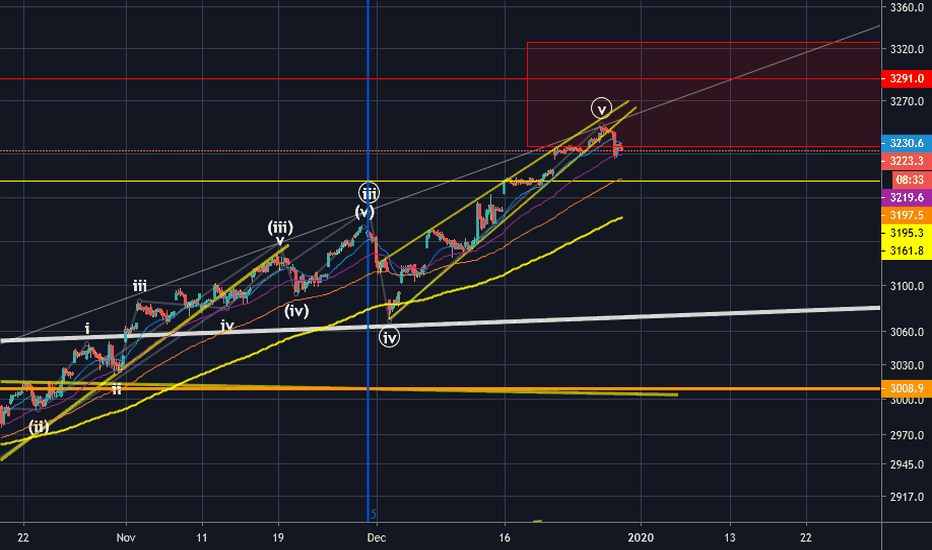
Correction TimeThe S&P has entered the danger zone (red box), which is based on the .618-.768 fib extension from the last pullback.
Looks like the rising wedge has impulsively been broken.
We could see it retest, and reject again, but don't be surprised if we have some red days into the new year.
Currently I am long the VIX, and Silver & Gold Miners
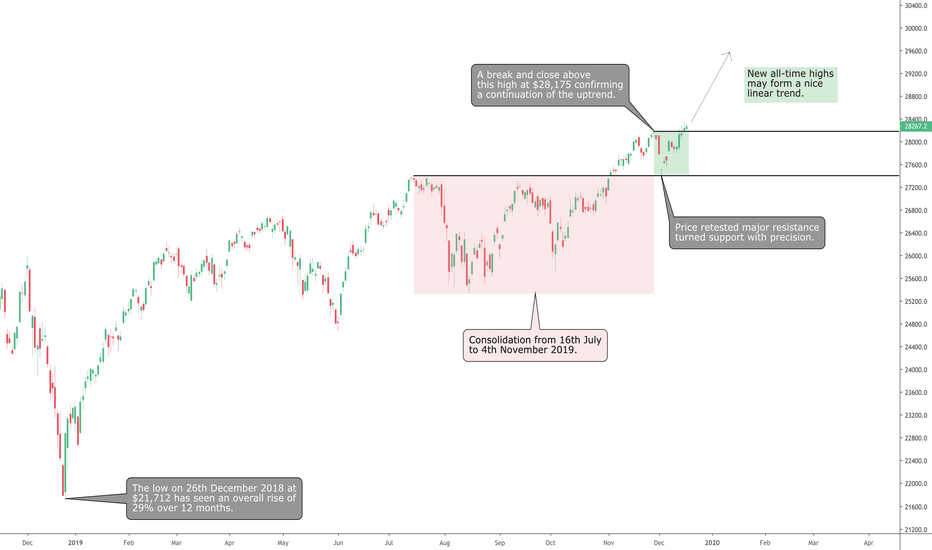
The Dow Jones Making A Break For It!The overall structure of the Dow Jones 30 looks positive. The most recent pullback came down
and tagged the support level from the consolidation resistance and bounced off from that level.
After periods of consolidation, it is always good to see price retest support levels as it confirms
the support level is holding and gives more strength to the buyers. Now what we ideally want to see
is for price to continue to trade above the previous high at $28,175.
This will tell us that the buyers have enough momentum to see that price continues to create
higher highs for the next few weeks and months.
This is a good early indication that a strong bull trend may be unfolding and helps to prepare
us to take advantage by entering strong bullish stocks.
The Dow Jones has seen some nice growth over the last year, rising by 29% or 6,500 points.
This may seem like big growth to some but we may be in store for even further growth in the Dow
and overall US market.
See below for more information on our trading techniques.
As always, keep it simple, keep it Sublime.
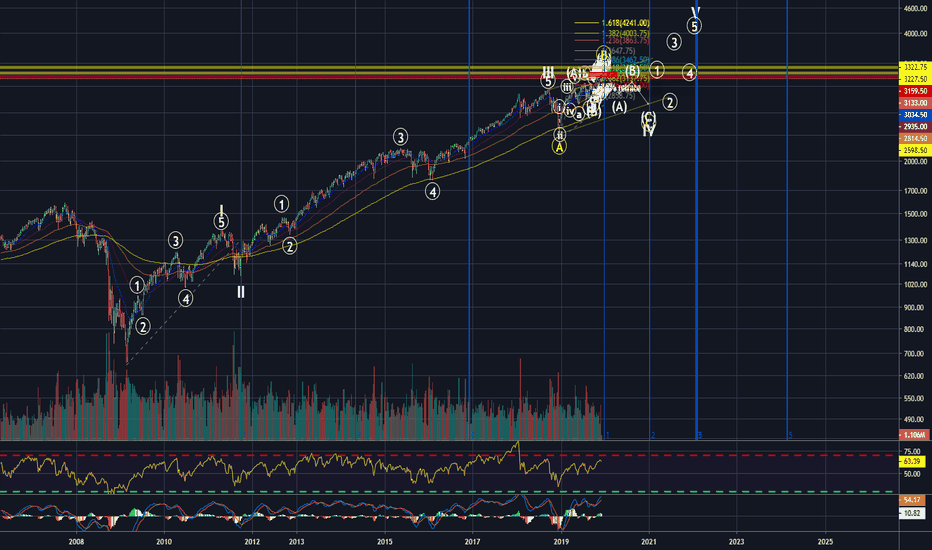
Big Picture CountApologies for the mess, but first I want to post the bigger picture and then I'll link to the smaller counts within. I have us currently going up in B of the larger wave 4 in a running flat. Multiple fib time frame point to this B upwave ending around 01/01/2020 in the range of 3,200-3,300.
Then we should start the C wave to go back down to the bottom of the running flat, which will then either start the major 5th wave, or could continue the correction in a D, which would make the ABC and ABCDE instead.
I don't really think there's a way to tell which is more likely at this point. We'll just have to keep an eye on the geopolitical tensions.
Obviously once things cool down and trade deals are accomplished, that would most likely signal the beginning of the 5th major wave.
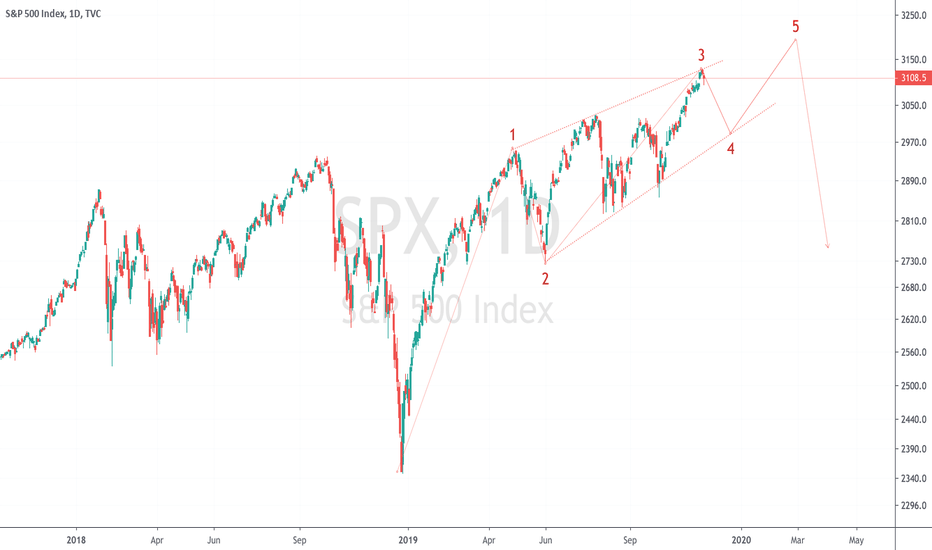
S&P500 should get interesting on the short side.The American Market Index looks interesting for a play on the short side. However I am not expecting this to be "big" corrective move but only a wave 4 to the downside which will be countered with a final 5 at year end. Lets see how this one will play out. So far the S&P is moving as analyzed.
