Usmarkets
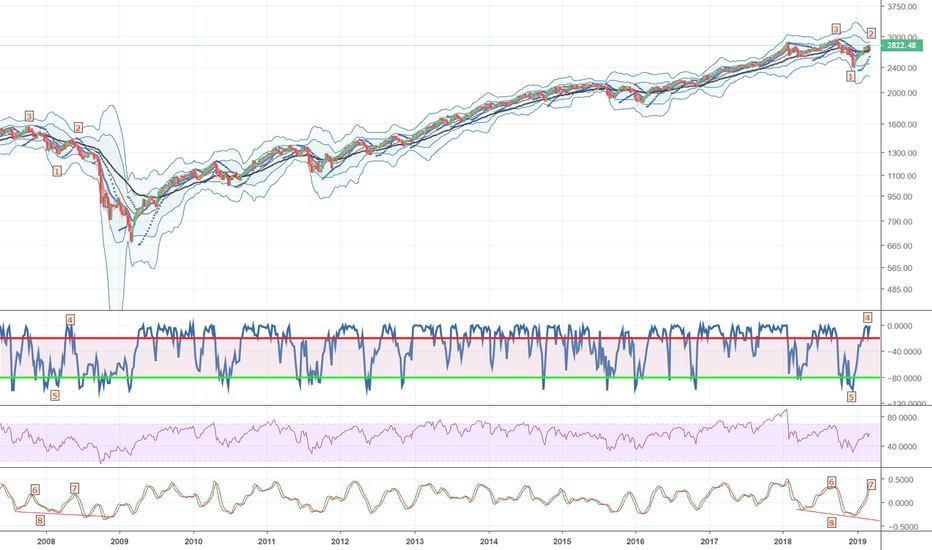
S&P500 gains despite economic data worsening S&P500 reaches a new ATH. However ISM/PMI Data out of the US speak a different language. After we have already witnessed a global slowing and contracting of the economy with many countries having PMIs under the 50 level for quite some time now, the US has now followed this trend that has been going on for over a year. PMIs again came in lower today and under the important 50 mark, which means in the contracting area. We have now 3 readings in the PMIs under 50 over the last 3 months, signaling that the situation is not just a statistical outsider but a trend. I am expecting the US market (S&P500) despite worsening data still to reach potentially the 3200 level. However these gains are driven mainly be the expectations that the FED can turn things around like always. Should we reach the 3200 level and economic data has not been improving until then, I am expecting a bigger 3 Wave correction to start from there, potentially even a correction that could be correcting the bull market which has startet in the year of 2009, this could happen if despite FED interventions the Economic Data doesn't improve. Hence expect a correction from the 3200 level, the size of the correction then will be unfold on weather the FEDs interventions are successful or not. Either way I am expecting that it will get very interesting soon keep the markets under close observation. Good luck!
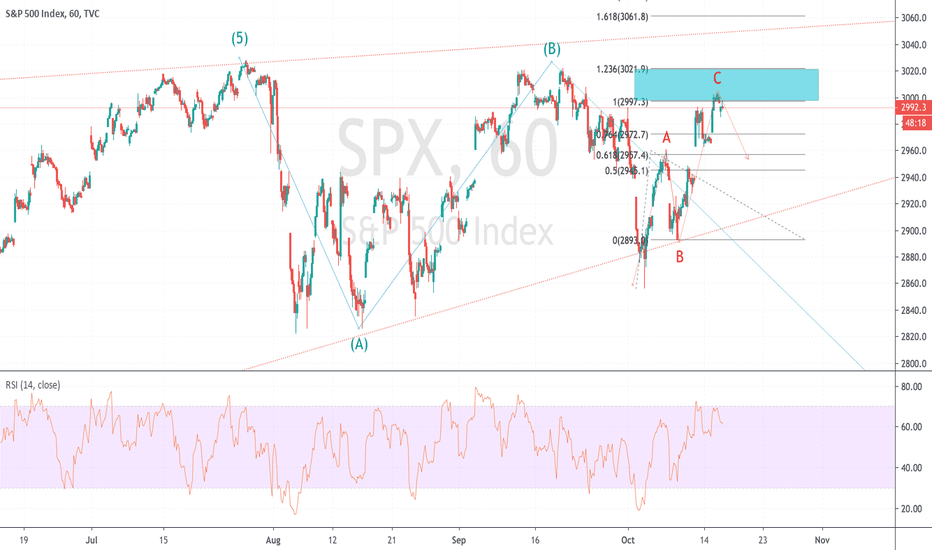
S&P500 stalling in front of target level. S&P500 has made a corrective 3-wave move up as analyzed, the blue target has been reached. As long as we dont shoot over the blue target I am expecting the index to reverse to the downside again. So as for swingtraders there could be good risk riward ratio at current levels however, entries need to be timed in lower timeframes and be confirmed in price action, at the moment that is still missing. Keep that index on WL.
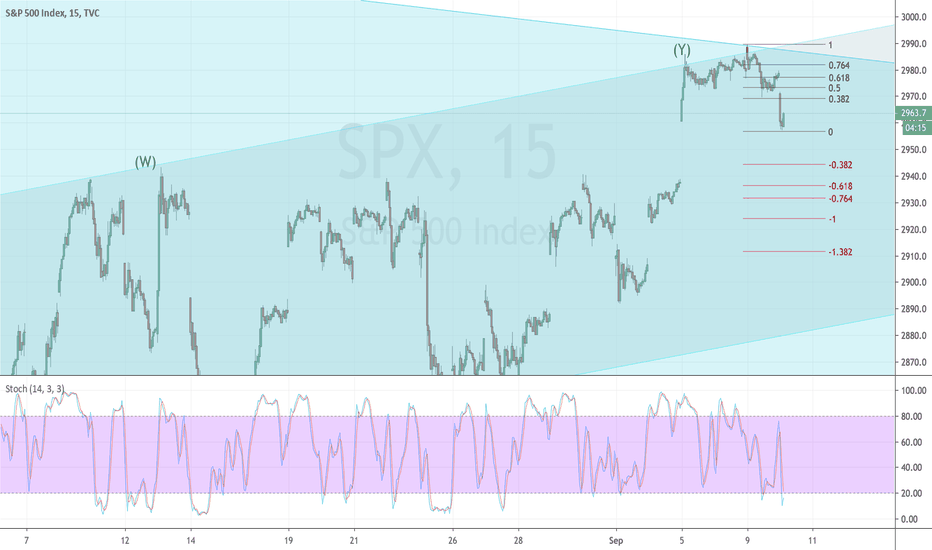
Possible short swing in the US Market comingAs analyzed before I am expecting the Markets to be in bearish momentum as economic data has worsened. Trump & Fed are going to full length to keep the market up (China Deal & Repo/QE) but no new highs could be reached. I analyzed before that eventhough we are in a possible 5 Wave move down we should see a corrective abc move within a corrective 2 which should reach around 61-76.4% from prior high, this target on the upside has been reached on friday. Now we could revers again to the impulsive 5-Wave move to the downside.
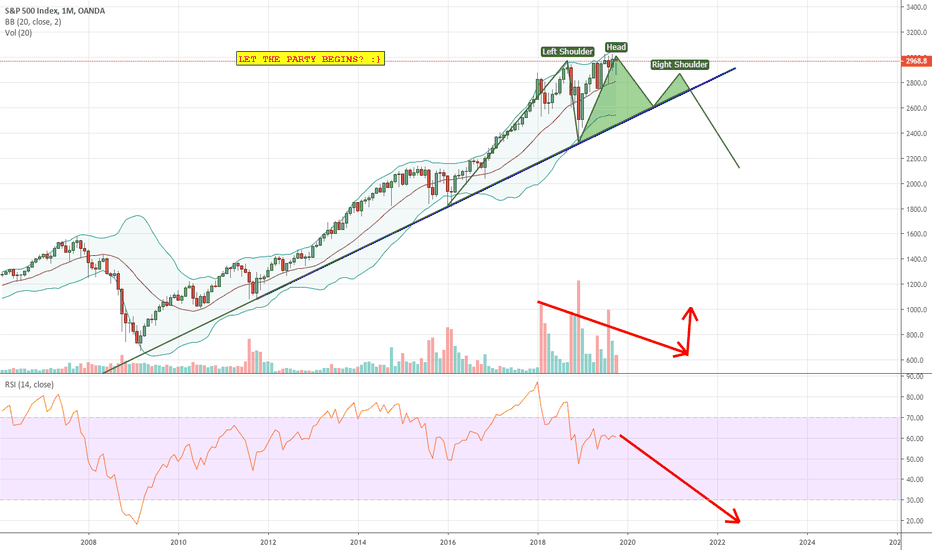
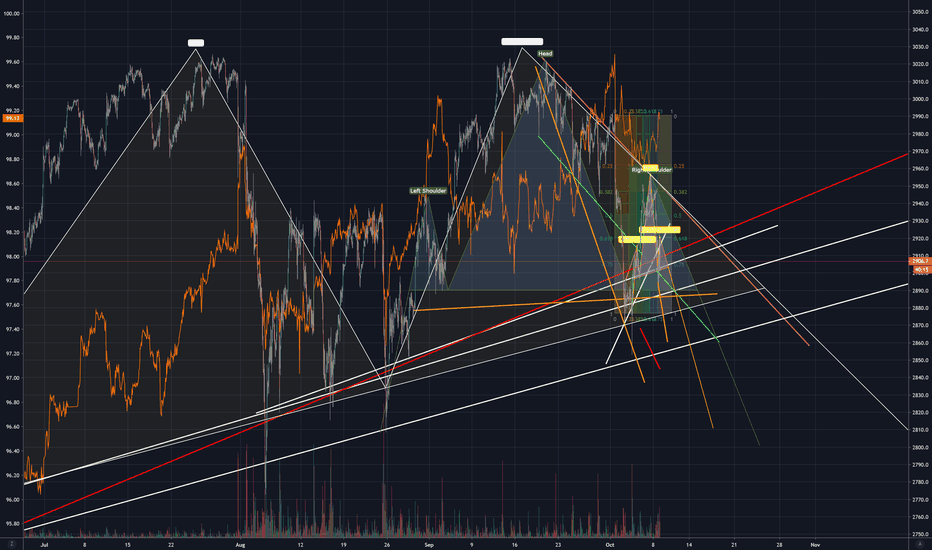
Potential Diamond pattern-Head of a possible Head and Shoulders My current opinion (to be invalidated if there are signals that contradict my current view). On daily charts, we could probably see an ultimate outburst to the top next week before a progressive collapse (on November 2019?) of the US (and therefore worldwide) equity markets. If this happens, then we would have a perfect Diamond pattern which would be potentially the Head of a Head and Shoulders' pattern. I'd pay attention to the monthly diagonal supports, in addition to everything you know (whether it is linked to data analysis, indicators, patterns, momentum, volatility, intermarket analysis etc.).
If this, which could appear to be too good to be true for long-term short-sellers, really happens, then maybe we could see the "Trump rally" become erased(Fundamental new could be linked to raise in corporate taxes again? Punishing the FANG etc?). Borrowing could become more expensive (increasing interest rates). This would go the same for the European Quantitative Easing. We would then be back to 2014-2015, where I think every equity markets started to become a Central Bank-engineered "price bubble".
Volume could decrease towards the formation of the potential second shoulder, then spike while the neckline is being cut. The RSI could start going lower and lower until oversold territory. But this would be a positive sign for shorts.
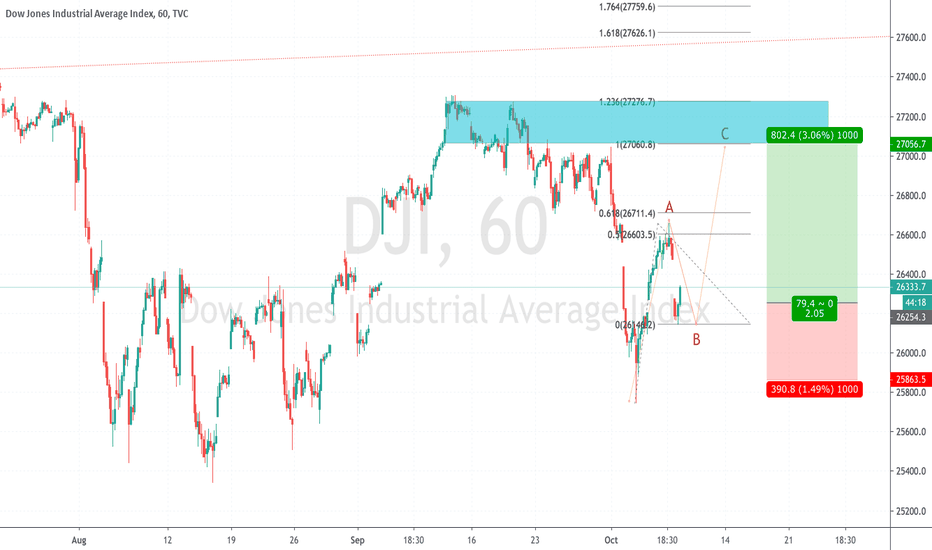
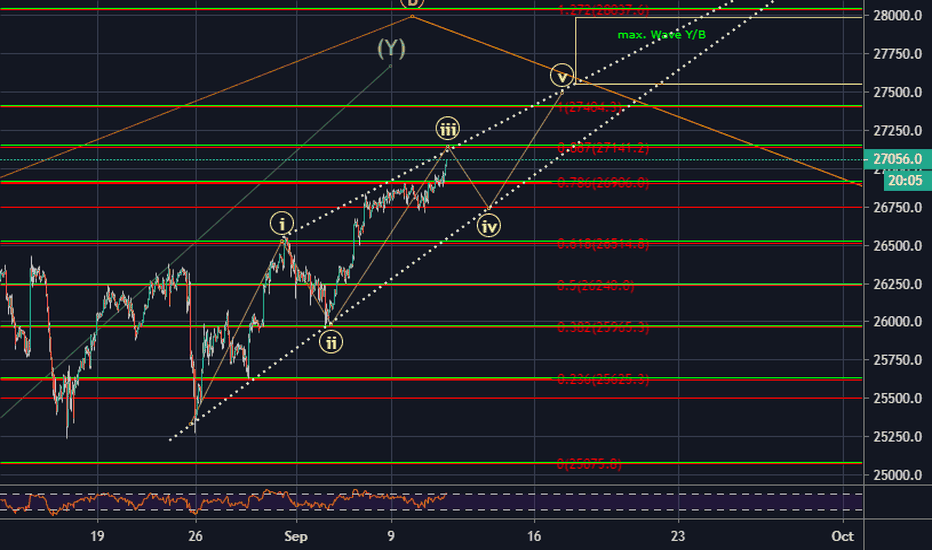
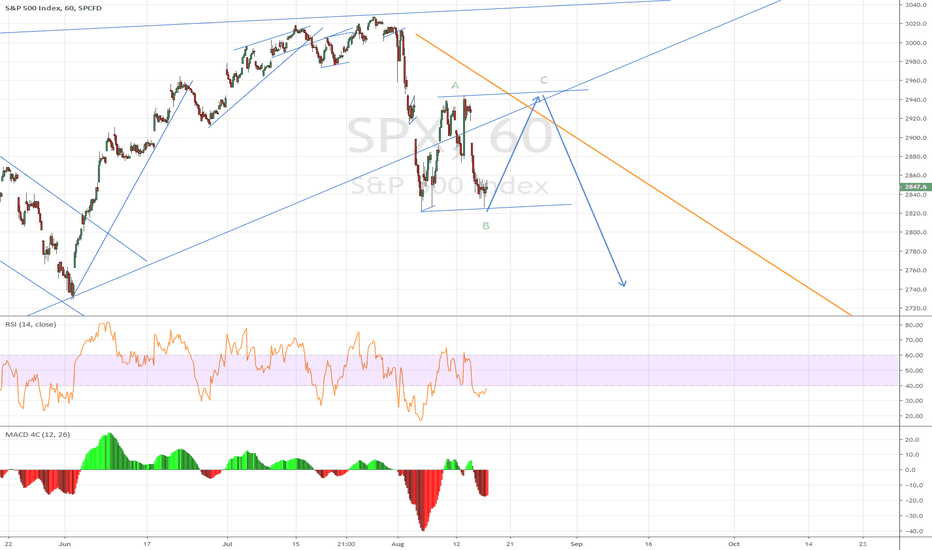
Dow Jones with possible ABC korrektive move to the upside. The US Markets could make a corrective 3-Wave move to the upside. If this scenario plays we should see a c-wave to the upside which has the 100-123.6% fib. ext. as target area. Chance vs. Risk would be about 2 or higher at the moment. Note that my overall picture on the US Markets is still more to come on the bearish side.
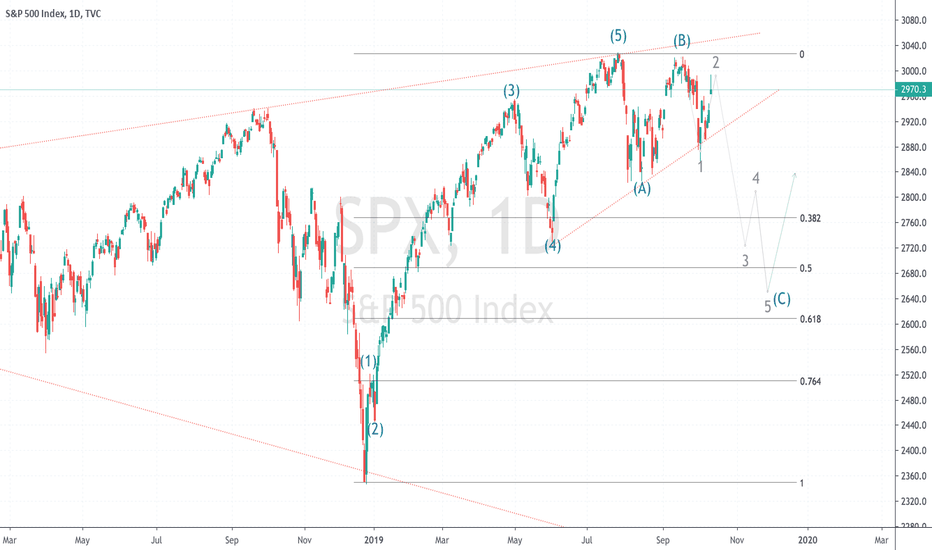
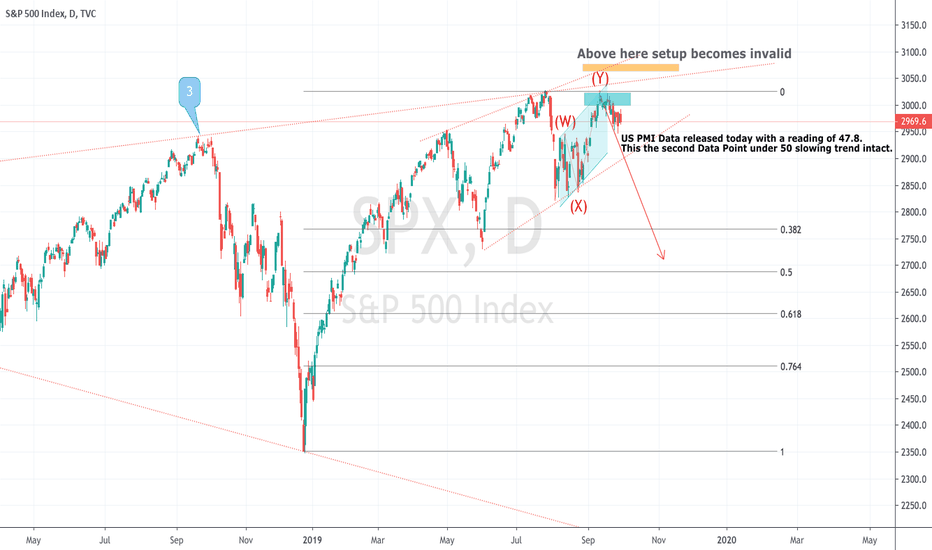
SP shortsetup still active as Economic Data in the US WorsensIf you have watched my analysis before I still expect the US Market to correct to the downside min. a 50% retracement from the last significant low. Fundamental Data is worsen as we stay in the contracting area under 50 and get a new lower reading with 47.8.
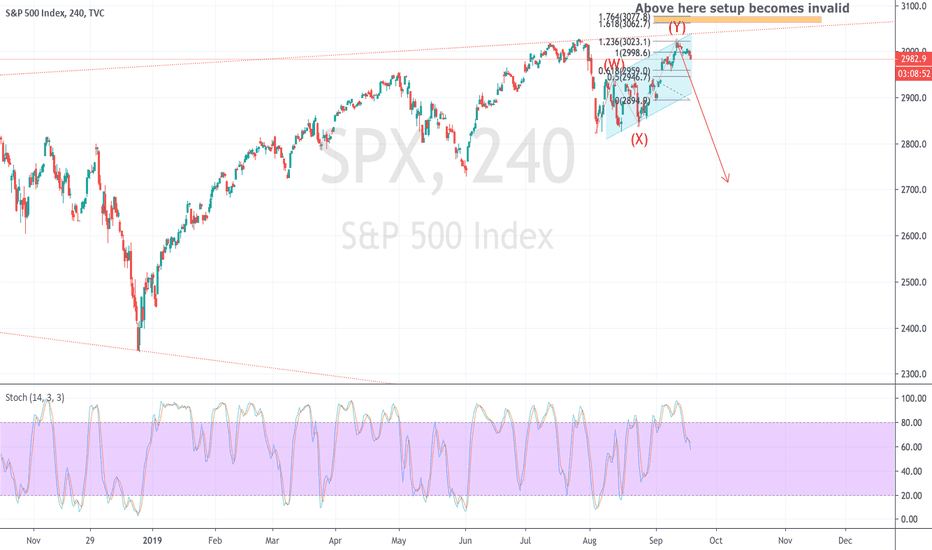
S&P500 update prior FED Talk short scenario stays intactInterest Rates have been cut 0.25bp as expected, but more importantly what will Jerome Powell tell us during his speech? My short setup (WXY Corrective Structure) as shown before stays in tact as long as we don't break above the price area marked in orange on the chart. After the meeting we should know more. Be save in the Markets
$SPX to $BTCMany have missed a trend line BTC has respected from the start of this bull cycle.
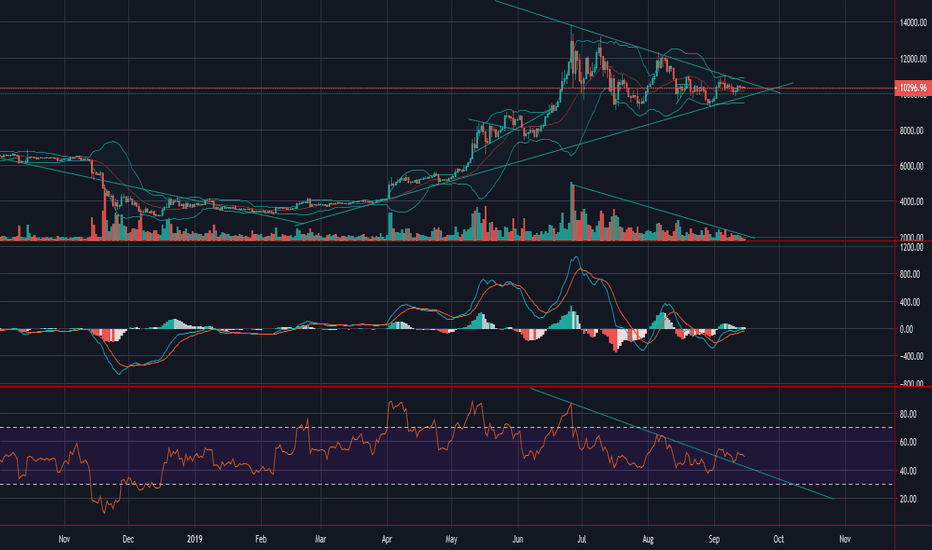
The first and Last week of April created two points on that trend line that were later also respected in August.
The recent consolidation has been far above my trendline, allowing for sideways coiling for months while still respecting the trend.
Decision time is here though. By the end of next week, the trend line as well as this descending triangle will meet.
The decreasing volume and break through RSI trendline are usually good indicators prior to move upwards.
I expect a shakeout downwards first though, typical of BTC, and RAPID bullish candle immediately after.
Get ready everyone, 14k, 16k, and then 20k are coming in these next few months.
The interesting part is where the funds come from.
There has been a clear inverse correlation between US markets and crypto (one up, other down)
The US stock market is currently in a massive rising wedge ready to pop (last post).
I believe the SPX will come down to 2100 as first stop by the end of the year.
Whales will not have their money sit on the sidelines. Here comes BTC.
The US recession and the biggest bull cycle in the history of an asset will occur simultaneously.
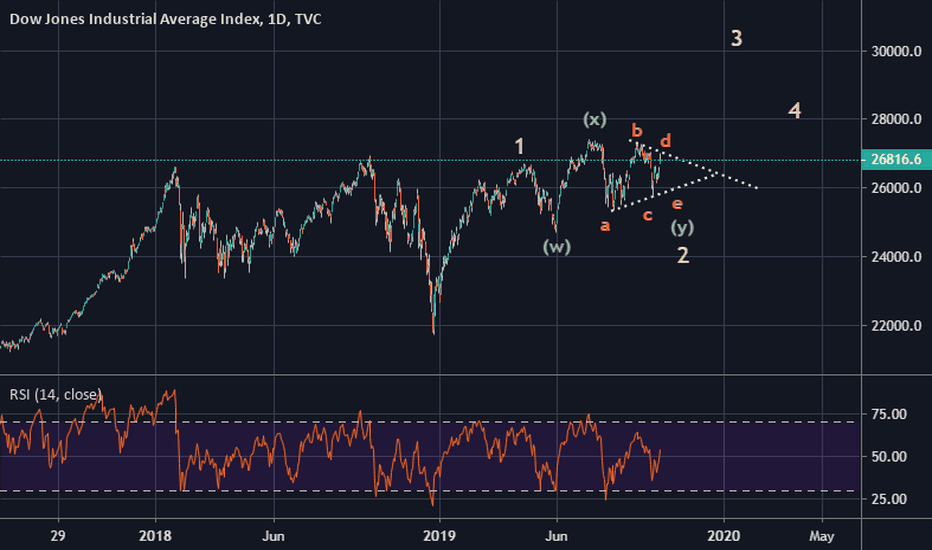
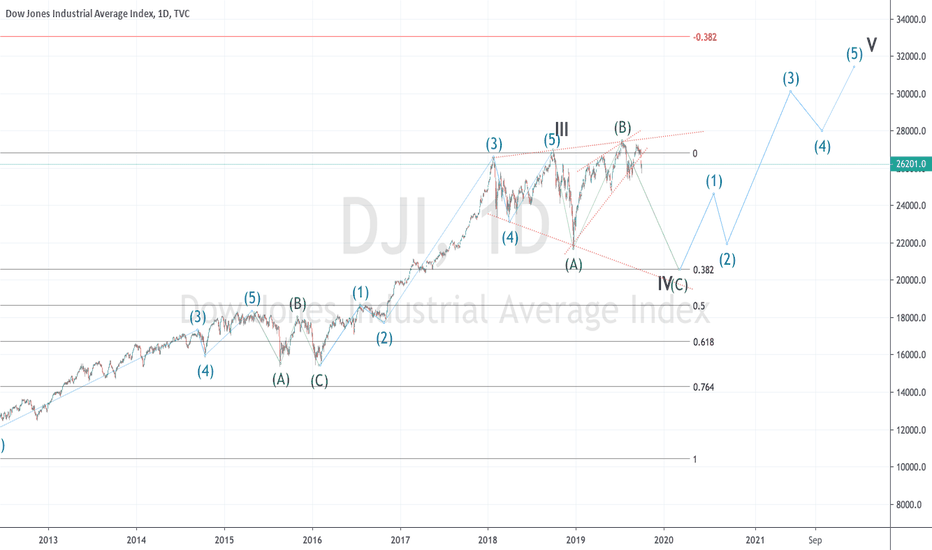
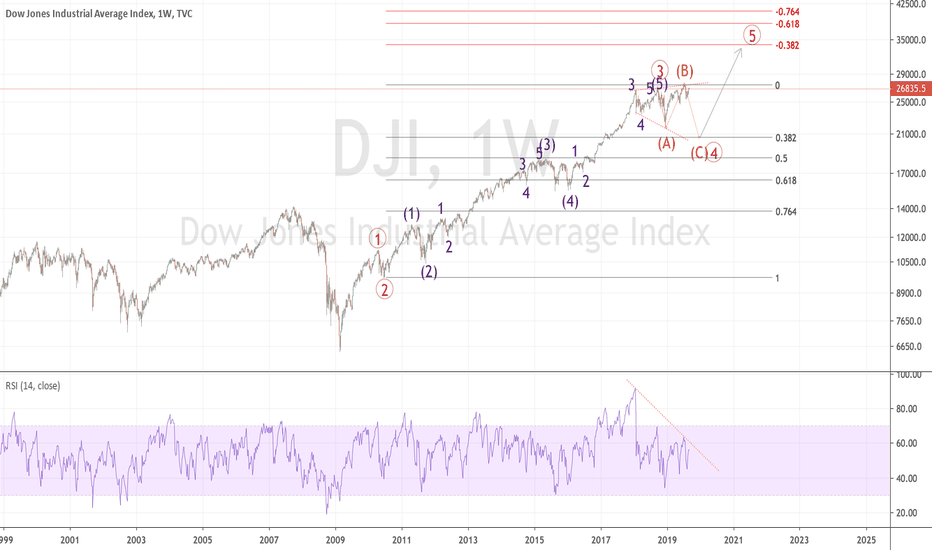
Dow EW-Count in case that the corrective 4 has not finished yetIt doesn't mean that this EW-Count needs to play out (wave 4 could already be finished). However I am just taking this into assumption as another szenario, in which the corrective wave 4 is still going on and plays out as a more complex and streched out structure in time. If this is the case, then it could be looking something like this. Also note how the wave 2 was rather short in time and short in retracement this could mean that the wave 4 now is deep in retracement and long in time, therefor we could still be in the wave 4.
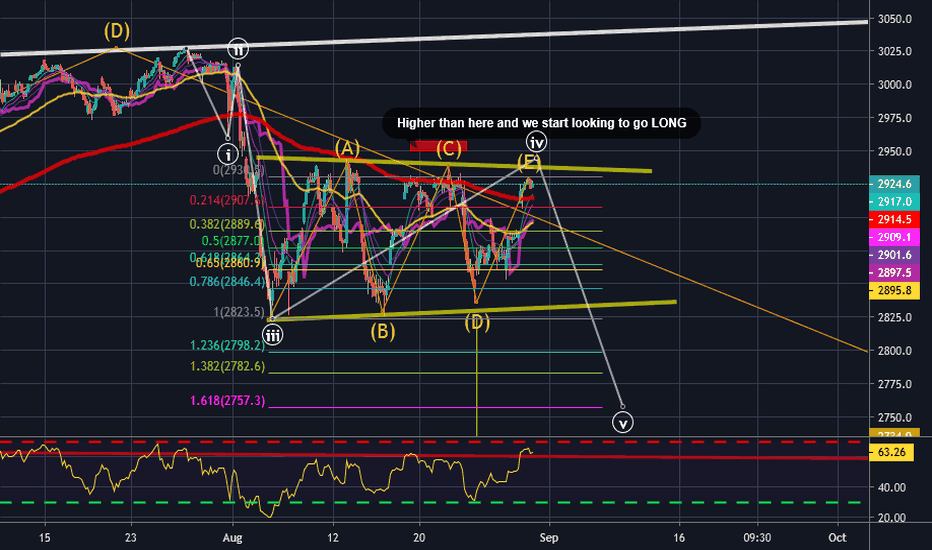
Next Downtrend SoonIt appears we'll be starting the Wave 5 impulse downward soon.
Timing is not my strong suit, so depending on how the president tries to manipulate people, we might not see it until next week, but it seems inevitable. I'm holding my long in the VIX with a target around $28-30.
Personally if it doesn't start tomorrow, I'll be loading up more on my VIX position because the labor day weekend could hold some big news.
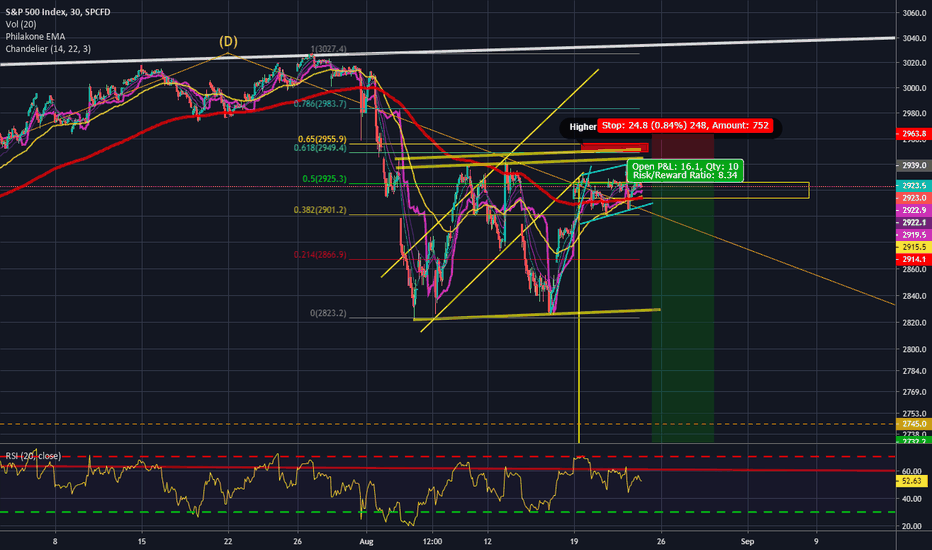
Short the S&P, unless we see 2960Very BEARish on the S&P right now, and really all major indexes, especially the Russell and Nasdaq, but I mainly play the S&P through the VIX by buying leveraged VIX ETF's like TVIX which gives you 2x.
If we break 2890, we're going down to 2740 next to finish the bearflag measured by the vertical yellow line.
(note: I'm in hard bear mode and do hold a bearish bias to these markets right now. I friendly invite any opposition to try and convince me that we are not in a market correction and ultimately going down to 2,000)
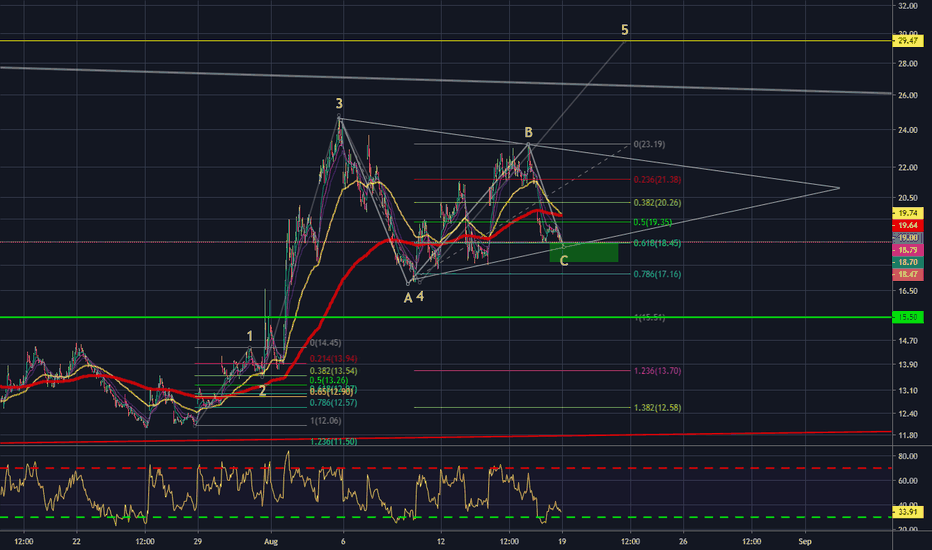
Good buying opportunityDepending on how the markets open and futures go over the weekend, we could buy right here on the .618 fib level and bottom of the triangle.
We still have to finish the C wave correction, so we need to see this triangle hold. If it doesn't we could be looking at the $15.51 support for our next target because that would be a 1:1 ratio ABC correction
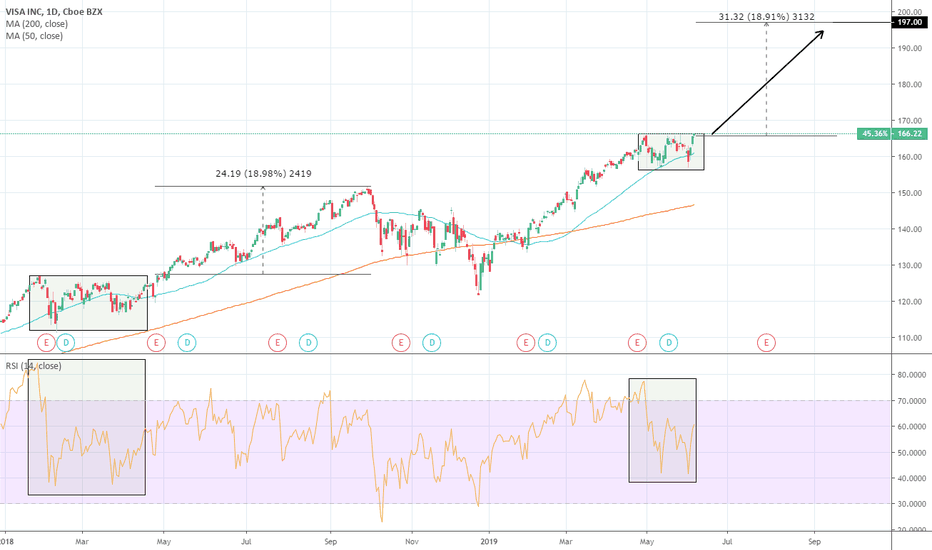
Visa: A winner amid the May market correction.Visa became today the largest S&P500 company to hit new All Time Highs since the May correction. 1D is on very healthy bullish levels (RSI = 60.091, MACD = 0.770, Highs/Lows = 1.7236) to ensure further uptrend. What is particularly interesting is that the price action since early May is identical to the January - April 2018 candle sequence. Even the RSI pattern has strong similarities. After the 2018 pattern was completed and a new High was made, Visa gained +19% in value. Assuming that the 1D MA50 will support this uptrend, we are expecting a similar rise which puts an early target estimation at 197.00.
** If you like our free content follow our profile (tradingview.sweetlogin.com) to get more daily ideas. **
Comments and likes are greatly appreciated.
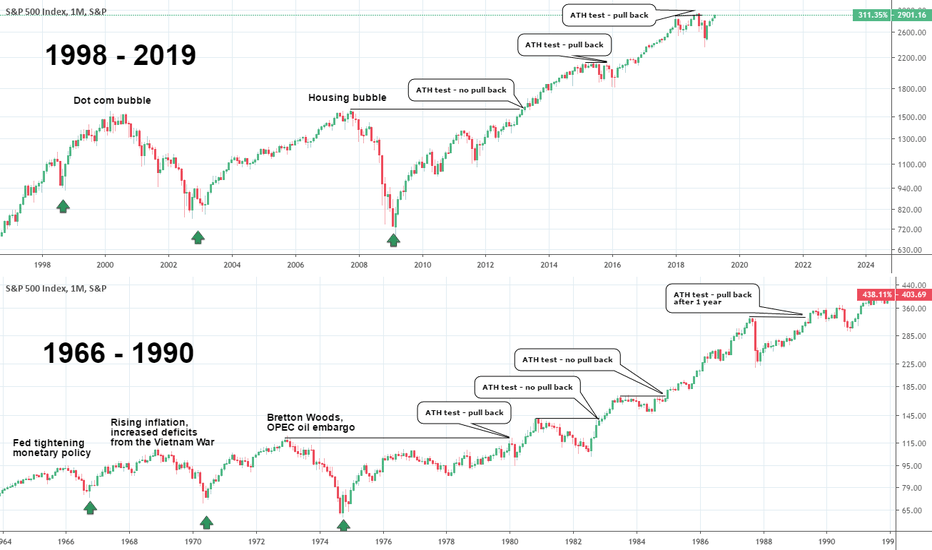
What happens when SPX tests its All Time Highs?With SPX approaching its All Time Highs (ATH), having risen non-stop on the 1M chart since the December low, we try to answer this question: How SPX behaves near its All Time Highs?
In this attempt, we thought it would be useful to back-test two long term periods, which share remarkable similarities: the 1966 - 1990 period with the 1998 - 2019 (current).
Initially and for almost a decade each, both periods share two major crisis events: For 1966 - 1990 the 68 - 70 and 72 - 74 bear markets, for 1998 - 2019 the 00 - 02 and 07 - 09 bear markets. What followed this period of turbulence was a strong bull market. The first was the one that actually led to the 2000 - 2002 crisis (Dot com bubble). The second one is still ongoing and based on the similarities of the two periods SPX should keep rising to new highs.
Will we have a pull back upon the ATH test? Well let's look at what happened during the last times SPX tested its ATH. In the modern era (1998 - 2019), SPX pulled back 2 out of the 3 times, but stayed on its strong bull channel since the bottom of the Housing Bubble. During the previous era (1966 - 1990), it pulled back 2 out of 4 times.
Since however the last ATH test was so recent, it is unlikely to make another pull back so soon, unless it follows the 2015 - 2016 example.
So in conclusion, SPX has much more chances breaking its current ATH (2,940) with in fact every bearish monthly candle being a buy opportunity.
More related material:
** If you like our free content follow our profile (tradingview.sweetlogin.com) to get more daily ideas. **
Comments and likes are greatly appreciated.


