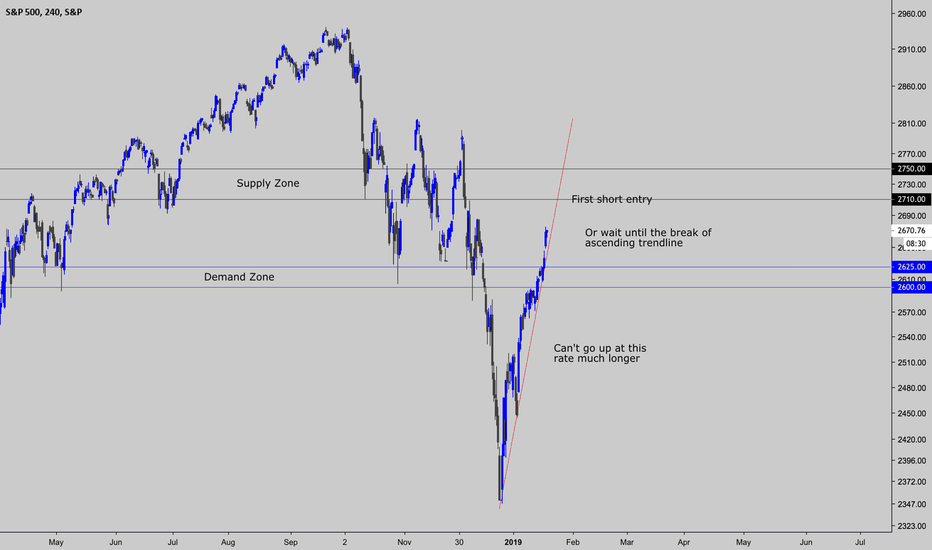
#SPX S&P500 Pure Price Action Chart SetupUS markets have rallied tremendously over the past month. We have increased steadily at a very fast rate, however we cannot go up this fast forever. 3 touches of the red ascending trendline confirms it as a support. Once price breaks trendline and bearish PA is confirmed, I will short heavily. US markets have been propped up after end of 2018 sell-off due to positive news of fed not hiking rates in 2019 and USA winning the trade war against China for about the 10th time (and hopefully the last as today China announced to buy billions in products to fix the trade imbalance) However I will short bearish PA and will be watching closely.
Usmarkets
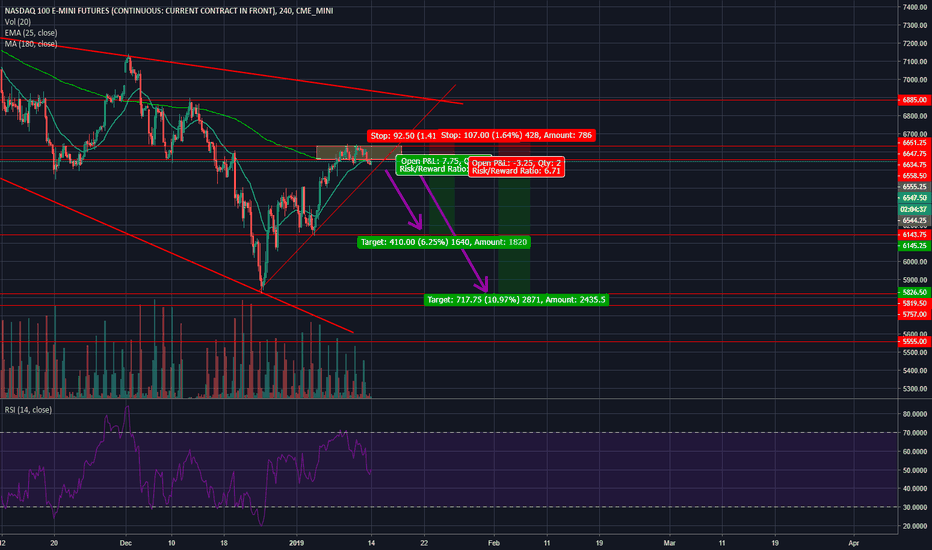
Short US Equities. The Dead Cat Bounce is Over.The market entered an important zone of resistance, formed by important support levels in the past. It is also failing to break through the 180 MA, where it has been rejected many times during this recent downtrend. We have also formed a double top, with bearish divergence shown on the RSI. As soon as we break resistance at 6530 with force, it will be a good short opportunity. I believe this was the completion of the dead cat bounce in the recent days, and we should now see a continuation of the downtrend. I will be playing this through SQQQ .
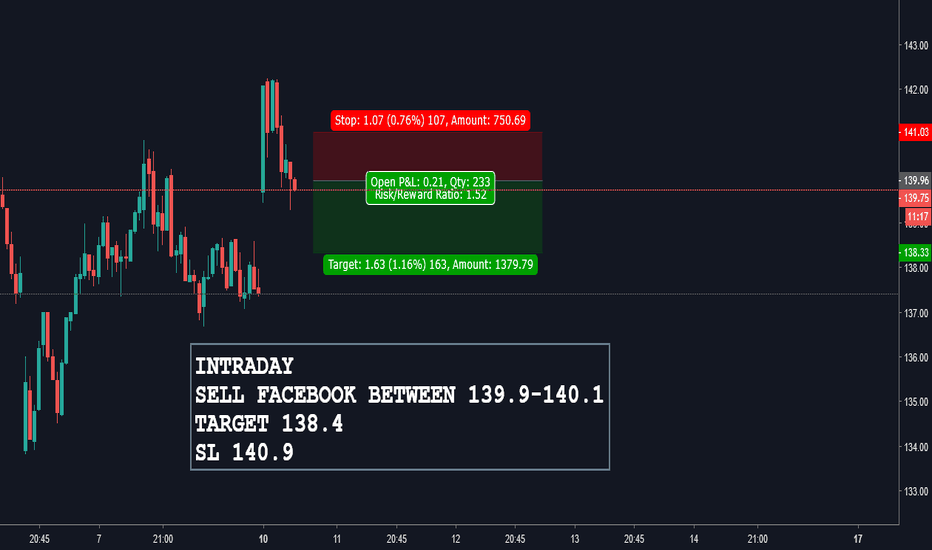
FACEBOOK - DAY TRADE (1.55 REWARD TO RISK)Levels mentioned on chart.
(Trying to post a day trade for the first time)
Hope the lag does not affect the idea.
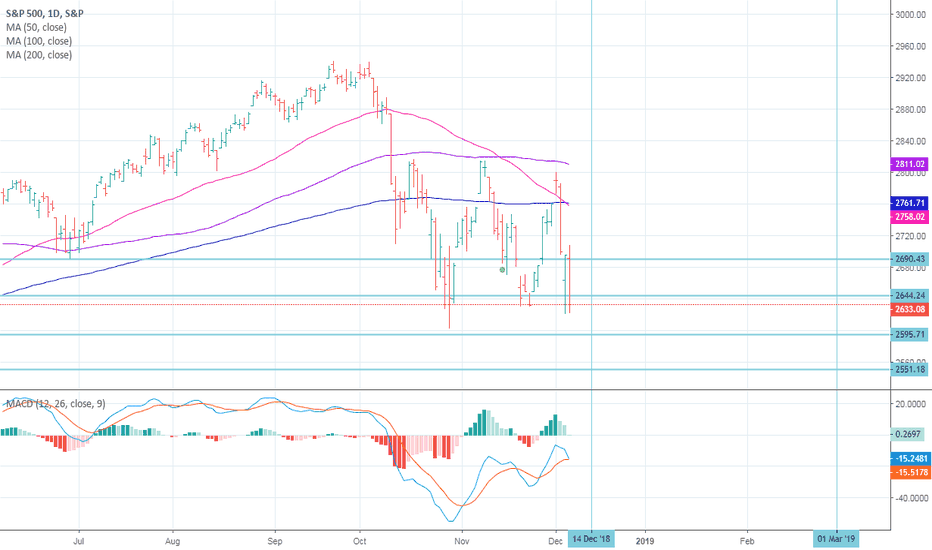
$SPX Index forming a triple low and continue to be in a channel Sun 09.Dec.2018 12:13
Ticker: SPX
LAST= 2,633.08
S&P 500 INDEX movement during the last few days showed a Bearish move, with a recent low price seen on Thu 06.Dec.2018 at 2,621.53 forming a triple lows formation at around 2,635.00 level and continue to be within the channel formed since mid October
During the next few days the price is expected to go down to 2,620.00 just to test the strength of the lower level of the channel .
The view for the Short-Term is expected to continue to be DOWN as long as the price is below 2,647.55. And its recommended to ' BE SHORT ' for a targeted price of around 2,625.00 and then may continue to the first and second support levels.
On the other hand, a change in the direction of the general trend needs to be considered when the price trades above the level 2,745.00
Res_2 = 2,690.50
Res_1 = 2,644.00
Sup_1 = 2,597.55
Sup_2 = 2,550.00
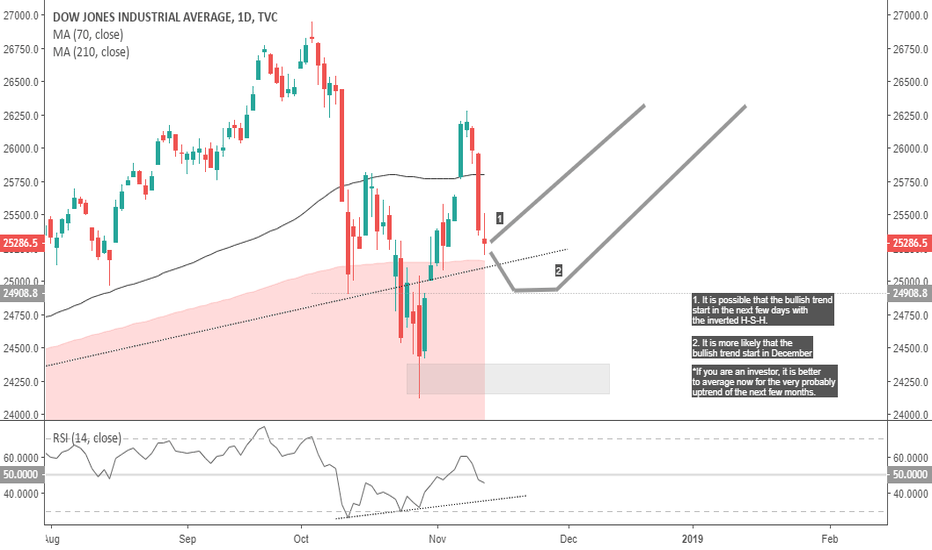
Dow Jones & World Markets - Bullish & Averaging LongWe are averaging our derivative positions for the next few months when the RSI crosses the 51 level on the DJI weekly chart. We will only cancel averages if prices stay longer than 3 days <24k. The inverted shoulder-head-shoulder pattern can be seen in most world indices.
I take this opportunity to reaffirm our outlook for the markets in the coming months, being a bullish stock market, bearish commodities, a bullish dollar and a bearish euro. As for blockchain, it will be decided in a break very probably in December.
