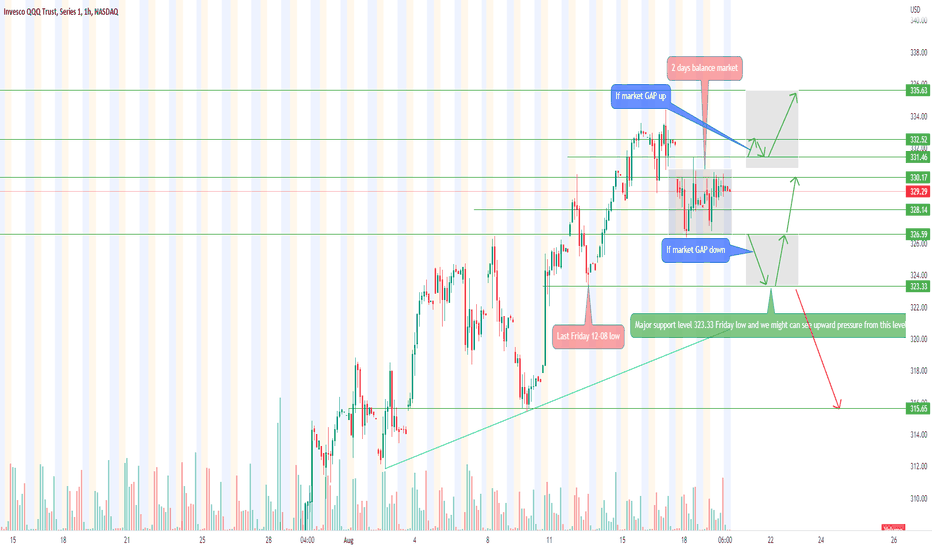
Usmarkets
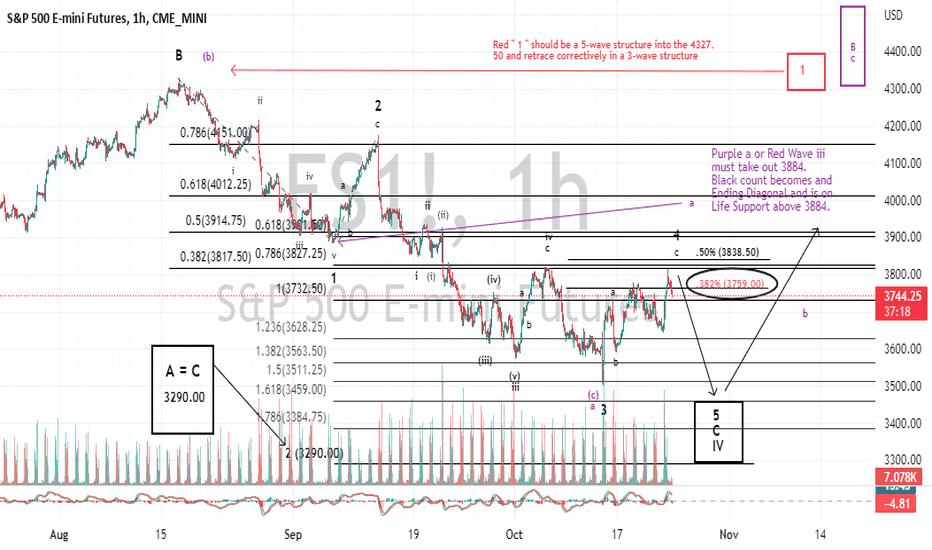
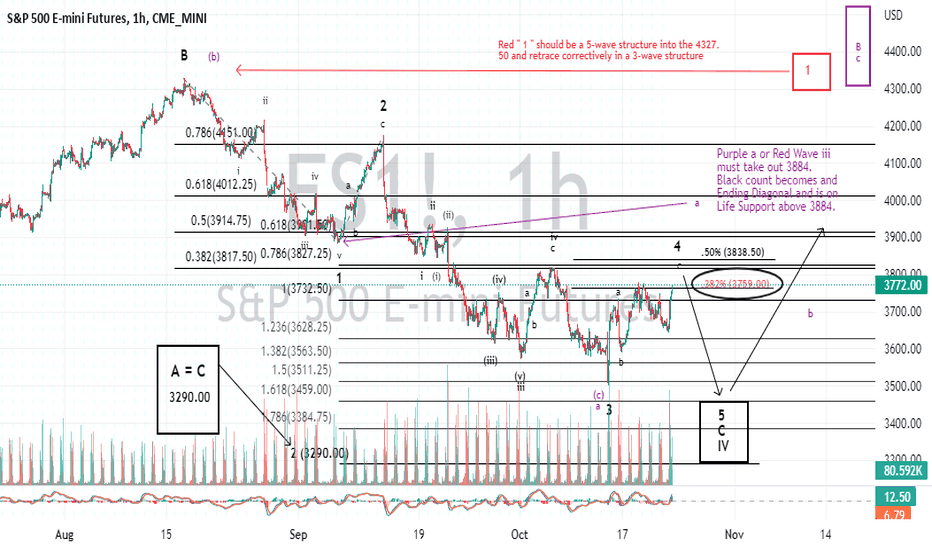
Morning Update: SPX Futures may need OMH to 3823 Last night’s spike up and reversal seems to display the hallmarks of the short-term trend shifting. However, in a further examination of the smaller timeframe fractals, unless this develops into a Leading Diagonal (which is an untrustworthy trading pattern) we should chop around in this area only to get OMH towards the 3823-38 area.
The black count is playing out within the smaller the micro timeframes as you can see from the above. I will point out that OMH is NOT required to complete this pattern. This pattern can be considered complete and Black 4 is done. It’s the overlapping decline from the 3813 high that is causing me to anticipate one more high (OMH). Additionally, I mentioned over the weekend I would like to see a day or two of slight upward pressure on price for MACD to get closer to the zero line.
So we have this area where this final battle will take place for control of price. I fully expect to know the outcome by weeks end.
Best to all,
Chris
The Peculiarity surrounding Smart People I think it was Confucius who said, “Real knowledge is to know the extent of one's ignorance”. I find that quote one in which I must contemplate for a while. I would like to know I have the capacity to realize when I was skewing more so towards ignorance, rather than remaining rational. I also have to consider the nature of ignorance means I’ll never be successful in that endeavor.
Putting that aside for a bit. I have many goals, like so many of you reading this post, I would like to accomplish before I depart this life. Professionally, none more important than in the same vein as Richard Dennis and William Eckhardt, training average people how to successfully trade markets. I’m not talking about hosting a webinar on how to place a limit order. Neither am I referring to what James Cramer does on his Mad Money TV show where he states what he thinks you should buy and what he thinks you should stay away from. I’m talking trading success.
Individual self-sufficiency. " A Turtle for Today"... My Turtles.
I’ve written about these two characters before (Dennis and Eckardt). The story of their Turtles haunts me. I have read all I could find on them. Suffice to say The Turtles are largely anonymous today. To me, that’s ok. I actually respect that. But if you're like me, you’ve searched the ends of the Earth to find that one thing that separates us, as traders, from all others. How does the trader of today, differentiate themselves to achieve long-term success? How does today's trader get an edge on all the competition? These are deep, but relevant questions to ask ourselves in the trading business. Inheritant or otherwise through formal means...smart people want to impress you that they’re smart. They want you to understand the depths of their knowledge is complex...so much so, that going to the store for bubble gum is not as simple as it would seem. That these things are complex, and your simple minds would not understand.
I will impart one thing to all of you who have taken the time to read this Sunday diatribe of mine...Reject that notion and, ERROR ON THE SIDE OF SIMPLICITY.
Simplicity in how you interpret your analysis.
Simplicity in how you develop every trade thesis you execute.
Simplicity in how you approach trading in general.
If a lay person cannot agree with you, then in my opinion, you’ve over complicated it. It goes back to when realizing we’re being ignorant. The very nature of ignorance is not knowing, so it’s somewhat counterintuitive to come to some realization. I will not draw this post out so long as to the point it’s gets boring so I'll conclude. I studied Economics in college and was fascinated by it. I met my wife in Freshman ECON 101 and we’re still married today. I learned about the money multiplier, supply side and Keynesian economics, and the role of the Fed. I could write a 100-page post on this subject matter. But in as much I enjoyed learning about these things....AS A TRADER, I HAVE FOUND THEM TO BE WORTHLESS.
If you’ve read this post to this point, please allow me to leave you with this parting nugget of wisdom. And a simple reminder. YOU’RE NOT AN ECONOMIST. YOU’RE NOT A GEOPOLITICAL EXPERT. You’re not a mathematical Nobel prize winner or contender.
You’re a trader. So keep things simple.
“Unrealized intelligence I’m sure is a Chinese proverb”.
Chris Maikisch
Best to all,
Chris
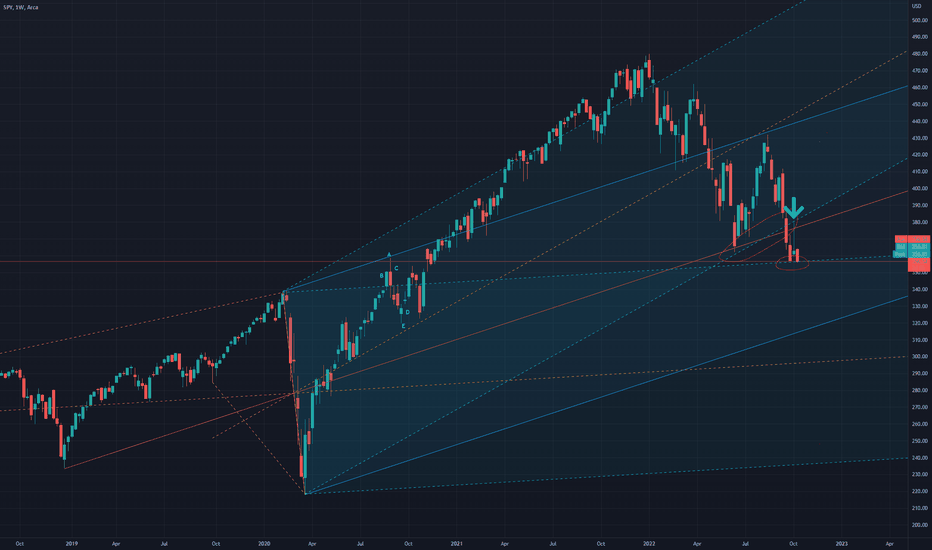
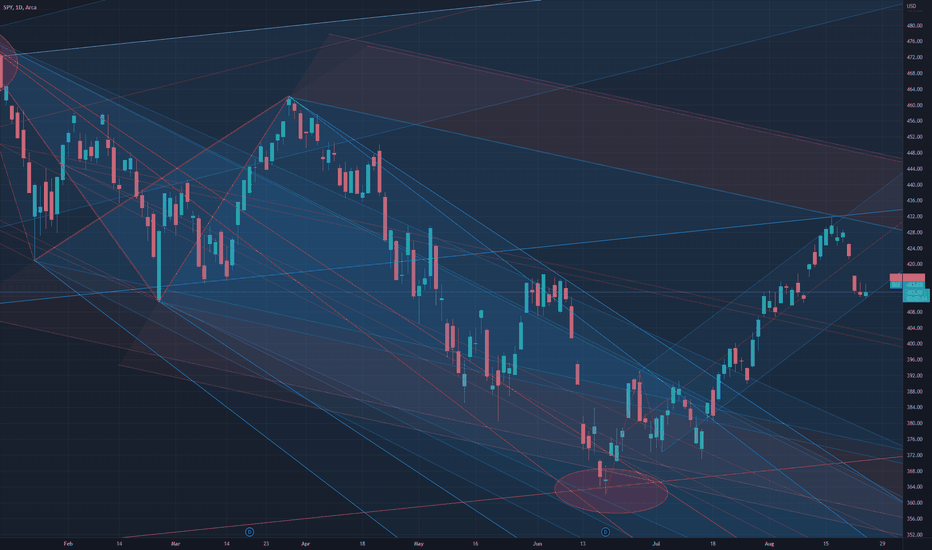
Bullish SPY pitchfork analysisAfter reaching the higher pitchfork line (blue arrow) SPY went back to the same pitchfork line as earlier (red oval)--see related ideas and my notes there. At this point I expect it to go back up again. If that doesn't happen in a short time (1-2 weekly bars) SPY may fall more. If it does, which I expect, the it will likely break through the earlier resistance pitchfork line where the blue arrow is.
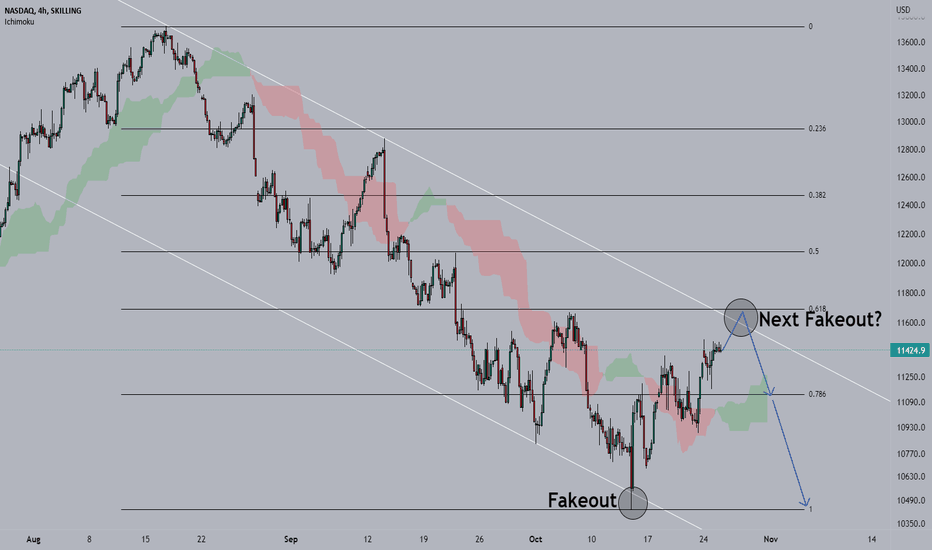
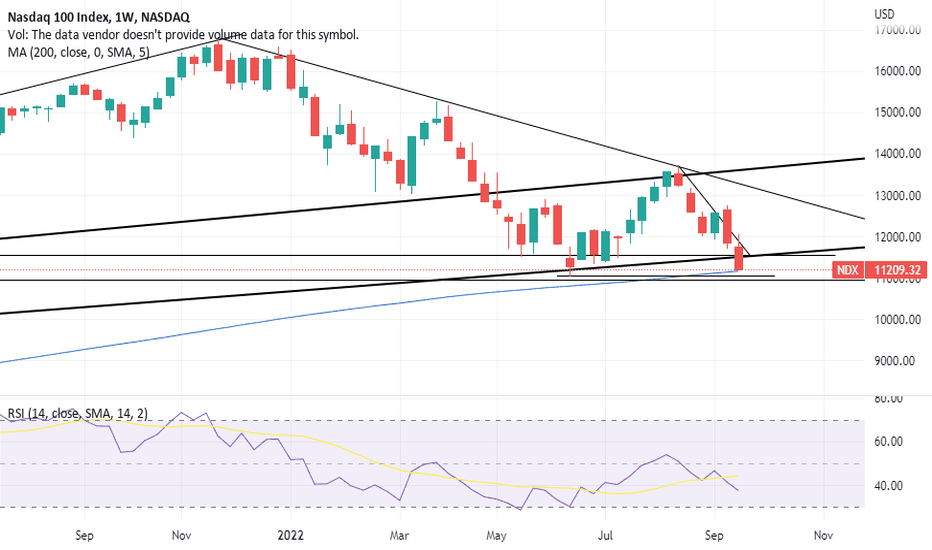
NASDAQ, 21ST SEPT MEETING ANALYSIS!!- REUPDATED!!due to the hikes in interest rates, US markets are not getting that freedom to freely enter the market and make their positions. the hike is creating a fear among the people of not entering into the market, and keep on people selling their positions, making markets keep falling.
"A BULL RUN can only happen when all the news has been factored".
this explanation is also set for the INDIAN markets too. and people do have a good and fresh mindset to enter into the markets. when such a thing happens US markets will have a boom. and this will gonna be happening soon.
support lines are too mentioned. news is much factored in the indices, if by a chance nasdaq, broke the particular drawn supports to, then the next support will be forming around 10000, which is about 10% fall, but i dont feel now there is such more news aspects lefty to cover which will make the markets to fall with such a high number.
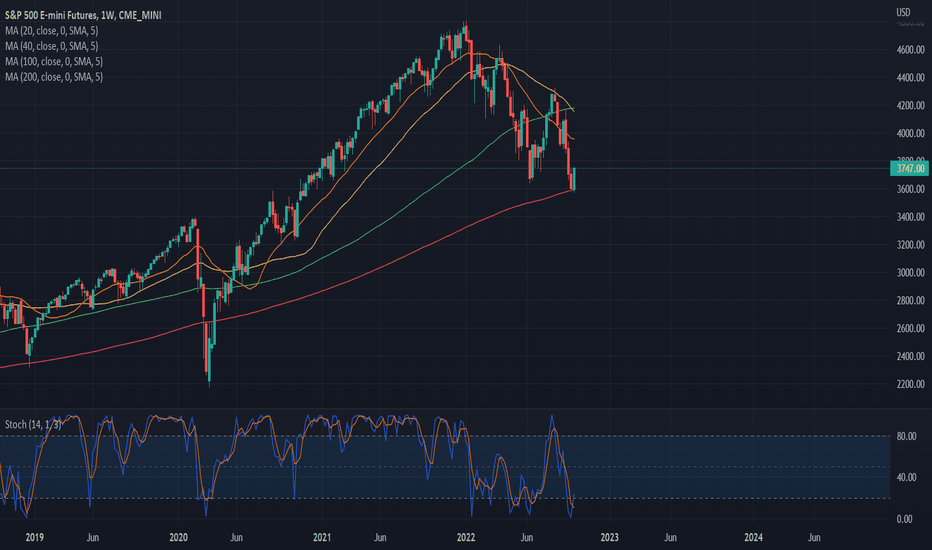
final words, do watch out for 200 MOVING AVERGE, because from past few weeks, this indicator is acting a very good support for nasdaq.
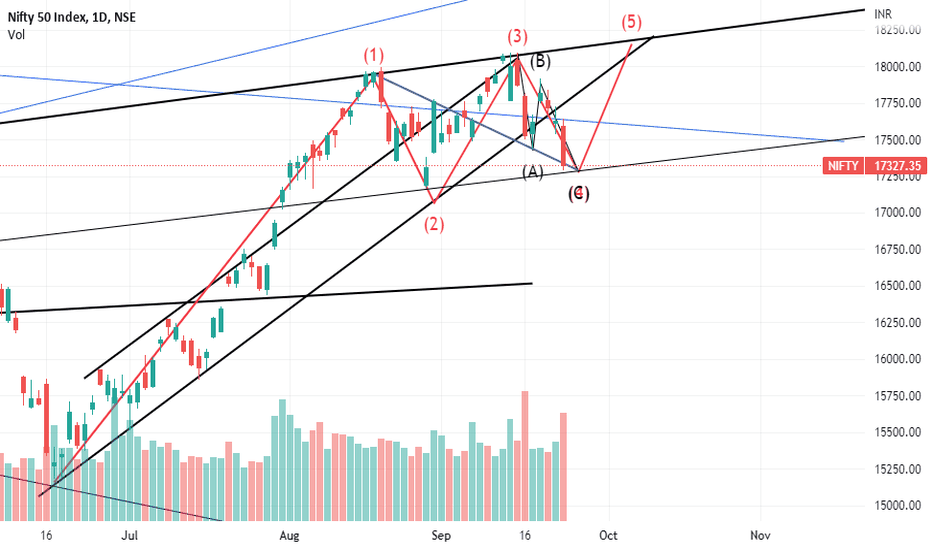
NIFTY 50, WAVES- REUPDATED!!in my previuos analysis of nifty50 waves(i will mention the link), i had drawn the waves which existed with the 2 major black line(drawn out in chart), i had thought nifty 50 will complete its 5 wave bull run impulsve movement, in that trend itself. but due to the affect of US markets, nifty is fluctuating(same acts for NIFTYIT too), so it will now hold that support(drawn in black line), which is drawn from the markets getting consolidating, after the 2020's bull run. and end up in same trend line which was going previously.
today(23rd sept), when the markets opened which gave a breakdown to my analysis, i had drawn out the purple line, and today the same days when markets got closed, supporting my line, i am confirmed now with my waves.
therefore this analysis even says that US markets will also recover very soon, and will give its bull run.
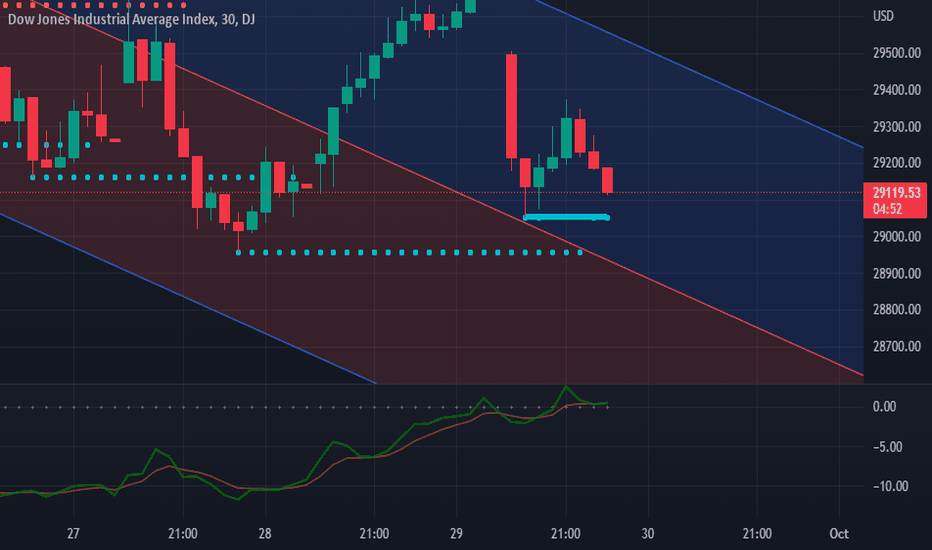
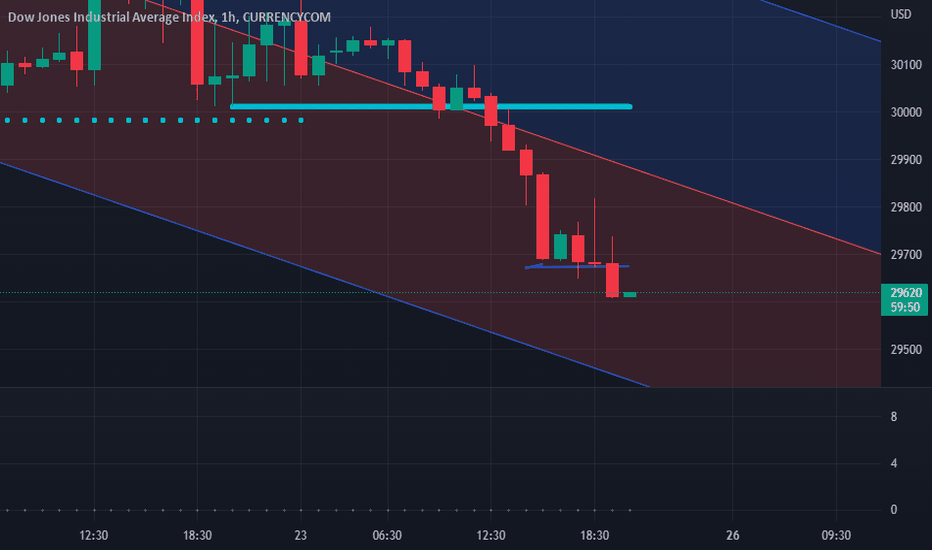
BUY DOW AROUND 29600Buy Dow Jones Around 29600 will See 29800 and 30050 Will See Some Bounce from Here
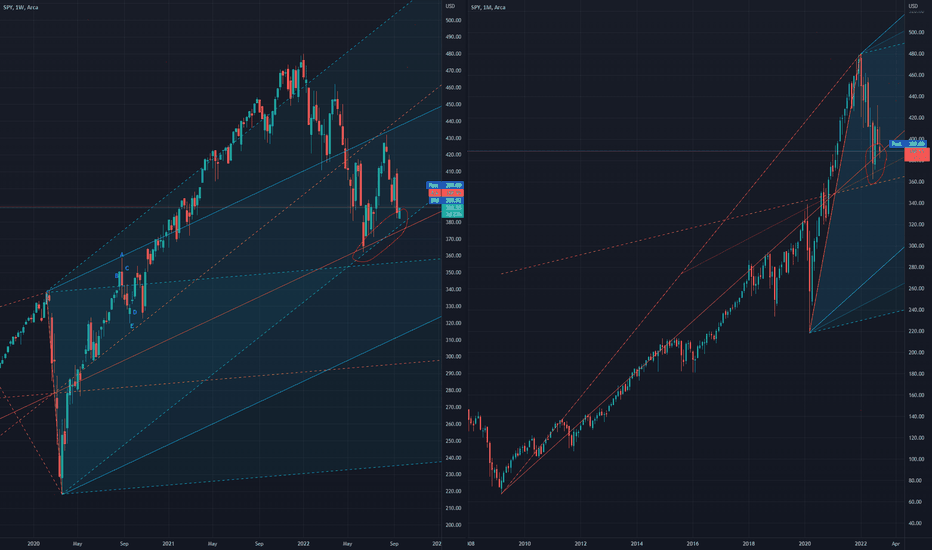
SPY - bullish (pitchfork analysis)This builds on my previous pitchfork analysis (see related idea which pointed to June 17th as the point of reversal and the start of the longer term bullish cycle). While that still stands strong, this is a smaller term analysis. SPY reached the intersection of 2 upper pitchfork lines (well, one bar off the intersection) after which it fell. Now it reached lower pitchfork line which is a likely point a reversal, turning bullish. SPY however may go down to the next red line before bouncing back up. Looking at other, longer term pitchfork lines I drew, SPY hasn't become fully bullish (that is, it reached higher order bottom pitchfork lines than the upper lines.
