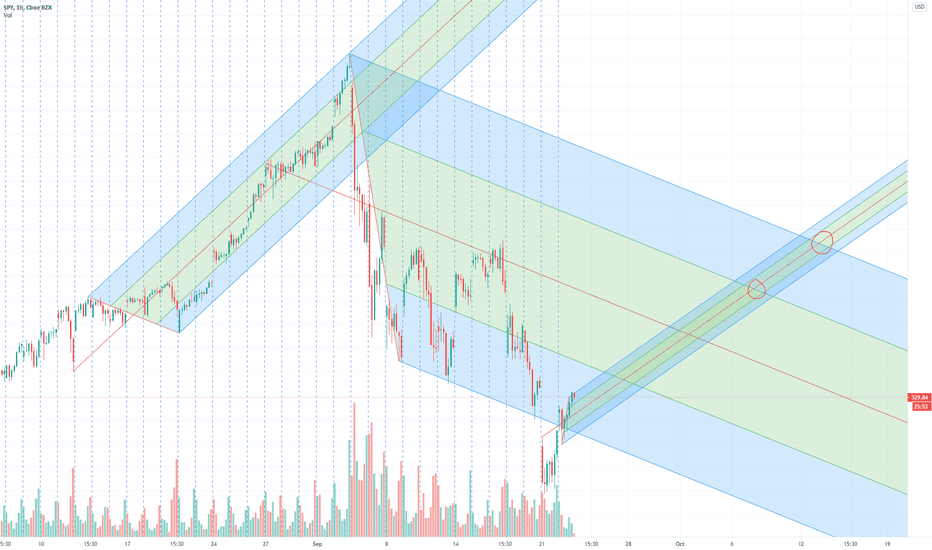
SPY fork pattern analysisI published another fork pattern idea earlier today (see related idea) on the daily chart pointing out how the fork patterns predicted the lasts 2 major market falls and the starting of the recovery after the previous fall and likely the point where recovery starts for the current fall (which was yesterday). I went to 1H chart to get a feel for where the market is going. You can see (for the 1st fork on th chart) the market fell when it reached the top fork line and that yesterday SPY went below the bottom fork line (for the second fork). The 3rd fork, meant to predict the market direction, is a bit premature: it's only based on 2 days of price action and it's rather narrow. Price action over the next days will likely go beyond the fork and will expand it. However, the fork may still give a valuable idea about the upcoming trend. Thus I predict that the SPY will reach the last red circle on the graph (when the last fork will reach the top line of the 2nd fork). That is around 342-343 on Oct. 13. As I said, this is preliminary, as the price action over the next days will likely expand the fork and thus, that point of intersection may come sooner. Whenever it comes, I find it rather likely that SPY will have a little, temporary fall at that point. That may happen instead when the last fork reaches the green line of the 2nd fork (where the 1st red circle is, around 339 price level on Oct. 7) but I find that less likely.
Conclusion: go long.
"Like it" if you like it! Add your comments, questions or concerns if you have any.
DISCLAIMER: Security trading involves substantial risk of loss. My analysis is not trading advice. Do your own research first and/or consult a financial advisor. I'm not responsible for any losses you may incur following my analysis.
Usmarkets
SPY fork pattern indicating the fall ended and recovery startedIf you draw the highest resistance trend line since the recovery started (the blue line in the graph) and from the high before the last one (where the red line starts, on April 29) draw a fork to the last high on that resistance trend line (on June 28) and to the latest low after that high (on the green line, on June 29) this fork clearly shows that SPY fell right after it opened and went over the the upper fork line (on 9/2) and, if the pattern holds, yesterday when it went below the upper line of the fork will be the point where recovery starts and the market will go up.
Conclusion: go long.
"Like it" if you like it! Add your comments, questions or concerns if you have any.
DISCLAIMER: Security trading involves substantial risk of loss. My analysis is not trading advice. Do your own research first and/or consult a financial advisor. I'm not responsible for any losses you may incur following my analysis.
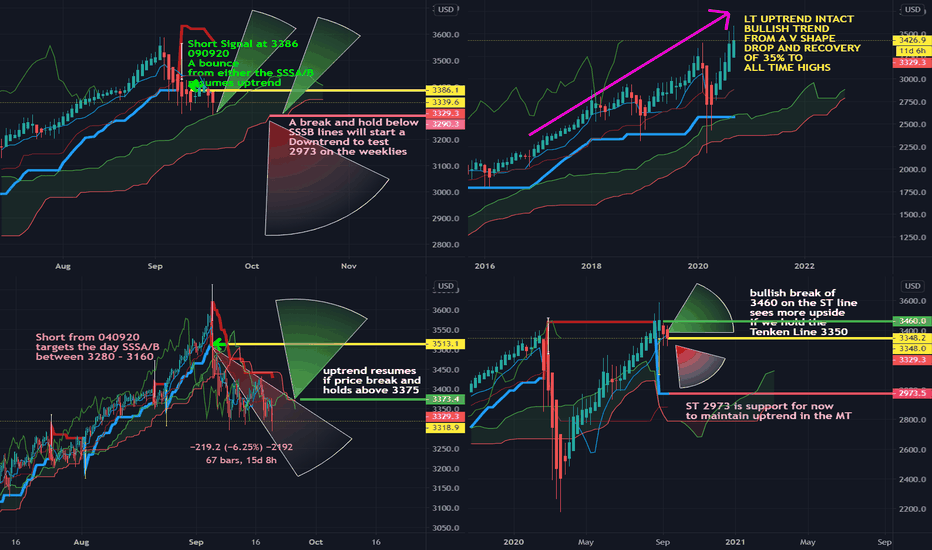
SPX correction intensifies in the short termA close at 3329 in the SPX sits exactly on the SSSA line of the day ichimoku cloud.
A test of the base of the cloud is imminent. The baseline forms support for now. The Teken level on the weekly charts is at 3350, this has been violated giving way to more weakness.
Bottomline: A resumption in the uptrend must see a bounce from Friday's close at 3329 to 3375 for the MT/LT uptrend to resume. A break and hold below the SSSB line on the Day charts may signal a corrective move to 2973, The Supertrend line on the weekly.
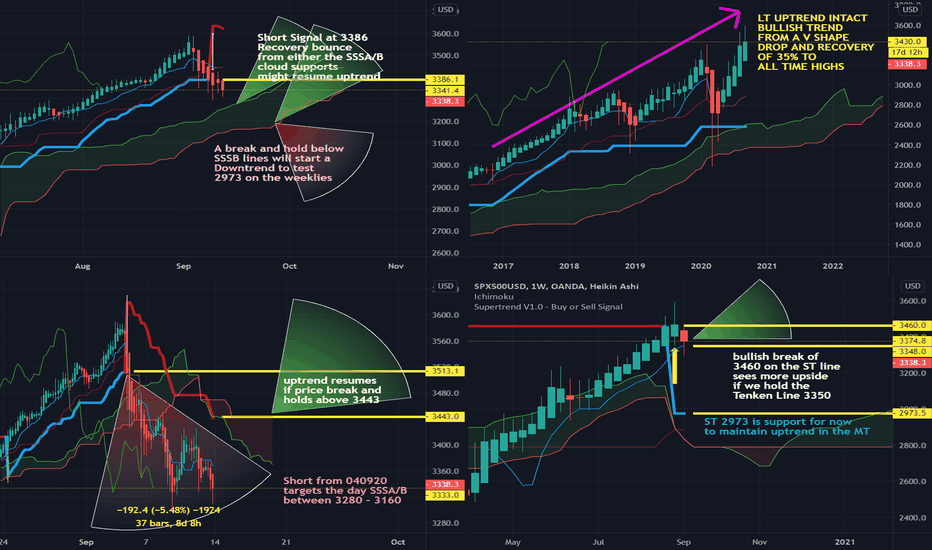
SPX UPDATE 140920 : SHORT TERM WEAKNESSShort term weakness on the SPX since the short signal on the 030920 continues to the new trading week of 150920 spanning 14 days. Short term support is now between 3150 - 3280.
A break of 3150 will see a corrective retreat on the weekly charts to 2973.
Alternatively, a break and hold above 3443 will resume the uptrend of the SPX on all time frames.
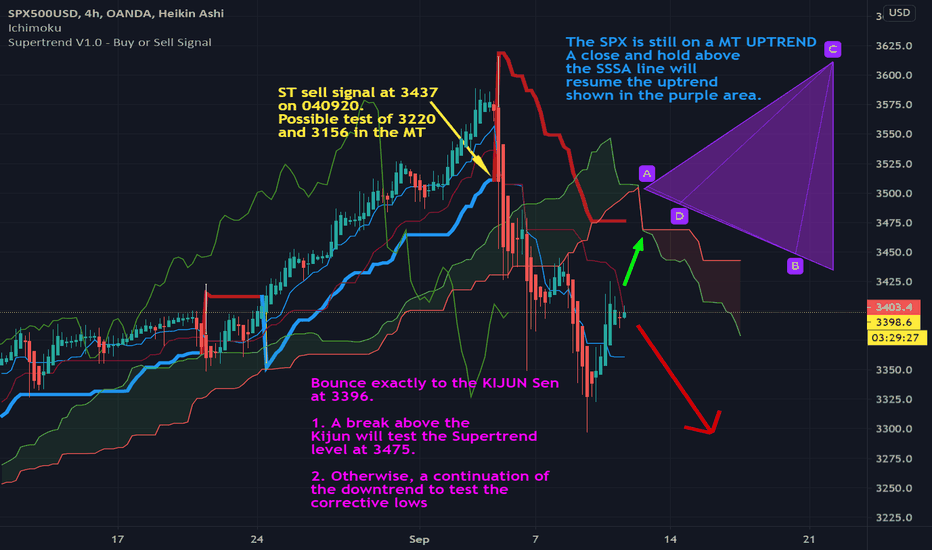
SPX REBOUNDS TO TEST 3475The SPX has Rebound of its intraday lows of the week on the 9th of Sep to the Kijun Sen on the 4hr charts at 3475.
This is a 50% retracement based on Ichimoku cloud indicators. Pivot will be at 3400. A close and hold above 3400 will test the Supertrend level at 3475 which is also above the SSSA line. A break below the pivot will see the retest of the week's corrective lows. The SPX is still on a medium term uptrend on the Medium and Long Term charts. A close a hold above 3475 into the purple trading area will resume the longer term uptrend.
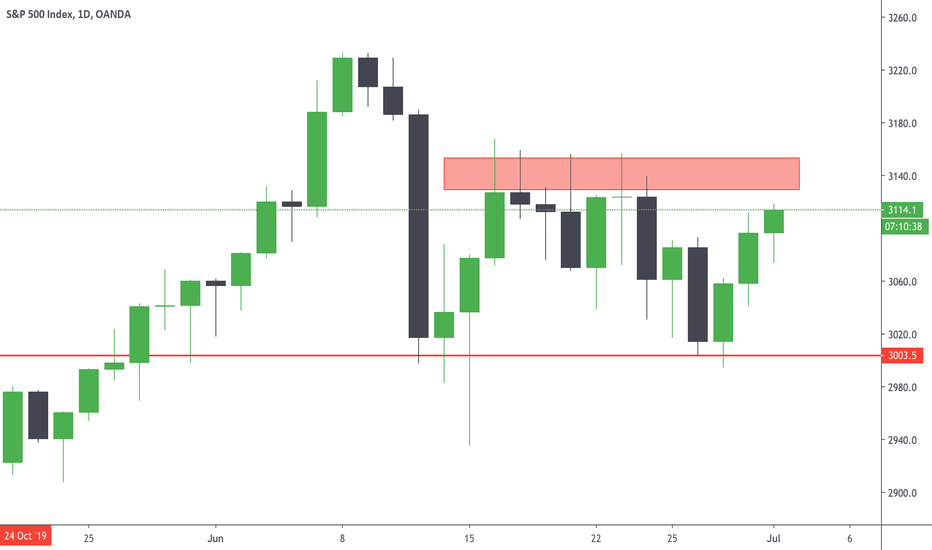
SPX500 - Looks good on daily but approaching resistanceStill looks good on daily, currently trying to rise.
I think there's a decent chance to see another with onto 3150 red zone this week (or even coming days).
Hit the "LIKE" button and follow to support, thank you.
Information is just for educational purposes, never financial advice. Always do your own research.
Are we seeing the start of a downtrend for SPX500? Are we seeing the start of a downtrend for SPX500?
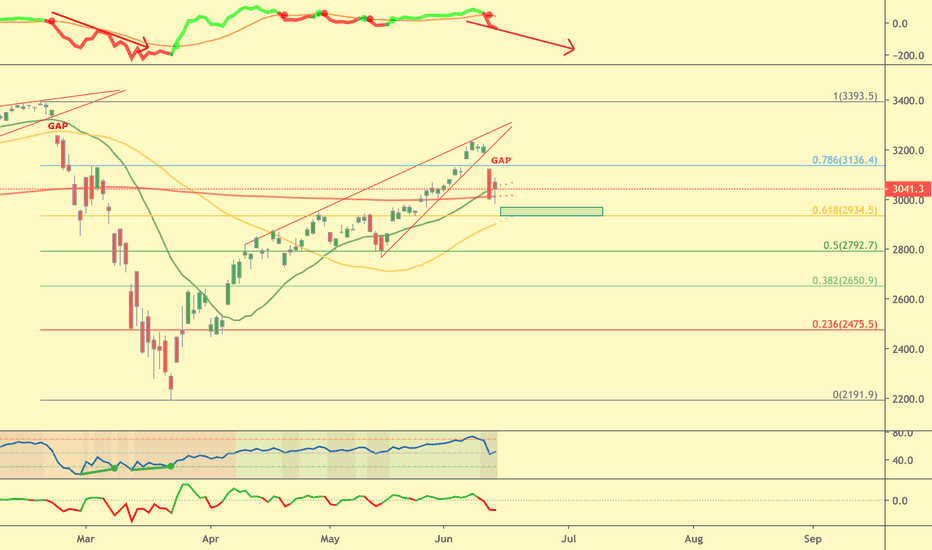
Last week, we broke out of the rising wedge and gapped down.
Currently, MACD, RSI, 2 Day "Rate of Change" and Filter wave are all showing bearish signals.
Therefore, I am leaning towards the market to go down.
If we close below 2934 (0.618 Fib retracement and 50 moving average),
it is a CONFIRMED downtrend for me.
Lastly, we cannot rule out sideways actions, it will not surprise me that we trade between the fib levels (2934 and 3136) for the next 5 days.
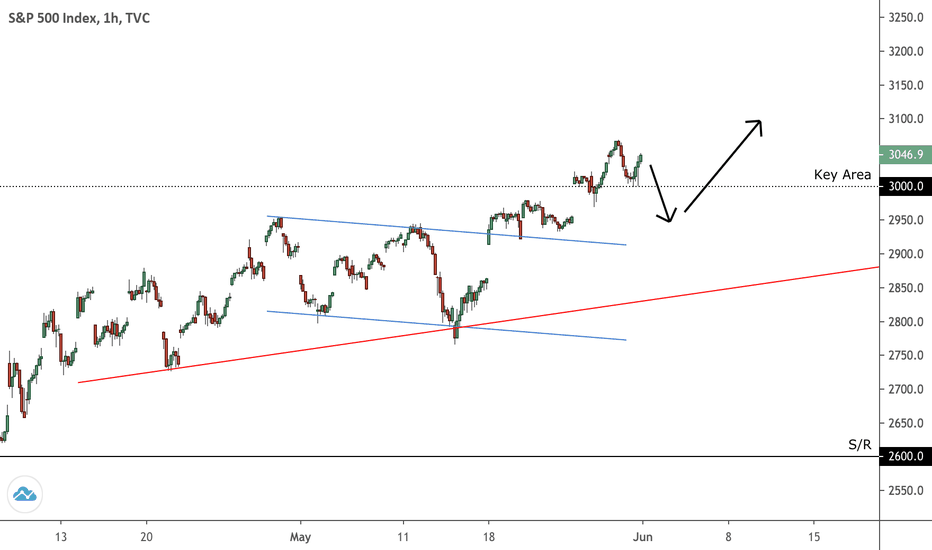
Will the BEARS continue to get CRUSHED? Price at Key Area!The TVC:SPX gained another 3.01% last week. Our view last week was that there was the potential for price decline to 2800 which would be a good area to go long. However the Bulls are clearly still very aggressive in this market and so we did not get that retest. More importantly price was able to close above the important level of 3000. I believe we may get a drop in price before a BULLISH continuation, this view is also supported by a monthly gain of 3.57%. This week I will be looking to add further positions in key buying areas.
S&P BULLISH BIAS & CONTINUATIONThe TVC:SPX rose 3.2% last week finally closing above the last previous high at around 2940. This indicates to me that there are still a lot of buyers in the market, the likelihood is that price will continue to make gains in the following weeks. If there is a decline in price, a good buying area (depending on price action) to jump onto the trend will be around the 2800 region.
My preference however is over the coming weeks too see if price is able to clear and retest the 3000 handle, if this becomes a reality this is where I will look to add some more positions.
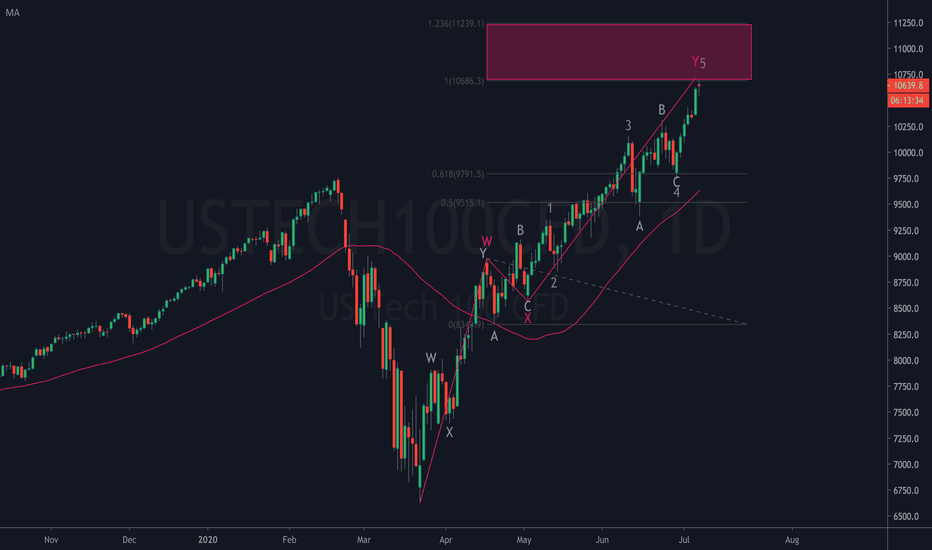
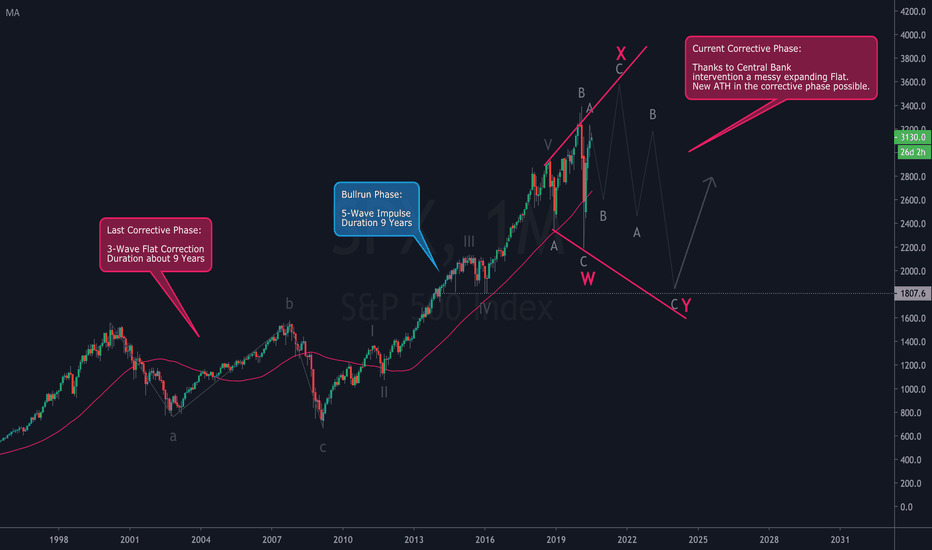
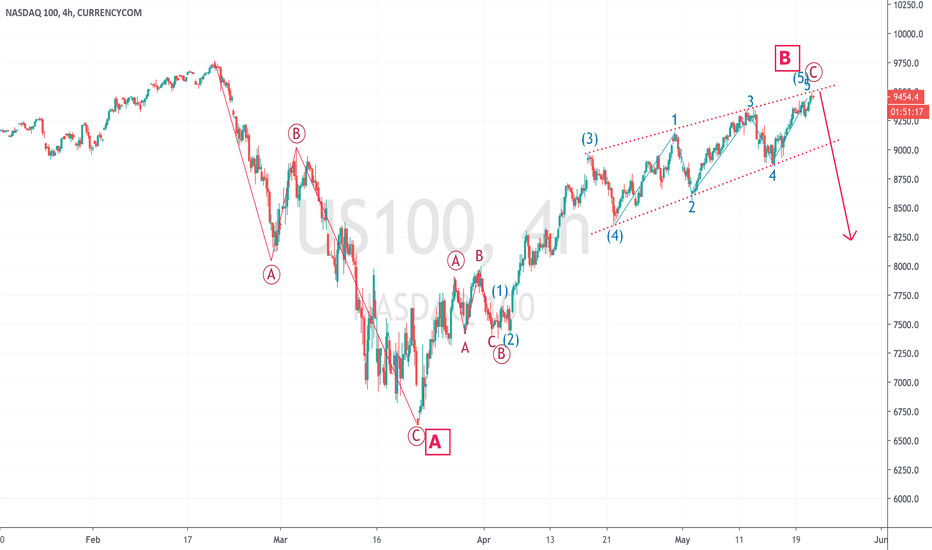
Is the "Big Short" coming now!? Here is a very bearish elliottwave count which possibly could play out as economic trembles from corona crises worsens. (Dont worry I have also other buillish counts which are possible, none the less this bearish one is for the moment not off the table). This scenario takes into account that new lower lows under the "corona" low are coming.
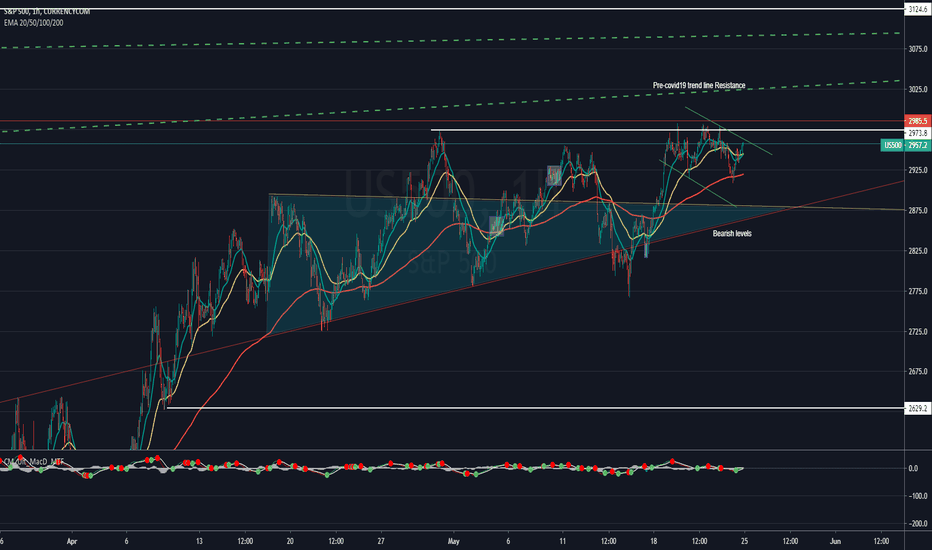
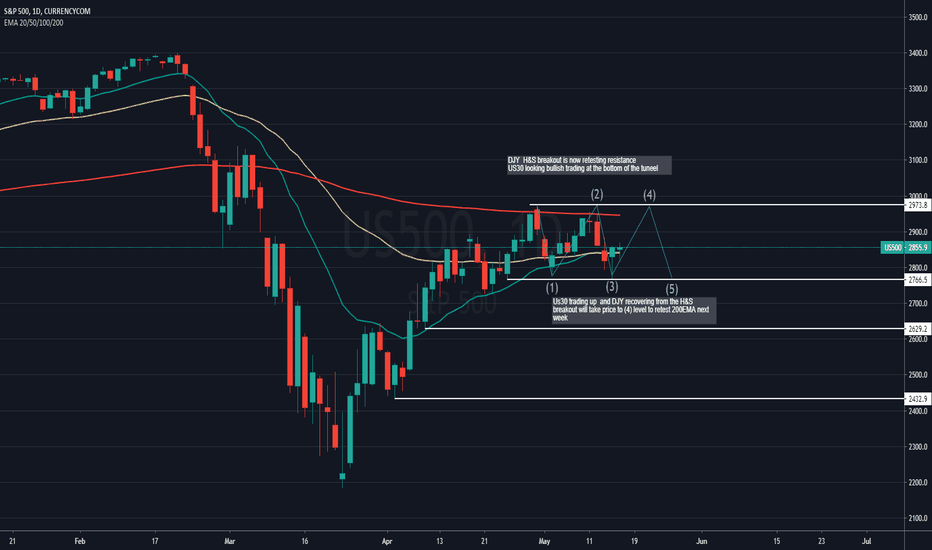
Sp500 idea Key points:
- DJY retesting after breakout
- Nasdaq trading at the bottom of a bullish flag
SP500;
if DJY confirms a down trend after retesting resistance at the breakout level we might see spx500 being dragged down otherwise this will bring Sp500 up to retest 200EMA again
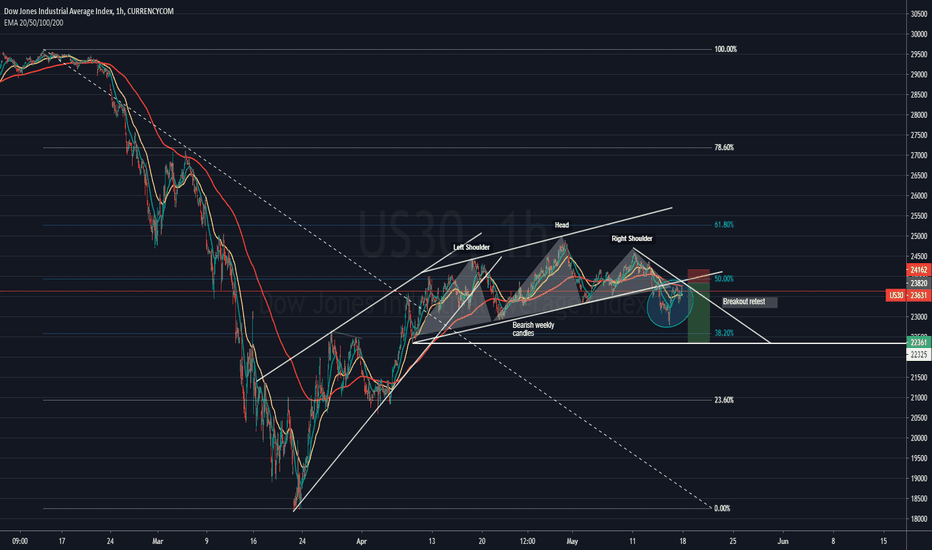
US30 - Dow Jones DJY short H&S breakout H&S breakout
price came up with secent bullish strength to retest
It's a good risk reward shorting opportunity at the resistance level
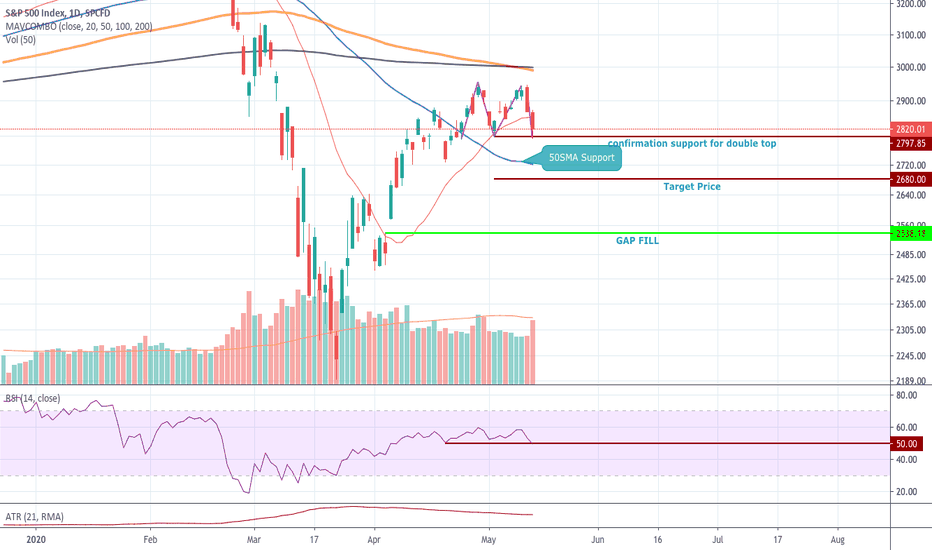
S&P 500 $SPX2797 is the confirmation support for double top. There is 50SMA support (2721) between target price and confirmation support. RSI is just below 50 and we don't it to go far away from 50 not to be in bearish side. and moro ever, there is gap (at 2538) waiting to be filled. so corona virus news will affect the direction of the market.
If you find my charts useful, please just leave me a "Like"
US Markets Defy gravity - S&P / DOW JONES Weekly Consideration S&P: If P action in the next week closes below the orange line at 2723.3 attention will turn more bearish and watch for market to fall to 2460.2. In this instance will reassess market dynamics as it may bounce in this range or continue to fall
Dow: The same flows for Dow Jones with P action in the next week close below the orange line at 22931.5 attention will turn more bearish and watch for market to fall to 20842.4. In this instance will reassess market dynamics as it may bounce in this range or continue to fall
If markets stay above these initial levels for the next 3 months (i’ll be surprised) however this will look like economies are back in order from COVID-19 and running ‘normal economics’
The above is a very basic observation at present as I scan charts. Larger write up to come, stay tuned.
(Print source set to close)
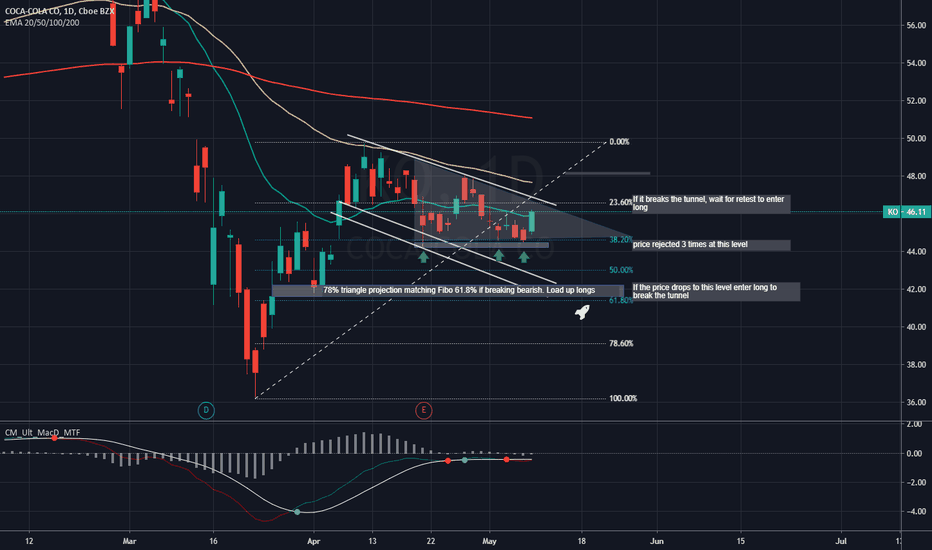
KO - Eyes open - Idea coca-colaAnother good opportunity
If the price gets rejected at the top we enter short towards to the 61.8% Fibo as it is breaking the triangle.
61.8% fibo range is the sweet spot to enter long if the above scenario happens.
In case we see a breakout of the tunnel before geting to 61.8%, wait to retest the tunnel confirming support to enter long.
