Crude Oil Futures: Navigating Geopolitical Risk and VolatilityMarket Context:
NYMEX:CL1! COMEX:GC1! CBOT:ZN1! CME_MINI:ES1! CME_MINI:NQ1! CME:6E1!
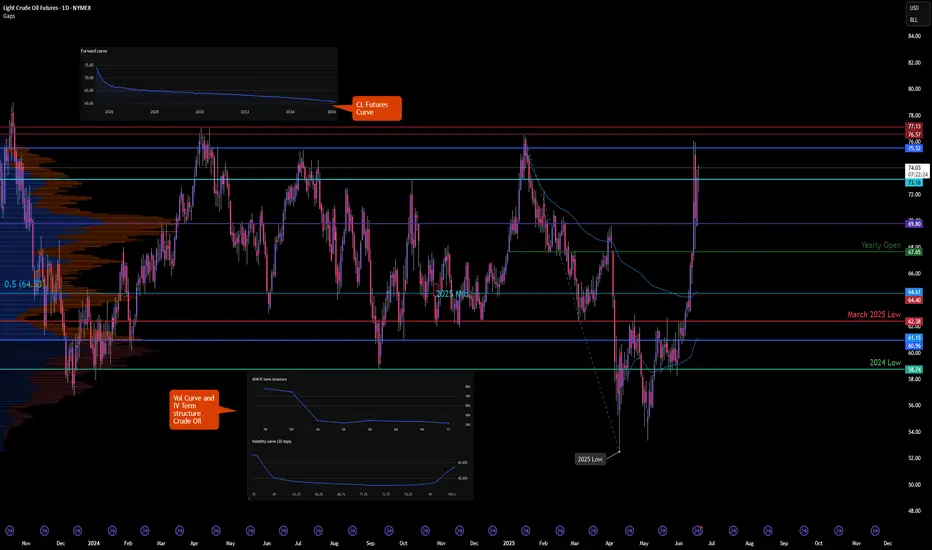
Implied volatility (IV) in the front weeks (1W and 2W) is elevated, and the futures curve is in steep backwardation. This indicates heightened short-term uncertainty tied to geopolitical tensions, particularly in the Middle East involving Iran and Israel. The forward curve, however, suggests the market is not fully pricing in sustained or escalating conflict.
We evaluate three possible geopolitical scenarios and their implications for the Crude Oil Futures market:
Scenario 1: Ceasefire Within 1–2 Weeks
• Market Implication: Short-term geopolitical premium deflates.
• Strategy: Short front-month / Long deferred-month crude oil calendar spread.
o This position benefits from a reversion in front-month prices once the risk premium collapses, while deferred months—already pricing more stable conditions—remain anchored.
o Risk: If the ceasefire fails to materialize within this narrow window, front-month prices could spike further, causing losses.
Scenario 2: Prolonged War of Attrition (No Ceasefire, Ongoing Missile and Air War)
• Market Implication: Front-end volatility may ease slightly but remain elevated; deferred contracts may begin to price in more geopolitical risk.
• Strategy: Long back-month crude oil futures.
o The market is currently underpricing forward-looking risk premiums. A persistent conflict, even without full-scale escalation, may eventually force the market to adjust deferred pricing upward.
o Risk: Time decay and roll costs. Requires a longer holding horizon and conviction that the situation remains unresolved and volatile.
Scenario 3: Full-Scale Regional War
• Market Implication: Severe market dislocation, illiquidity, potential for capital flight, and broad-based risk-off sentiment across global assets.
• Strategy: Avoid initiating directional exposure in crude. Focus on risk management and capital preservation.
o In this tail-risk scenario, crude oil could spike sharply, but slippage, execution risk, and potential exchange halts or liquidity freezes make it unsuitable for new exposure.
o Alternative Focus: Allocate to volatility strategies, defensive hedging (e.g., long Gold, long VIX futures), and cash equivalents.
o Risk: Sudden market shutdowns or gaps may make exit strategies difficult to execute.
Broader Portfolio Considerations
Given the crude oil dynamics, there are knock-on effects across other markets:
• Gold Futures: Flight-to-safety bid in Scenarios 2 and 3. Long positioning in Gold (spot or near-month futures) with defined stop-loss levels is prudent as a hedge.
• Equity Index Futures (E-mini Nasdaq 100 / S&P 500): Vulnerable to risk-off flows in Scenarios 2 and 3. Consider long volatility (VIX calls or long VX futures) or equity index puts as portfolio hedges. In Scenario 1, equities could rally on resolution optimism—especially growth-heavy Nasdaq.
• Currency Futures: USD likely to strengthen as a safe haven in Scenarios 2 and 3. Consider long positions in Dollar and Short 6E futures.
• Bond Futures: Risk-off flows theoretically should support Treasuries in Scenarios 2 and 3. Long positions in 10Y or 30Y Treasury futures could serve as a defensive allocation. Yields may retrace sharply lower if escalation intensifies. However, given the current paradigm shift with elevated yields, higher for longer rates and long end remaining high, we would not bet too heavily on Bond futures to act as safe haven. Instead, inflows in Gold, strengthening of Chinese Yuan and Bitcoin will be key to monitor here.
Scenario-based planning is essential when markets are pricing geopolitical risk in a non-linear fashion. Crude oil currently reflects a consensus expectation of de-escalation (Scenario 1), which opens the door for relative value and mean-reversion strategies in the front-end of the curve.
However, given the asymmetric risks in Scenarios 2 and 3, prudent exposure management, optionality-based hedges, and a flexible risk framework are imperative. A diversified playbook; leveraging volatility structures, calendar spreads, and cross-asset hedges offers the best path to opportunity while managing downside risk.
Crude Oil WTI
WTI(20250618)Today's AnalysisMarket news:
World Gold Council: 95% of central banks expect gold reserves to rise in the next 12 months.
Technical analysis:
Today's buying and selling boundaries:
72.29
Support and resistance levels:
76.53
74.95
73.92
70.66
69.63
68.04
Trading strategy:
If the price breaks through 73.92, consider buying, the first target price is 74.95
If the price breaks through 72.29, consider selling, the first target price is 70.66
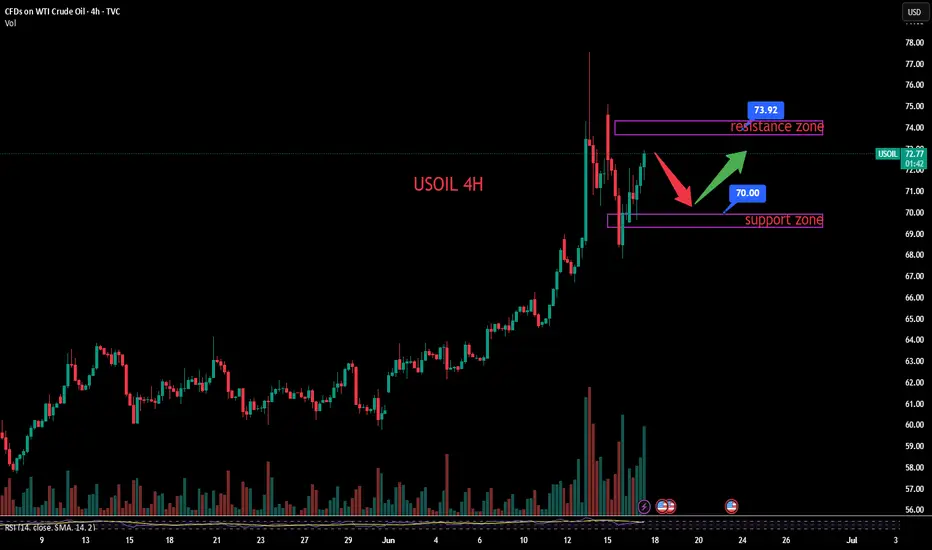
USOIL:Go short before you go long
The idea of crude oil is still to go long. Today, the more appropriate entry point is 72-72.3, there is still a little space at present, if you consider selling short first, then the more appropriate short point is 73-73.3 range. Give to the point to do, to wait to do more.
Trading Strategy:
SELL@73-73.3
TP: 72-72.3
BUY@72-72.3
TP: 73.7-74
↓↓↓ More detailed strategies and trading will be notified here ↗↗↗
↓↓↓ Keep updated, come to "get" ↗↗↗

USOIL BEARS WILL DOMINATE THE MARKET|SHORT
USOIL SIGNAL
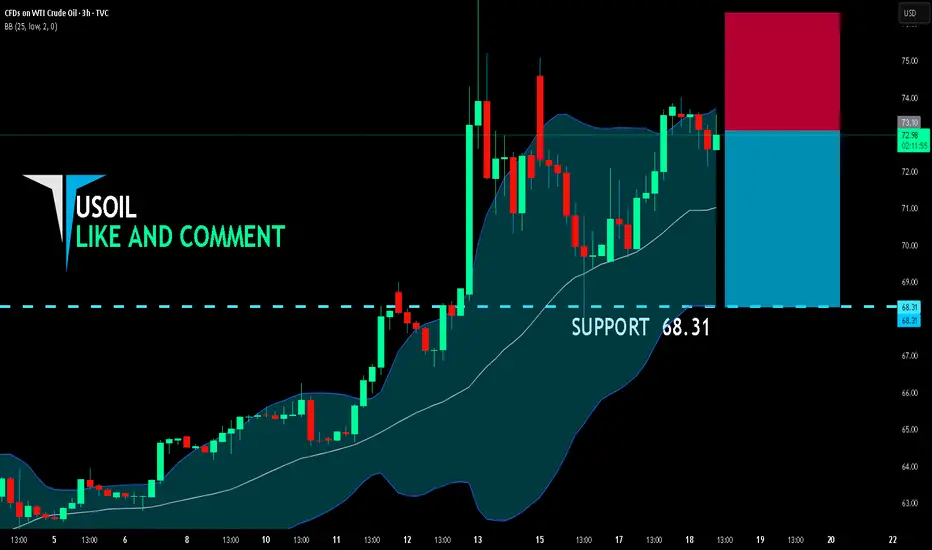
Trade Direction: short
Entry Level: 73.10
Target Level: 68.31
Stop Loss: 76.29
RISK PROFILE
Risk level: medium
Suggested risk: 1%
Timeframe: 3h
Disclosure: I am part of Trade Nation's Influencer program and receive a monthly fee for using their TradingView charts in my analysis.
✅LIKE AND COMMENT MY IDEAS✅
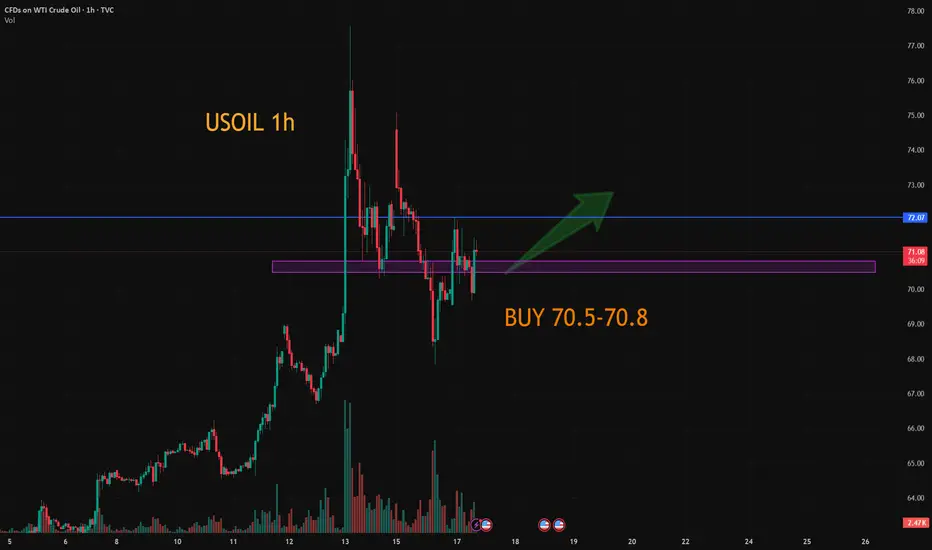
USOIL:A long trading strategy
Oil prices also fell sharply under the stimulus of the news, and then completed the correction rebound in the sub-session, and now back to around 71 again. The current trend is in the upward rhythm of the main trend, and it is expected that the trend of crude oil will be mainly in the form of shock consolidation.
Trading ideas than yesterday did not change too much, adjust the appropriate profit point.
Trading Strategy:
BUY@70.5-70.8
TP: 71.8-72.3
↓↓↓ More detailed strategies and trading will be notified here ↗↗↗
↓↓↓ Keep updated, come to "get" ↗↗↗
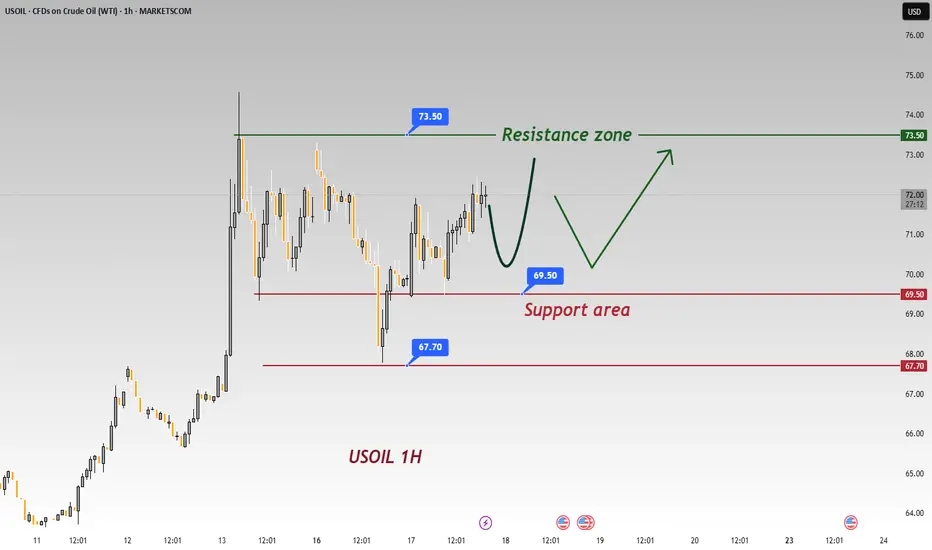
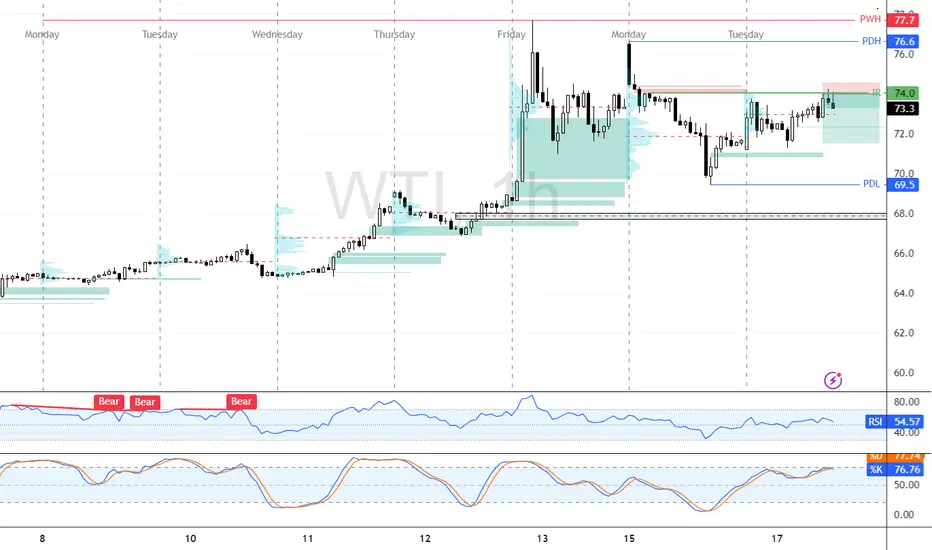
USOIL 1 - Hour Chart AnalysisUSOIL 1 - Hour Chart Analysis
Key Levels
Support: ~69.50 (short - term), 67.70 (critical backup).
Resistance: 73.50 (major hurdle, tested before).
Trend, Pattern & Middle East Conflict
Price oscillates between support/resistance, with a potential “V - shaped reversal”. Middle East conflicts add high uncertainty:
Escalation: Fears of supply cuts could push price above 73.50 rapidly.
De - escalation: May pressure price down, but 67.70/69.50 still get support from lingering supply - risk worries.
Trading Strategies
Bullish: If 69.50 holds (e.g., long lower shadows/bullish candles), small - size long. Target 73.50; stop - loss ~69.20. Watch for sudden conflict news.
Bearish: If 69.50 breaks (consecutive closes below), short. Target 67.70; stop - loss ~69.80. Stay alert to conflict updates.
Note: Oil prices hinge on supply - demand, Middle East tensions, and the USD. Combine tech/fundamental analysis; manage risk strictly.
⚡️⚡️⚡️ USOil ⚡️⚡️⚡️
🚀 Buy@ 70.50 - 71.00
🚀 TP 73.00 - 74.00
Accurate signals are updated every day 📈 If you encounter any problems during trading, these signals can serve as your reliable guide 🧭 Feel free to refer to them! I sincerely hope they'll be of great help to you 🌟 👇
US-Iran war or peace?Oil options are more bullish now than they were just after the outbreak of the Russia-Ukraine conflict in 2022, indicating that global markets are on edge over the confrontation between Israel and Iran, and speculation that the United States may join the attack.
As of Tuesday's close, the premium of Brent crude call options relative to put options was the widest since 2013. As the turnover of option contracts has been higher than usual in recent days, a measure of implied volatility has also risen sharply.
The war between Israel and Iran has raised concerns that crude oil export infrastructure could be targeted, which could curb supply and trigger a price surge. On Wednesday, Brent crude oil prices approached $76 a barrel, having previously hit a new high since the conflict broke out in January.
According to ABC, US officials said that the next 24 to 48 hours will be critical and will determine whether the Israeli-Iranian issue can be resolved through diplomatic means or whether Trump will take military action.
Trump summoned his senior advisers in the White House Situation Room on Tuesday. Trump significantly stepped up his rhetoric against the Iranian regime ahead of the meeting, claiming that the United States knew exactly where Khamenei was hiding.
Despite the apparent saber rattling, U.S. negotiators on Tuesday believed Iran was in a weak position and could be forced to return to the table and ultimately accept a deal that would require it to abandon all nuclear enrichment, according to multiple officials involved in the diplomatic process.
The Iranian regime has indicated a willingness to resume discussions with the United States as Iran and Israel trade blows, the officials said, adding that the Trump administration has been seeking more concrete commitments before abandoning its path to war.
If Iran returns to the talks and agrees to abandon uranium enrichment, U.S. officials see a potential high-level meeting led by special envoy Steve Witkoff and Vice President J.D. Vance as soon as this week.
But such a scenario would likely require Iran to act quickly. Trump has acknowledged that his patience with the situation in the Middle East is wearing thin.
Sources familiar with Trump's mindset say he is frustrated by the volatile situation in Iran and the inability to provide the administration with immediate answers, and he seems very reluctant to see Tehran successfully send him a military warning.
The U.S. military is already moving assets to the region, including additional aircraft, a second aircraft carrier and its strike group to the Middle East. Officials say all of these moves are defensive.
Defense Secretary Pete Hegseth spoke about the U.S. posture in the Middle East in an interview with Fox News on Monday, saying, "We are strong, we are ready, we are defensive and we are present."
But while the redeployment of assets is intended to protect the roughly 40,000 U.S. troops stationed in the region, it also leaves options open for the Trump administration if it decides to directly assist Israel's ongoing offensive operations against Iran.
"Our job is to keep options on the table, but our posture remains defensive," one U.S. official said.
One major question is whether the U.S. will deploy B-2 stealth bombers. The heavy strategic bomber is capable of carrying 30,000 pounds of mass destruction and may be able to destroy Iran's deep underground nuclear facility at the Fordow Fuel Enrichment Plant.
Currently, the military's 19 B-2 bombers are based at Whiteman Air Force Base in Missouri. Six of the planes were previously based at an air base on Diego Garcia in the Indian Ocean — closer to Iran. But those bombers were replaced by B-52 long-range bombers that can’t carry the bunker-busting bombs needed to destroy Fordow.
There are already about a dozen U.S. Navy ships patrolling near Bahrain’s territorial waters, according to a U.S. Defense Department official. The ships have no official mission, the official said. They include a littoral combat ship, four minesweepers and six surface patrol boats.
The Navy also has two destroyers, an aircraft carrier in the Red Sea and three other surface ships in the Arabian Sea. Two more U.S. destroyers are stationed in the eastern Mediterranean, each equipped with a missile defense system capable of shooting down Iranian ballistic missiles.
Signs that the Trump administration may be moving toward military action could include canceling the president’s planned trip to the Netherlands next week for a NATO summit.
At a news conference on Tuesday, State Department spokeswoman Tammy Bruce said the summit was still "on the table," but she said things could change depending on dynamics with Iran.
"Things are moving very quickly. So I think anything is possible," she said. TVC:USOIL MARKETSCOM:USOIL SWISSQUOTE:USOILN2025 TVC:USOIL
WTI Oil H1 | Falling toward a pullback supportWTI oil (USOIL) is falling towards a pullback support and could potentially bounce off this level to climb higher.
Buy entry is at 73.31 which is a pullback support that aligns with the 38.2% Fibonacci retracement.
Stop loss is at 70.90 which is a level that lies underneath a swing-low support and the 61.8% Fibonacci retracement.
Take profit is at 77.60 which is a swing-high resistance.
High Risk Investment Warning
Trading Forex/CFDs on margin carries a high level of risk and may not be suitable for all investors. Leverage can work against you.
Stratos Markets Limited (tradu.com ):
CFDs are complex instruments and come with a high risk of losing money rapidly due to leverage. 63% of retail investor accounts lose money when trading CFDs with this provider. You should consider whether you understand how CFDs work and whether you can afford to take the high risk of losing your money.
Stratos Europe Ltd (tradu.com ):
CFDs are complex instruments and come with a high risk of losing money rapidly due to leverage. 63% of retail investor accounts lose money when trading CFDs with this provider. You should consider whether you understand how CFDs work and whether you can afford to take the high risk of losing your money.
Stratos Global LLC (tradu.com ):
Losses can exceed deposits.
Please be advised that the information presented on TradingView is provided to Tradu (‘Company’, ‘we’) by a third-party provider (‘TFA Global Pte Ltd’). Please be reminded that you are solely responsible for the trading decisions on your account. There is a very high degree of risk involved in trading. Any information and/or content is intended entirely for research, educational and informational purposes only and does not constitute investment or consultation advice or investment strategy. The information is not tailored to the investment needs of any specific person and therefore does not involve a consideration of any of the investment objectives, financial situation or needs of any viewer that may receive it. Kindly also note that past performance is not a reliable indicator of future results. Actual results may differ materially from those anticipated in forward-looking or past performance statements. We assume no liability as to the accuracy or completeness of any of the information and/or content provided herein and the Company cannot be held responsible for any omission, mistake nor for any loss or damage including without limitation to any loss of profit which may arise from reliance on any information supplied by TFA Global Pte Ltd.
The speaker(s) is neither an employee, agent nor representative of Tradu and is therefore acting independently. The opinions given are their own, constitute general market commentary, and do not constitute the opinion or advice of Tradu or any form of personal or investment advice. Tradu neither endorses nor guarantees offerings of third-party speakers, nor is Tradu responsible for the content, veracity or opinions of third-party speakers, presenters or participants.

The best opportunity is when crude oil falls
💡Message Strategy
Crude oil futures fell in the European session on Monday (June 16), giving up earlier gains, as a new round of hostilities between Israel and Iran had limited impact on oil production and exports.
WTI briefly rebounded to $77.49, close to last week's high, which was also our second profit target, but failed to break through the key resistance level near $78.09.
Oil prices surged 7% on Friday, driven by geopolitical risks, pushing crude to its highest level since January. However, Monday's reversal reflected the lack of immediate threats to supply routes, especially the strategically important Strait of Hormuz.
If Iran's production drops sharply due to the conflict, the global oil supply buffer will be quickly exhausted and oil prices may usher in a new round of surges. Faced with this complex situation, investors, oil-producing countries and consumers need to be prepared to meet the possible energy storm.
This is also the reason why we repeatedly emphasize that crude oil should be long when it falls. We can foresee its upward momentum, and the pullback is only in a moment without any signs.
📊Technical aspects
The short-term (1H) trend of crude oil continued to fluctuate upward, and the price near 74 was tested. The moving average system relies on the bullish arrangement of oil prices, and the short-term objective trend direction remains upward.
In the morning, the oil price hit a new high near 75.30, and then fell back and closed with a negative real candlestick. The short-term momentum is still bullish, and it is expected that the trend of crude oil will continue to maintain a high-level oscillating upward rhythm.
💰 Strategy Package
Long Position:69.50-70.50
The first target is around 73.00
The second target is around 75.00

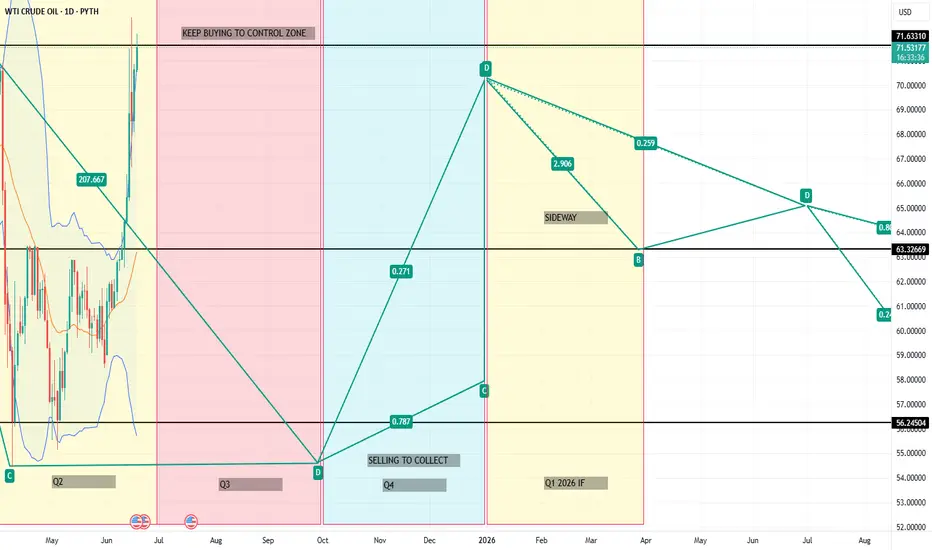
WADZ & the Petrodollar RevivalGlobal FX Shift: The Rise of WADZ (2025–2026)
In mid-2025, a war between Iran and Israel spirals fast. Iran strikes hard, Israel’s defenses go offline from cyberattacks, and the U.S. surprisingly doesn’t intervene.
Instead, America steps in quietly, setting up a “peacekeeping” zone along the Jordan-Israel border. It’s called the West Asia Demilitarized Zone (WADZ) — but behind the scenes, it’s about control, not peace.
Oil jumps to $115.
Markets flip. USD/JPY and USD/TRY spike. EUR/USD slides.
Then the U.S. launches WZ-Digital, a USD-backed oil coin. Now, all oil in the region trades through America.
OPEC fractures. Saudi and UAE fall in line.
China gets iced out. USD/CNY shoots past 8.30.
In the desert, a secret U.S. city appears: The Watchtower — a hub that manages oil, data, and borders.
Regional FX Snapshot (2026)
Europe: Gas crisis deepens. EUR/USD drops to 0.95. East Europe leans on U.S.
China: Crypto-oil push fails. Capital flight triggers USD/CNY → 8.80.
Russia: Oil-for-yuan helps short-term, but ruble stays shaky.
Africa: Egypt & Morocco adopt WZ-Digital. Local currencies stay weak.
Southeast Asia: Dual oil trade (USD/WZ). SGD steady, MYR & IDR choppy.
(BRICKS+)
Latin America: Brazil, Argentina resist — then cave. USD demand surges.
Bottom Line:
By end of 2026, USD isn’t just money — it’s a global system.
WADZ quietly reprograms the rules of energy and trade.
No invasion, no headlines. Just quiet, total control.
Bye guys
USOIL:Sharing of the Latest Trading StrategyAll the trading signals today have resulted in profits!!! Check it!!!👉👉👉
Fundamental Analysis:
While Middle East tensions have temporarily eased, the risk of Iran threatening to blockade the Strait of Hormuz persists. An escalation could drive oil prices higher.
The U.S. sustained economic strength provides some support for oil prices.
U.S. retail data and crude oil API inventory changes to be released today may impact oil prices.
Technical Analysis :
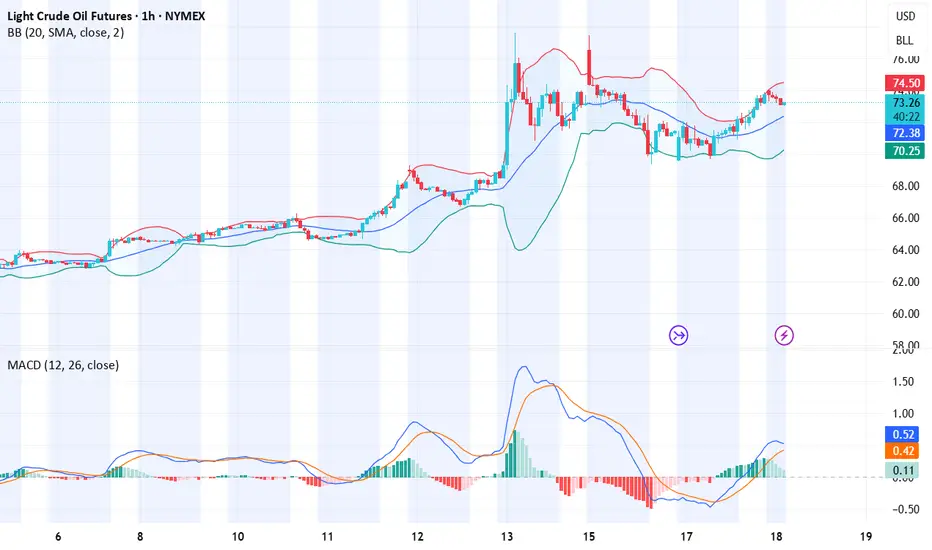
Bollinger Bands: Middle band at 73.92, upper band at 76.81, lower band at 70.42. Current price at 72.77 is near the lower band, showing signs of support.
With reference to June 5 and prior data, the MACD previously formed a death cross. Although no latest data is available, combined with price action, it may still be in a bearish trend.
Trading Strategy:
Consider long positions after a pullback to near 70.42 (strong support), targeting around 73.92.
If price effectively breaks through 73.92, chase long positions with a further target near 76.81.
buy@70-70.5
TP:73-74
Share accurate trading signals daily—transform your life starting now!
👇 👇 👇 Obtain signals👉👉👉
Oil Eyes $90+ as U.S.–Iran Conflict LoomsWTI Crude Oil — Bullish Reversal in Play as War Risk Escalates
Technical & Geopolitical Outlook — Weekly Chart | 17 June 2025
🧭 Current Market Condition:
WTI crude oil is breaking out of a multi-month falling wedge, a classically bullish reversal pattern, after bouncing from the $67–68 support region. This technical move is further amplified by rising geopolitical tensions in the Middle East, particularly fears of a potential U.S. military strike on Iran, which would threaten global oil supply routes through the Strait of Hormuz.
The current breakout attempt aligns with a sentiment shift from oversold to recovery mode, supported by a sharp rise in weekly momentum indicators.
📊 Key Technical Highlights:
Bullish Falling Wedge Breakout: Price breaking above descending resistance.
Key Resistance Levels:
$76.67 – immediate supply zone
$92.82 – prior breakout area; major target if breakout sustains
Key Support Levels:
$71.28 – breakout retest level
$67.00–$68.00 – wedge base, strong historical support
$52.00 – longer-term bearish invalidation (unlikely unless demand collapses)
Momentum: Weekly stochastic sharply rising from bottom, signaling strength building.
🔺 Bullish Scenario — If U.S. Attacks Iran:
If the U.S. carries out military strikes on Iranian targets, oil prices are highly likely to:
Price in geopolitical risk premium of $10–$20/barrel.
Spike toward $90–$100 range within days or weeks due to:
Fears of supply disruption (Hormuz choke point)
Panic buying and short covering
Strategic reserves hoarding
Technical Targets:
$76.67 → Break above confirms bullish continuation
$92.82 → First major upside target
$100–$110 → Stretch target if conflict escalates or prolongs
🛢️ Energy traders and institutions typically front-run geopolitical escalations, so price can jump before any physical conflict if tensions remain unresolved or rhetoric intensifies.
🔻 Bearish Scenario — Fake Breakout or De-escalation:
Rejection from $76.67 or failure to hold above $71.28 can trigger pullbacks.
If tensions cool and Iran conflict is diplomatically diffused:
WTI may slide back toward $68.00 and re-enter the wedge.
Below $67.00, oil could revisit $60–$52 range in a risk-off macro environment.
🛡️ Risk Management & Outlook:
Geopolitical events can override technicals, especially in commodities.
Gaps, whipsaws, and sharp reversals are common — caution with overnight positions.
Consider hedging strategies or limited-risk option plays if trading leveraged oil instruments.
📢 If you found this analysis valuable, kindly consider boosting and following for more updates.
⚠️ Disclaimer: This content is intended for educational purposes only and does not constitute financial advice.

WTI above $75 on fears of US involvement in Israel-Iran conflictThe Israel-Iran situation is quite different this time and with Trump announcing that *we* now have full control over Iranian skies, suggesting the US is entering the fray – hardly a surprise to be honest - this is not going to end well. The conflict may get far worse in the short-term, and this will send shockwaves through the oil markets – especially if there are disruptions in the Strait of Hurmuz. Oil prices could easily spike to $100 and higher in the worst-case scenario. So, the situation is quite serious, unfortunately. Let's hope that it quickly de-escalates and lives are not lost.
But make no mistake, this could get really big - especially with headlines like these coming out in the last few minutes:
*US OFFICIALS SAY TRUMP 'SERIOUSLY CONSIDERING' STRIKE ON IRAN: AXIOS;
*TRUMP TO MAKE POLICY DECISION ON ISRAEL-IRAN: AXIOS
*IRAN WILL SOON LAUNCH 'PUNITIVE' OPERATION AGAINST ISRAEL: IRNA
The picture is looking quite grim, unfortunately.
by Fawad Razaqzada, market analyst with FOREX.com
Brent and WTI: Is $100 oil just Around the corner?#Brent and #WTI prices are steadily climbing, now reaching $73.30 and $71.15 per barrel. The market is showing strong signs of an upward trend, similar to what we saw in 2021–2022. With global demand picking up and increased interest from major market participants, analysts believe prices could soon push past the $100 mark — especially amid ongoing global tensions and rising consumption.
Standard Chartered forecasts Brent reaching $95 by December 2025, while some outlooks go even higher. What’s fueling this potential rally? Top 5 reasons oil may surge in the coming months:
Global instability : Tensions in the Middle East and unrest in key producers like Venezuela and Nigeria raise concerns about supply disruptions. Any flare-ups could push prices to $90, $95 — or beyond.
Economic recovery : Asia and developing economies are bouncing back fast. With industrial activity rising, so does energy demand — including for oil.
OPEC+ tight supply policy : OPEC+ is likely to maintain production cuts to support prices and keep the market balanced.
Low reserves, limited expansion : Stockpiles remain tight, and exploration has lagged in recent years. If demand spikes, producers may struggle to scale output quickly.
Aviation and petrochemicals rebound : Global air traffic and plastic manufacturing are growing, increasing demand for jet fuel and oil-based feedstocks.
Together, these factors create a strong setup for upward momentum in Brent and WTI prices. According to FreshForex analysts , the current levels could mark the beginning of a new growth cycle.

Crude Oil Tests $74FenzoFx—Crude Oil climbed to $74.0, testing the bearish Fair Value Gap and a high-volume zone.
The Stochastic Oscillator signals an overbought market, suggesting possible consolidation. Oil could dip toward the previous daily low if $74.0 holds as resistance during the NY session.
A breakout above $74.0 would invalidate the short-term bearish outlook.
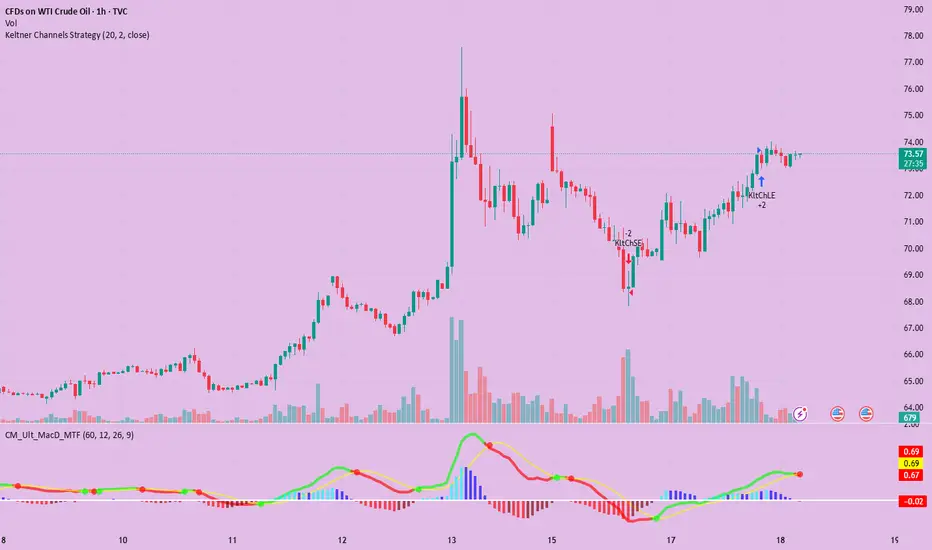
The latest long - short trading recommendations for crude oil.On Monday, the two benchmark oil prices fell by more than 1% due to media reports that Iran might seek to ease the situation. However, the market's short-term optimism proved unsustainable. Currently, oil price movements are driven primarily by geopolitics rather than fundamentals. Market sensitivity to the Middle East situation has surged to an extremely high level, with even the slightest development triggering violent volatility. The possibility of supply disruptions remains high in the short term, and close attention should be paid to Iran's oil export trends and the actual execution of OPEC+ after its meeting. Meanwhile, be wary of the risk of sharp consolidation amid mixed geopolitical and negotiation news.
In terms of momentum, the fast and slow lines of the MACD indicator have crossed below the zero axis, forming a golden cross with an upward divergence, indicating a stalemate between bullish and bearish momentum. In terms of patterns, a flag continuation pattern has emerged, with penetration of the upper edge of the flag, and the overall trend is in a secondary rhythm. It is expected that crude oil prices will mainly fluctuate and consolidate within the pattern.
you are currently struggling with losses,or are unsure which of the numerous trading strategies to follow,You have the option to join our VIP program. I will assist you and provide you with accurate trading signals, enabling you to navigate the financial markets with greater confidence and potentially achieve optimal trading results.
Trading Strategy:
buy@70.0-71.0
TP:74.0-75.0
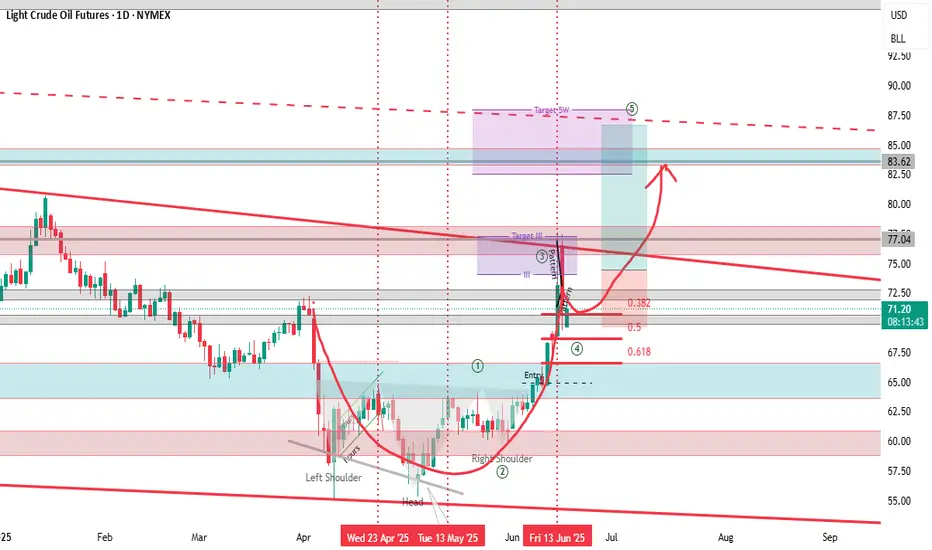
Crude Oil - Cup and HandlePotential Cup and Handle
I have a trigger upper the top .. potential short before the new long wave
Actual we can have completed the 3 of 5.
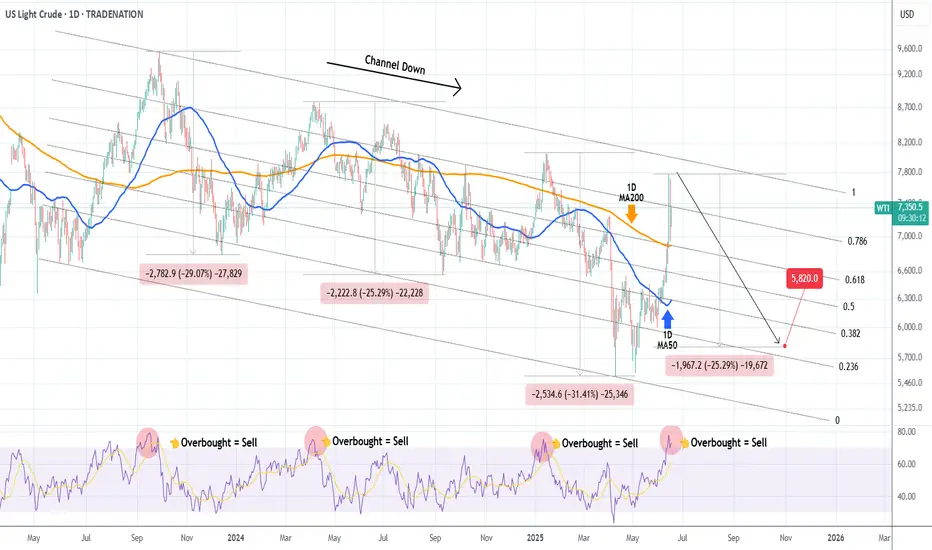
WTI OIL Overbought RSI = best time to sell!WTI Oil (USOIL) has been trading within a 2-year Channel Down pattern and due to the recent Middle East geopolitical tensions, the price catapulted near its top (Lower Highs trend-line).
That made the 1D RSI overbought (>70.00) and every time that took place since September 2023, the pattern priced its Lower High and started a Bearish Leg. As a result, an overbought 1D RSI reading has been the strongest sell signal in the past 2 years.
The 'weakest' Bearish Leg after such sell signal has been -25.29%. As a result, we have turned bearish on WTI again, targeting $58.20 (-25.29%).
-------------------------------------------------------------------------------
** Please LIKE 👍, FOLLOW ✅, SHARE 🙌 and COMMENT ✍ if you enjoy this idea! Also share your ideas and charts in the comments section below! This is best way to keep it relevant, support us, keep the content here free and allow the idea to reach as many people as possible. **
-------------------------------------------------------------------------------
Disclosure: I am part of Trade Nation's Influencer program and receive a monthly fee for using their TradingView charts in my analysis.
💸💸💸💸💸💸
👇 👇 👇 👇 👇 👇
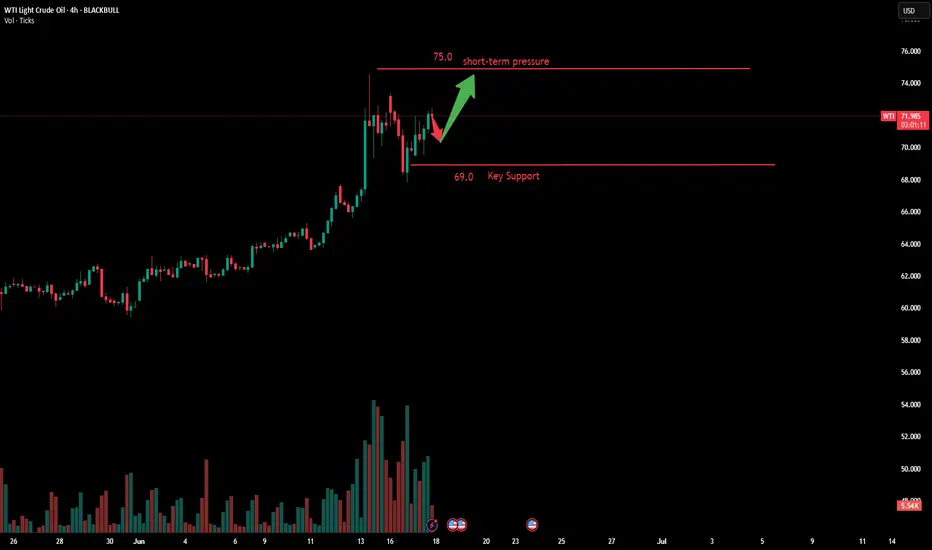
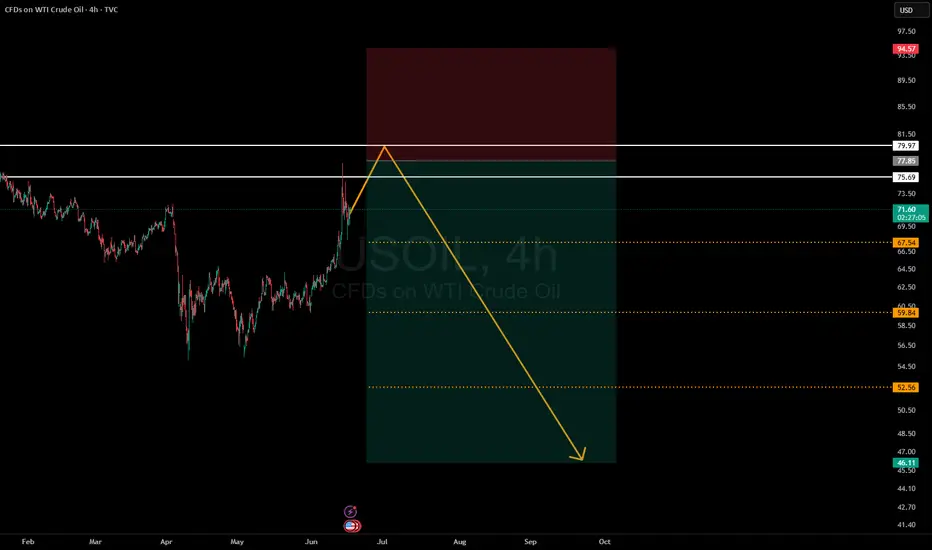
Oil Surges on Israel-Iran Nuclear Strike Fears🛢️ Israel’s attacks on Iran’s nuclear sites are pushing oil ( BLACKBULL:WTI , BLACKBULL:BRENT ) higher!
Bloomberg reports Trump’s G-7 exit and Tehran evacuation warning as Israel-Iran strikes intensify (June 17, 2025). Analysts warn of Strait of Hormuz risks, with 17M barrels/day at stake.
4H Chart Analysis:
Price Action: WTI ( BLACKBULL:WTI ) broke $75 resistance (June 2025 high), exiting a 3-week range. Brent ( BLACKBULL:BRENT ) mirrors at $78.
Volume: 4H volume spiked 15% vs. prior week, confirming breakout buying.
Key Levels:
Current Support: $75 (WTI), $78 (Brent) – former resistance, now support.
Next Support: $73 (WTI), $76 (Brent) – prior range lows, tested twice in June.
Context: Oil gained 2% this week, driven by Middle East supply fears, with WTI at a 1-month high.
Trading Insight: The $75/$78 breakouts signal bullish momentum. $73-$76 is a key support zone for dips. Watch Iran retaliation news and volume for supply disruption clues.
What’s your 4H oil trade? Post your setups! 👇 #OilPrice #WTI #Brent #IsraelIran #TradingView

CL Futures Weekly Trade Setup — June 17, 2025🛢️ CL Futures Weekly Trade Setup — June 17, 2025
🎯 Instrument: CL (Crude Oil Futures)
📉 Strategy: Short Swing
📅 Entry Timing: Market Open
📈 Confidence: 68%
🔍 Model Insights Recap
🧠 Grok/xAI – Bearish due to overbought RSI + price stalling near MAs
🤖 Claude/Anthropic – Bearish pullback expected, despite recent strength
📊 Llama/Meta – Overextended Bollinger Band + RSI = short bias
🧬 DeepSeek – Supports downside via divergence + high volatility
⚠️ Gemini/Google – Bullish thesis based on momentum; diverges from consensus
📉 Consensus Takeaway
While short-term momentum is strong, most models forecast a pullback due to:
🔼 Overbought RSI readings
📈 Price extended well above key moving averages
🧨 High volatility and profit-taking zone near $73–$74
✅ Recommended Trade Setup
Metric Value
🔀 Direction Short
🎯 Entry Price $72.65
🛑 Stop Loss $74.20
🎯 Take Profit $68.80
📏 Size 1 contract
📈 Confidence 68%
⏰ Timing Market Open
⚠️ Key Risks & Considerations
🌍 Geopolitical events or OPEC news can cause unexpected surges
📉 If bullish momentum resumes, upside breakout could invalidate short thesis
📏 Risk management is critical—stick to stop-loss if price breaks above $74.20
🧾 TRADE_DETAILS (JSON Format)
json
Copy
Edit
{
"instrument": "CL",
"direction": "short",
"entry_price": 72.65,
"stop_loss": 74.20,
"take_profit": 68.80,
"size": 1,
"confidence": 0.68,
"entry_timing": "market_open"
}
💡 Watch price action at the open. If oil opens weak or fails to reclaim $73, this short setup has a strong edge.
WTI(20250617)Today's AnalysisMarket news:
Revised version of the Republican tax cut bill in the US Senate: It is planned to raise the debt ceiling to 5 trillion, and the overall framework is consistent with the House version.
Technical analysis:
Today's buying and selling boundaries:
70.41
Support and resistance levels:
75.98
73.90
72.55
68.27
66.92
64.84
Trading strategy:
If the price breaks through 72.55, consider buying, and the first target price is 73.90
If the price breaks through 70.41, consider selling, and the first target price is 68.27

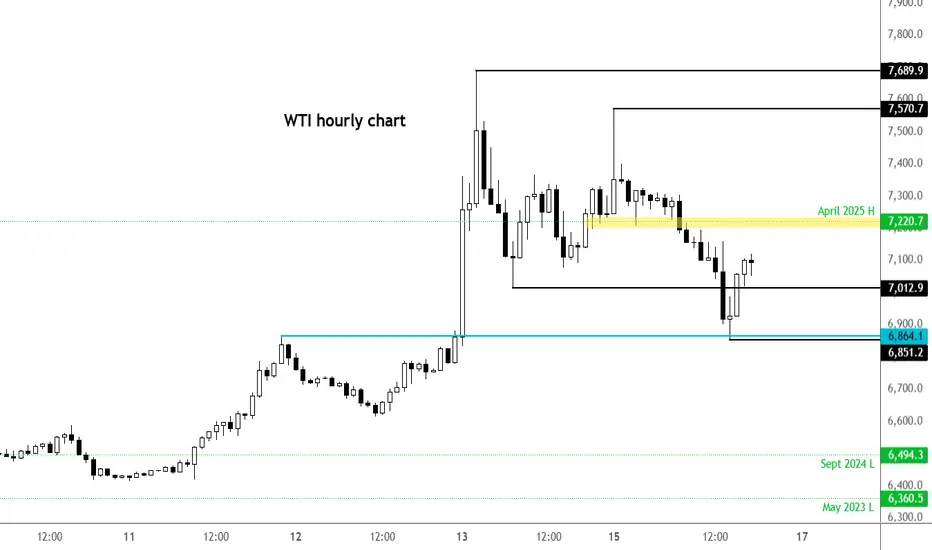
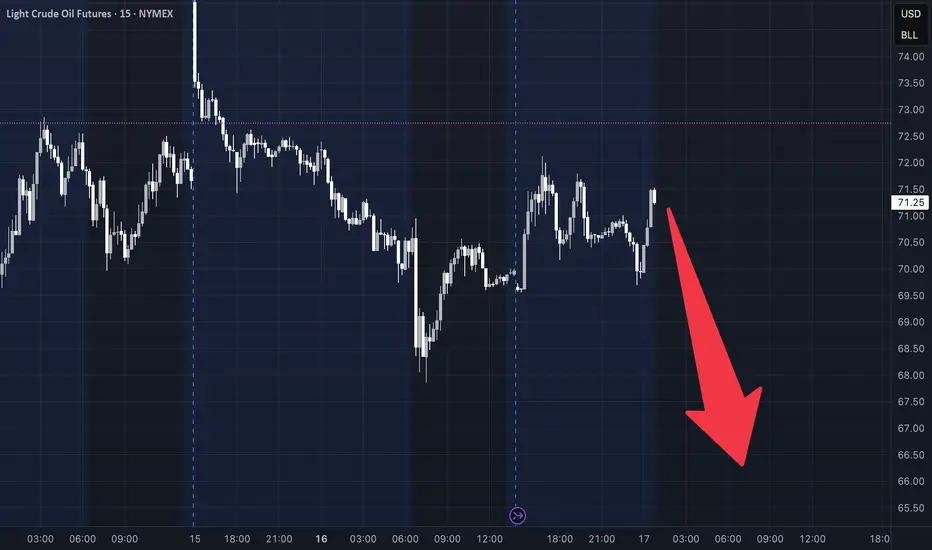
WTI rebounds from key support as Middle East tensions intensifyThe latest escalation in the conflict between Israel and Iran initially didn't cause much panic in the oil market. After spiking initially to an overnight high of $75.70, WTI has since been on a decline, before hitting a low so far of $68.50. That represents a 9.5% drop from the overnight high, which is massive. Investors have been pricing out the risk of of oil supplies being meaningfully impacted. But the latest air strikes on Tehran and Israel declaring that it had "full aerial operational control" over Tehran means tension are rising another bombardment of Tel Aviv was most likely on the agenda for Iran. Oil has been bouncing back as a result. So far, it hasn't impacted equities, with major US indices remaining near their session highs. But will that change if oil extends it recovery?
Key support at $68.60 has been defended as we can see on the hourly chart. $70.00/$70.10 is now reclaimed, which is a bullish sign. Resistance is seen around $72.20. Above that, $73.00 will be in focus.
By Fawad Razaqzada, market analyst with FOREX.com