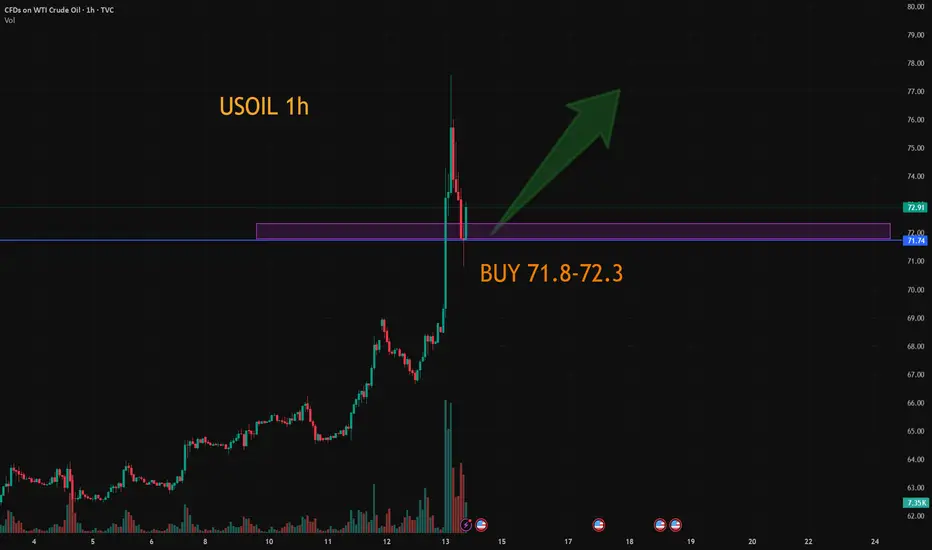
USOIL:Go long
Stay on the long side.
Trading Strategy:
BUY@71.8-72.3
TP: 74-74.3
↓↓↓ More detailed strategies and trading will be notified here ↗↗↗
↓↓↓ Keep updated, come to "get" ↗↗↗
Crude Oil WTI
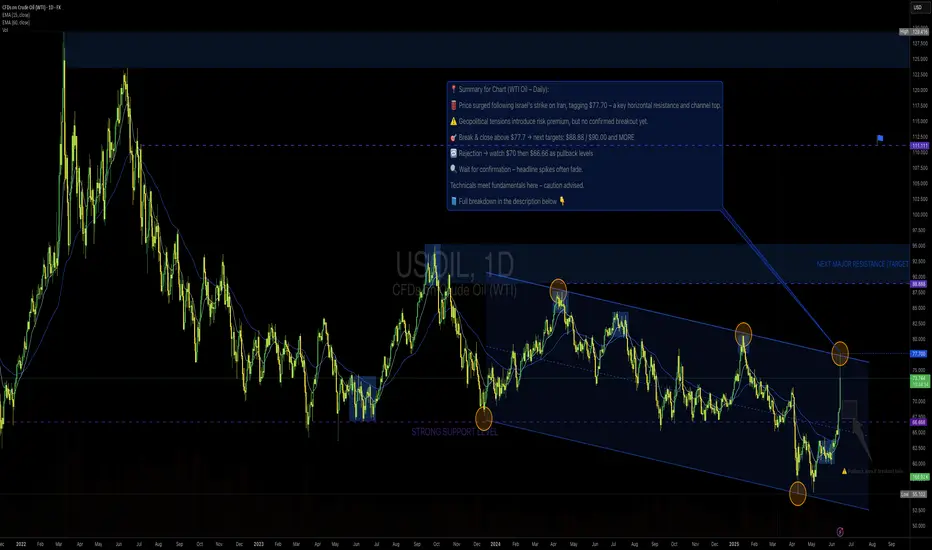
USOIL || Geopolitical Spike Hits Major Resistance - Watch $77.77🛢️
📅 June 13, 2025
👤 By: MJTRADING
🔍 🧭 Fundamental Context – Risk Premium on the Rise:
Crude oil surged sharply today following reports of Israeli airstrikes on Iranian territory — a move that reawakens fears of broader Middle East escalation. Iran plays a crucial role in OPEC and controls the strategic Strait of Hormuz , through which ~20% of global oil passes.
While Iran has not officially responded yet, markets are pricing in the potential for:
* Military retaliation
* Disruption of oil exports or maritime routes
* Heightened volatility across global risk assets
=======================================================
📉 📊 Technical Structure – Tag of Key Resistance at $77.7:
Price exploded upward, piercing the descending channel that's been intact since mid-2022.
Today's daily wick tagged the $77.70 level, a major horizontal resistance and channel top.
This zone has repeatedly acted as a pivot in both bullish and bearish phases.
Volume confirmed the move – highest daily volume in months, suggesting institutional reaction.
💡 Trading Outlook:
🔼 Scenario A – Breakout & Close Above $77.7 = Bull Continuation
If tomorrow closes firmly above $77.70:
Target 1: $88.88 supply zone
Target 2: $90.00 psychological resistance
Setup: Conservative entries on retest of $75–77 area with tight invalidation
🔽 Scenario B – Failed Breakout → Fade Back Inside Channel
If this was a headline-driven spike with no follow-through, bears may re-enter strongly
A close below $75 could confirm bull trap
Support zone to watch: $66.66 (mid-channel, EMA confluence)
⚠️ Risk Factors to Monitor:
Iran’s response (military, diplomatic, strategic)
US/NATO reaction to potential escalation
Strait of Hormuz disruption
OPEC commentary or Saudi-led output adjustment
Market sentiment unwind (profit-taking from overbought spike)
💬 Markets love emotion, but traders survive with structure. This is not the time to be reckless — size down, be responsive, and respect both breakouts and fakeouts.
📎 #CrudeOil #Geopolitics #OilSpike #WTI #MiddleEastTensions #Iran #IranIsrael #TechnicalAnalysis #MJTRADING
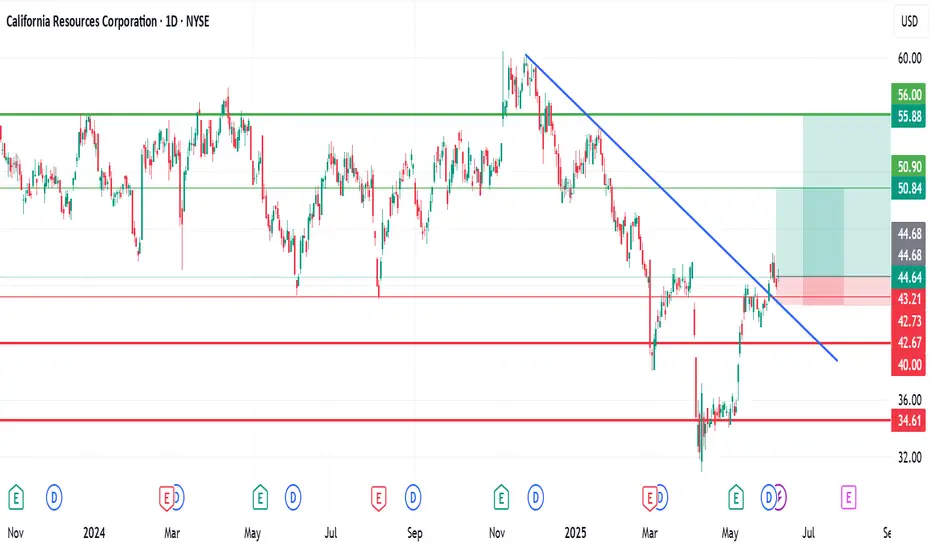
California Resources Corporation (CRC) – Stock Analysis and ForeCalifornia Resources Corporation, a key player in crude oil production and carbon management, has recently experienced a notable uptick in investor interest.
This momentum appears to be supported by macroeconomic tailwinds, including renewed trade tensions between the United States and other major economies.
Historically, geopolitical uncertainty often leads to increased energy demand and price volatility, both of which tend to benefit domestic oil producers like CRC.
From a fundamental standpoint, investor sentiment toward CRC has grown increasingly positive. The company’s strategic positioning in California's energy transition—particularly its focus on carbon capture and storage (CCS)—is beginning to resonate more with institutional investors looking to align portfolios with sustainable yet profitable energy operations.
If these supportive fundamentals continue, there is potential for the stock to reach $56 in the coming months, assuming no major changes to current market dynamics or geopolitical influences.
Technical Outlook:
Entry Point: $44.68
Stop Loss: $42.73
Take Profit 1: $50.84
Take Profit 2: $55.88
As always, trade with care, apply proper risk management, and ensure your positions align with your overall investment strategy.
If you find this helpful, kindly follow me, subscribe, like, comment and share.
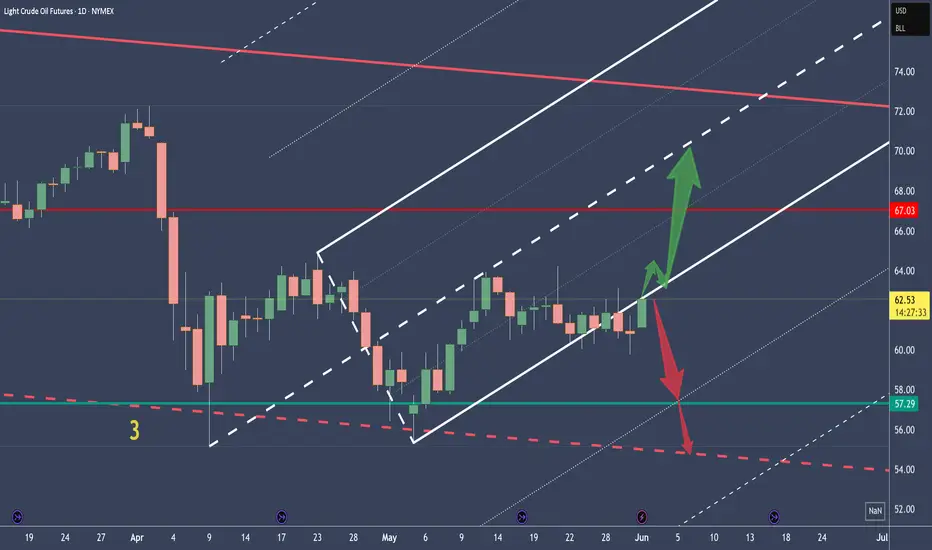
Crude Oil - Two Scenarios and about Brain PowerPrice retests the L-MLH.
VI. - Price breaks upward, target is the centerline
VII. - Price reverses again, then the target is the 1/4 line, with a subsequent extended target at the red centerline, and possibly even lower at the white dashed warning line.
On a personal note:
I was once again told that the price didn’t do what I had projected.
...yeah, really, that’s how it is §8-)
After over 30 years in the markets and hundreds of coaching sessions, I’m still amazed that people think you can predict price movements as if with a magic crystal ball.
The fact that this belief still persists (even though they don’t understand even the absolute basics of trading) deeply concerns me at the core of my trading soul.
Because this growing irrationality clearly indicates that far too little is being done in terms of education – or humanity might simply go extinct in the next 100 years due to rapidly declining intelligence!
...maybe I should just create a chart and apply a few median lines/forks?
Happy trading to all of you and I pray for those with lesser brain power.
Geopolitical Scenario. Market Outlook during London OpenCovering Gold Dax NQ and other assets with proper reasoning.

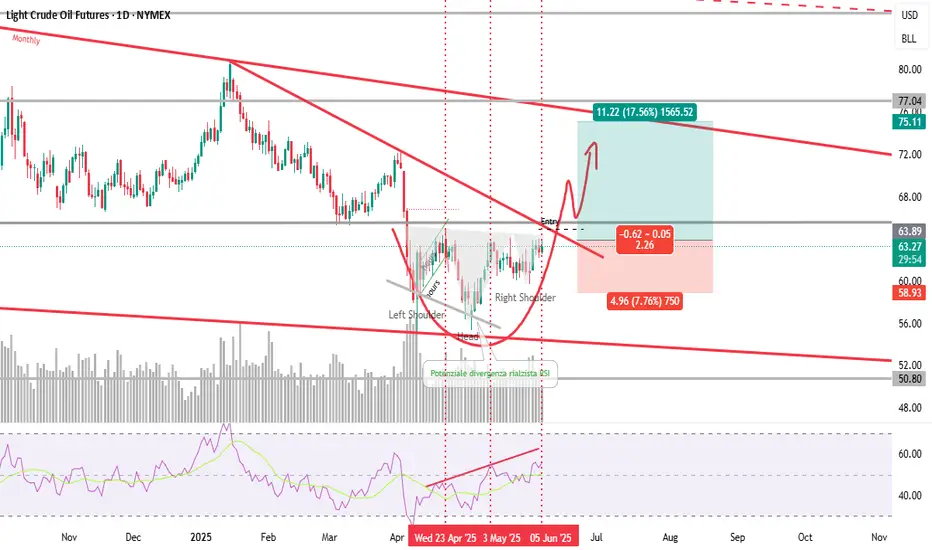
CL - Crude Oil - long strategyCL - Crude Oil - long strategy
RSI confirmed potential new long opportunities
H&S reversal pattern
There are conditions for inversion
Israel Strikes Iran. Oil and Gold Prices SurgeIsrael Strikes Iran. Oil and Gold Prices Surge
According to media reports, Israel launched a large-scale overnight strike on Iranian territory, targeting dozens of military and strategic facilities linked to the country’s nuclear programme and missile capabilities. Israeli officials justified the action by citing an existential threat from Tehran, which, according to their intelligence, is accelerating its development of nuclear weapons and expanding its arsenal of ballistic missiles.
In response, Iran has vowed severe retaliation, stating that the United States and Israel will “pay a heavy price” for the attack. US President Donald Trump has urgently convened a meeting to assess the situation.
Commodities Market Reaction
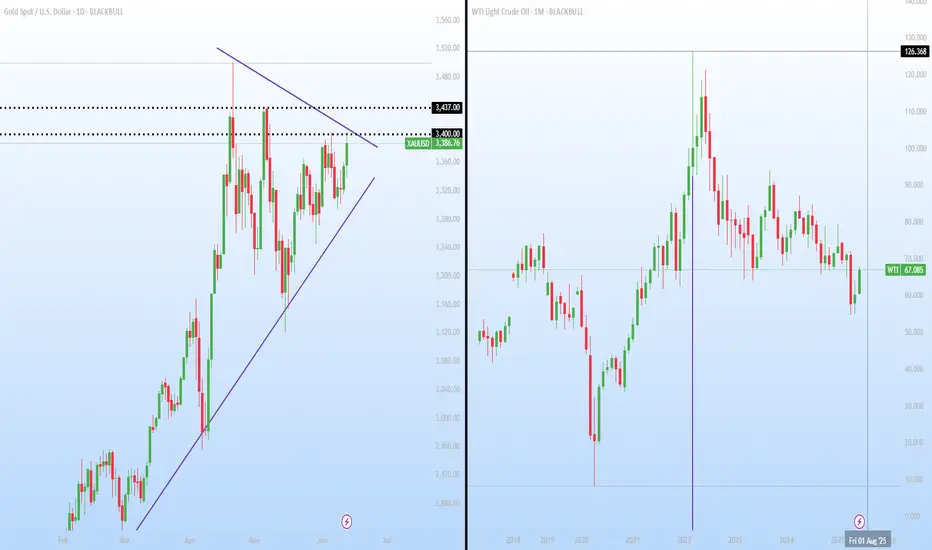
In the wake of these developments, gold — the primary safe-haven asset — surged sharply. The XAU/USD price broke above its May high, rising past $3,440. However, the all-time high near $3,498 remains intact for now.
Oil prices also spiked due to fears of supply disruption. The military conflict threatens shipping through the Strait of Hormuz, a crucial chokepoint through which one-fifth of the world’s oil supply passes. Traders quickly priced in the risk of war, anticipating a supply shortage driven by large-scale instability in the Middle East.
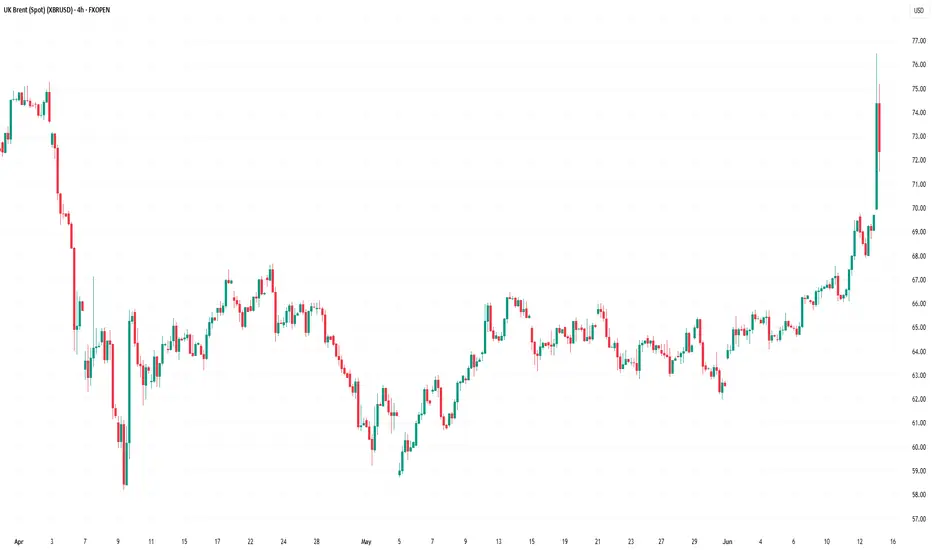
Technical Analysis of the XBR/USD Chart
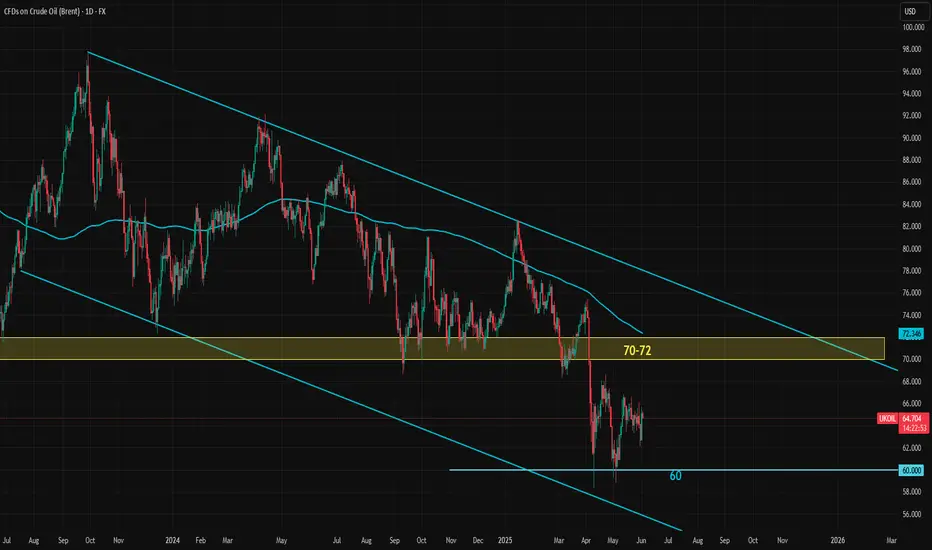
Brent crude oil price has risen to the upper boundary of a large-scale descending channel (shown in red), which is defined by lower highs from 2024–2025. As anticipated, this upper boundary acted as resistance, with the price forming a peak above $76 before reversing downward (as illustrated by the black arrow).
From a technical standpoint, following such a sharp rally, Brent is vulnerable to a corrective move. In this scenario, a pullback into the orange zone is possible, where support may be found at:
→ The psychologically important $70 level;
→ The 50% Fibonacci retracement level;
→ The former resistance of the purple descending trendline, now turned support.
Nevertheless, given the scale of the geopolitical threat, it is unlikely that market sentiment will allow Brent to decline significantly in the near term.
This article represents the opinion of the Companies operating under the FXOpen brand only. It is not to be construed as an offer, solicitation, or recommendation with respect to products and services provided by the Companies operating under the FXOpen brand, nor is it to be considered financial advice.
USOIL:Go long
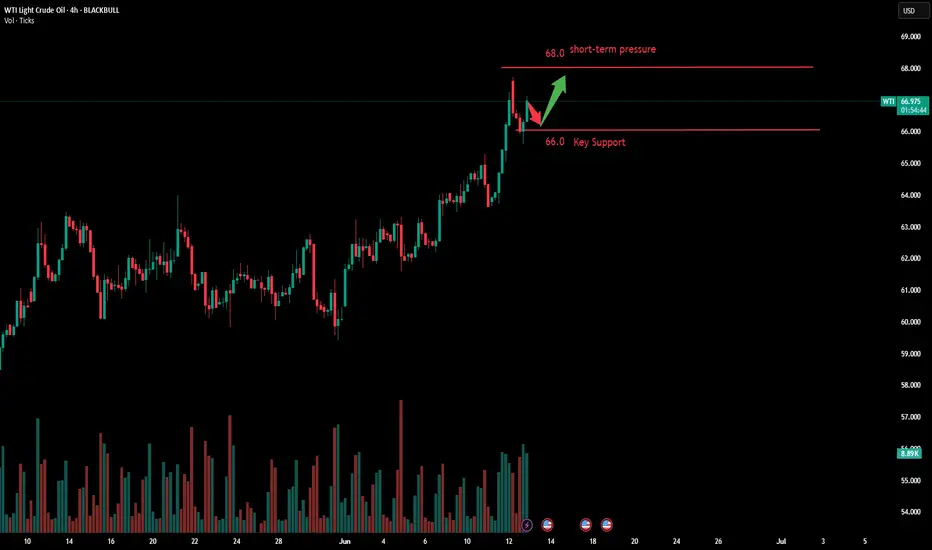
USOIL:Crude oil rose sharply under the tension in the Middle East, the early repeatedly suggested that the continuous low shock after the upward breakthrough, the time of storage force is long enough, especially the watershed 64.8 break after the rising space has been opened, the trading idea is still to step back and do long.
Trading Strategy:
BUY@66.9-67.2
TP: 68.6-69
↓↓↓ More detailed strategies and trading will be notified here ↗↗↗
↓↓↓ Keep updated, come to "get" ↗↗↗

Chasing Oil Spikes? How Geopolitics Can Wreck SetupsOil prices surged over 12% in Asia on Middle East headlines, sparking a surge of volatility across safe-haven currencies and stock market futures during thin trade.
It felt like a good time to provide food for thought to newer traders looking to chase these moves, highlight the mockery geopolitics can make of technical analysis with recent examples, and provide a filter for when the waters may be safer to reenter.
Matt Simpson, Market Analyst at City Index and Forex.com

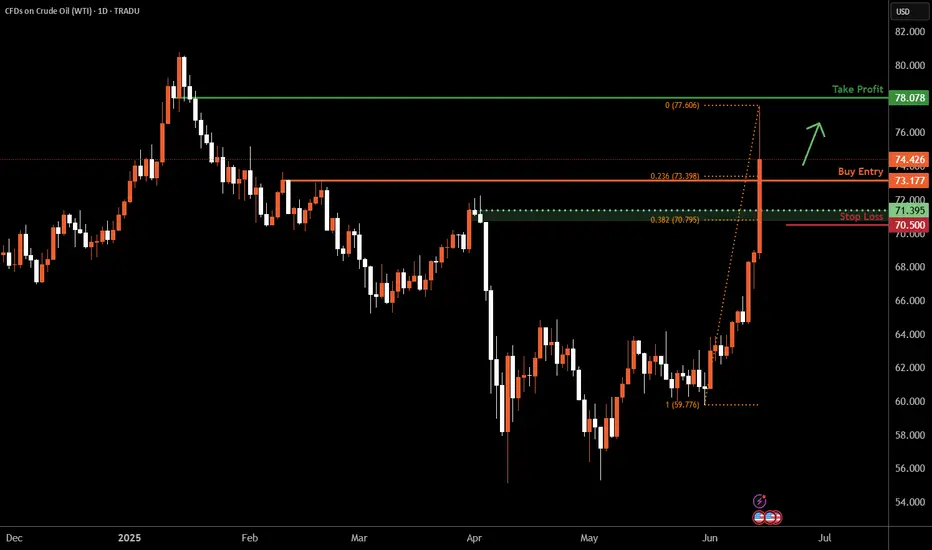
WTI Oil D1 | Potential bounce off a pullback supportWTI oil (USOIL) is falling towards a pullback support and could potentially bounce off this level to climb higher.
Buy entry is at 73.17 which is a pullback support that aligns with the 23.6% Fibonacci retracement.
Stop loss is at 70.50 which is a level that lies underneath a a pullback support and the 38.2% Fibonacci retracement.
Take profit is at 78.07 which is a a pullback resistance.
High Risk Investment Warning
Trading Forex/CFDs on margin carries a high level of risk and may not be suitable for all investors. Leverage can work against you.
Stratos Markets Limited (tradu.com ):
CFDs are complex instruments and come with a high risk of losing money rapidly due to leverage. 63% of retail investor accounts lose money when trading CFDs with this provider. You should consider whether you understand how CFDs work and whether you can afford to take the high risk of losing your money.
Stratos Europe Ltd (tradu.com ):
CFDs are complex instruments and come with a high risk of losing money rapidly due to leverage. 63% of retail investor accounts lose money when trading CFDs with this provider. You should consider whether you understand how CFDs work and whether you can afford to take the high risk of losing your money.
Stratos Global LLC (tradu.com ):
Losses can exceed deposits.
Please be advised that the information presented on TradingView is provided to Tradu (‘Company’, ‘we’) by a third-party provider (‘TFA Global Pte Ltd’). Please be reminded that you are solely responsible for the trading decisions on your account. There is a very high degree of risk involved in trading. Any information and/or content is intended entirely for research, educational and informational purposes only and does not constitute investment or consultation advice or investment strategy. The information is not tailored to the investment needs of any specific person and therefore does not involve a consideration of any of the investment objectives, financial situation or needs of any viewer that may receive it. Kindly also note that past performance is not a reliable indicator of future results. Actual results may differ materially from those anticipated in forward-looking or past performance statements. We assume no liability as to the accuracy or completeness of any of the information and/or content provided herein and the Company cannot be held responsible for any omission, mistake nor for any loss or damage including without limitation to any loss of profit which may arise from reliance on any information supplied by TFA Global Pte Ltd.
The speaker(s) is neither an employee, agent nor representative of Tradu and is therefore acting independently. The opinions given are their own, constitute general market commentary, and do not constitute the opinion or advice of Tradu or any form of personal or investment advice. Tradu neither endorses nor guarantees offerings of third-party speakers, nor is Tradu responsible for the content, veracity or opinions of third-party speakers, presenters or participants.
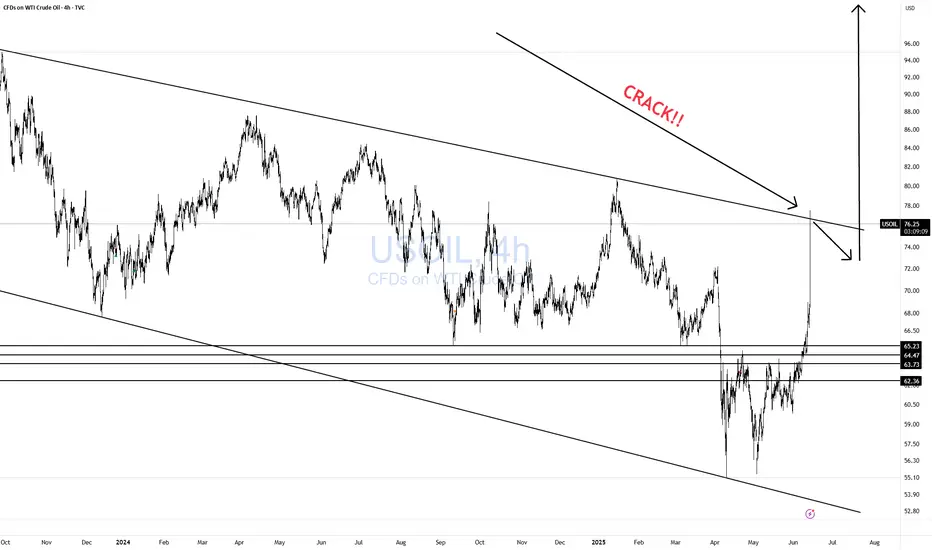
USOIL CRACK!Usually, these types of events are great selling opportunities as they are short-lived. However, this time may be different.
I would expect a pullback then if it lasts and escalates a breakout. For now, just observe, have patience, and look for the 2nd crack!
If it cracks a 2nd time, it is definitely not good for US inflation.
WTI(20250613)Today's AnalysisMarket news:
The number of initial jobless claims in the United States for the week ending June 7 was 248,000, higher than the expected 240,000, the highest since the week of October 5, 2024. The monthly rate of the core PPI in the United States in May was 0.1%, lower than the expected 0.30%. Traders once again fully priced in the Fed's two interest rate cuts this year.
Technical analysis:
Today's buying and selling boundaries:
66.96
Support and resistance levels:
69.10
68.30
67.78
66.13
65.61
64.81
Trading strategy:
If the price breaks through 67.78, consider buying in, and the first target price is 68.30
If the price breaks through 66.96, consider selling in, and the first target price is 66.13

Iran tensions rise: a setup brewing for gold and oil Geopolitical tensions surrounding Iran might fuel safe-haven demand for gold.
A break above $3,403 might open the door for a test of the May high at $3,437. However, price action over the last two sessions potentially indicates that buyers are reluctant to drive spot prices above $3,400.
At the same time, analysts are suggesting that oil could climb toward $120 if Israel takes military action against Iran. “I don’t want to say it’s imminent, but it looks like something that could very well happen,” President Trump said during a White House event.
Meanwhile, cooler-than-expected US CPI and PPI prints have potentially strengthened expectations that the Federal Reserve could begin cutting interest rates by September, with a second cut possibly following before year-end.
US OIL 🛢️ USOIL Trade Plan – Based on Dow Theory (4H TF)
📌 Bias: Buy / Long
Dow Theory shows Higher Highs (HH) and Higher Lows (HL) structure on the 4H — indicating an uptrend
SL TP marked in Chart / Entry Instant or buy near CMP

Bullish momentum remains robust.International oil prices surged then pulled back. Brent crude oil futures fell 47 cents to $69.40 per barrel, while U.S. West Texas Intermediate (WTI) dropped 33 cents to $67.84. In the previous session, both Brent and WTI recorded over 4% gains, hitting their highest levels since early April.
On Wednesday, U.S. President Trump stated that the U.S. is withdrawing some personnel from the Middle East due to the region's potential danger, reiterating that Iran will not be allowed to develop nuclear weapons. Meanwhile, market surveys showed the U.S. is preparing partial evacuations of personnel from its embassy in Iraq and allowing family members in Bahrain and other areas to leave. U.S. and Iraqi sources revealed the move primarily stems from heightened security risks in the region.
Current upward momentum in the oil market is driven by dual factors: geopolitical tensions in the Middle East and unexpected declines in U.S. inventories. In the short term, as long as tensions between Iran and the U.S. show no signs of easing, the market will continue to monitor potential supply disruption risks. Additionally, the alleviation of trade concerns and global economic recovery expectations will provide strong long-term support for oil prices. However, risks of sharp volatility from sudden deterioration in geopolitical situations should be vigilantly monitored.
With moving averages diverging upward, the short-term objective trend is clearly established as bullish. It is expected that crude oil prices will continue to rise and hit new highs.
Humans need to breathe, and perfect trading is like breathing—maintaining flexibility without needing to trade every market swing. The secret to profitable trading lies in implementing simple rules: repeating simple tasks consistently and enforcing them strictly over the long term.
Trading Strategy:
buy@65.5.0-66.0
TP:67.5-68.0
Slowing Global Economy and Output Hikes Weigh on Brent OilBrent crude oil is holding steady around the $60 level, even after OPEC announced another 411,000 barrels per day increase in output, following similar hikes in May, June and smaller one in April. This latest adjustment comes at a time when global economic slowdown concerns are rising, making the decision a risky one. Although the main reason points to non-compliance from Kazakhstan and Iraq, some believe the United States may have played a role, possibly through pressure from Trump aimed at controlling inflation during the ongoing tariff hikes.
With several consecutive production increases now in place, a growing surplus is likely to develop over the second half of 2025. This would maintain downward pressure on oil prices if demand fails to keep pace. At the same time, the broader economic outlook is weakening. Recent manufacturing activity data from China, the United States, the European Union, and the United Kingdom all came in below 50, suggesting a faster rate of contraction. The presence of widespread tariffs is expected to continue weighing on business sentiment and consumer demand, potentially leading to rising unemployment and slowing growth.
In this environment, any short-term spikes in Brent and WTI prices are likely to remain opportunities to sell, unless there is a meaningful shift in underlying fundamentals. For a more detailed view of economic trends, please refer to the latest monthly report.
Brent crude has been in a steady downtrend since March of last year. While the price movement doesn't follow a perfect trend channel, the structure has generally held well. At the moment, Brent is hovering near the middle of this declining channel.
The former long-term support zone around $70 to $72. If prices move up toward this zone, it could present a fresh selling opportunity as long as the resistance holds. On the downside, the $60 level and the area just below it have formed a solid medium-term support, which has held up so far.
Still, oil bulls should be cautious around the $60 mark. Even though support looks strong for now, the overall direction of the trend and the broader fundamental backdrop suggest that this level could eventually break. Any long positions taken near current levels should factor in the potential for renewed downside pressure.
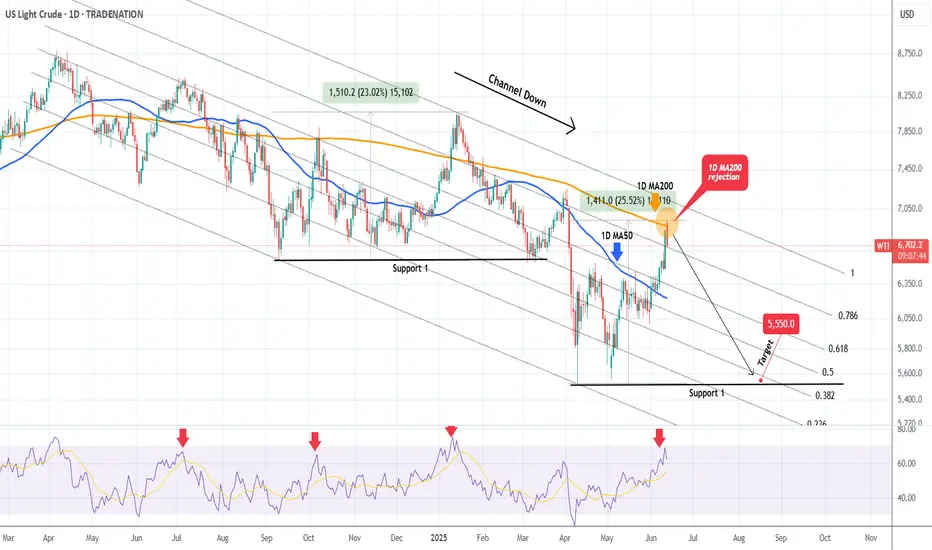
WTI OIL Massive rejection on the 1D MA200.WTI Oil (USOIL) has been trading within a Channel Down for over a year now and today its latest Bullish Leg hit the 1D MA200 (orange trend-line) for the first time since February 03 2025.
Unless we see a sustainable structured rise that turns it into a Support, the long-term bearish trend should prevail, and the market has already reacted to this with a strong rejection.
With the 1D RSI almost overbought (>70.00), being consistent with the last 3 major tops, we expect a gradual decline towards Support 1, as it happened on the January - February 2025 Bearish Leg.
Our Target is just above it at $55.50.
-------------------------------------------------------------------------------
** Please LIKE 👍, FOLLOW ✅, SHARE 🙌 and COMMENT ✍ if you enjoy this idea! Also share your ideas and charts in the comments section below! This is best way to keep it relevant, support us, keep the content here free and allow the idea to reach as many people as possible. **
-------------------------------------------------------------------------------
💸💸💸💸💸💸
👇 👇 👇 👇 👇 👇
Crude Oil Eyes 65.40 Support Amid Middle East Uncertainty!!Hey Traders,
In today’s trading session, we’re closely monitoring USOIL for a potential buying opportunity around the 65.40 zone. The commodity remains in an overall uptrend, and is currently undergoing a corrective phase, approaching a key support/resistance area near 65.40. This level aligns well with the broader trend structure and may offer a favorable risk-to-reward setup.
On the fundamental side, geopolitical tensions are on the rise. Reports indicate that U.S. embassy personnel are being evacuated from parts of the Middle East amid growing regional instability. Allegedly, Israel is preparing for potential military action against Iran should nuclear deal talks collapse.
If these tensions escalate further into military conflict, oil prices could spike in response to the heightened risk to regional supply chains.
Trade safe,
Joe
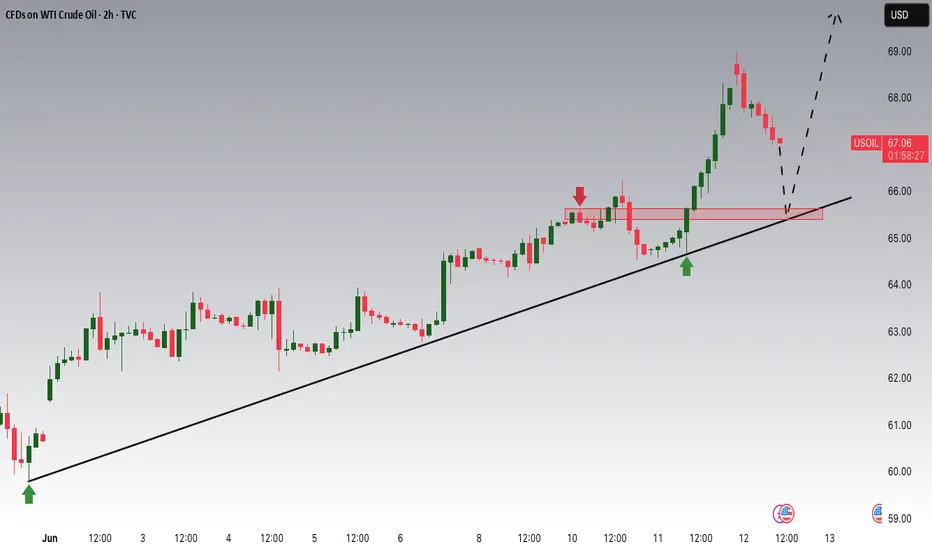
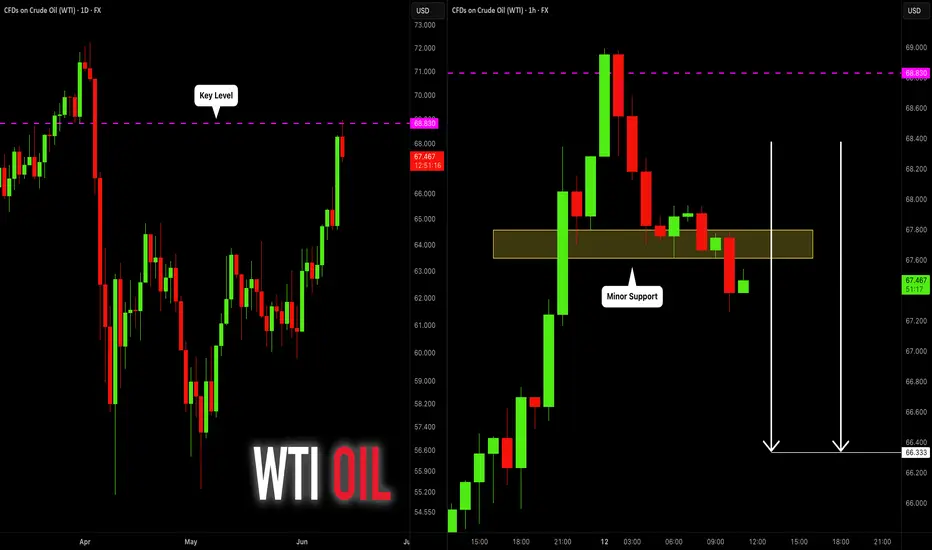
CRUDE OIL (WTI): Pullback From Key Level
WTI Crude Oil looks overbought after a test of key daily horizontal resistance level.
A violation of a minor horizontal support on an hourly time frame after its test
provides a strong intraday confirmation.
I expect a retracement to 66.33 level.
❤️Please, support my work with like, thank you!❤️
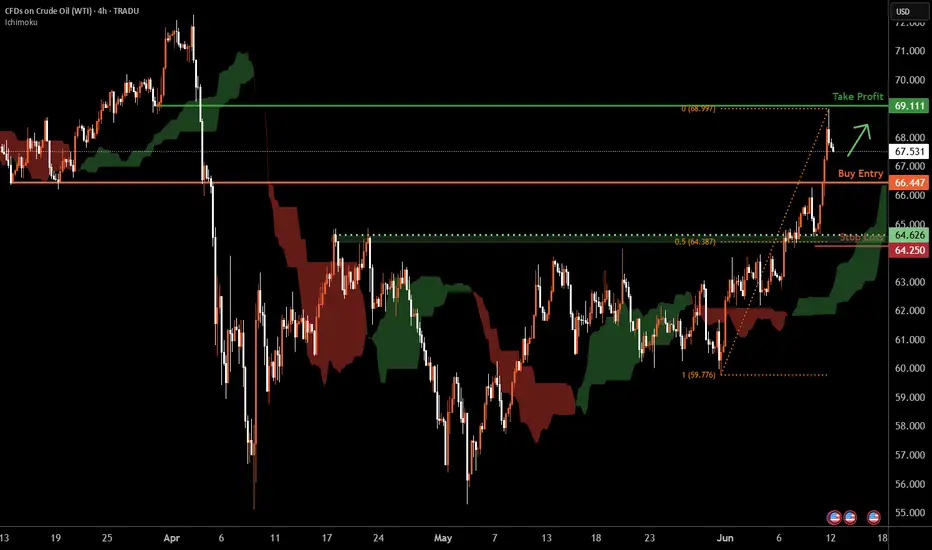
WTI Oil H4 | Potential bullish bounceWTI oil (USOIL) is falling towards a pullback support and could potentially bounce off this level to climb higher.
Buy entry is at 66.44 which is a pullback support.
Stop loss is at 64.25 which is a level that lies underneath an overlap support and the 50% Fibonacci retracement.
Take profit is at 69.11 which is a pullback resistance.
High Risk Investment Warning
Trading Forex/CFDs on margin carries a high level of risk and may not be suitable for all investors. Leverage can work against you.
Stratos Markets Limited (tradu.com ):
CFDs are complex instruments and come with a high risk of losing money rapidly due to leverage. 63% of retail investor accounts lose money when trading CFDs with this provider. You should consider whether you understand how CFDs work and whether you can afford to take the high risk of losing your money.
Stratos Europe Ltd (tradu.com ):
CFDs are complex instruments and come with a high risk of losing money rapidly due to leverage. 63% of retail investor accounts lose money when trading CFDs with this provider. You should consider whether you understand how CFDs work and whether you can afford to take the high risk of losing your money.
Stratos Global LLC (tradu.com ):
Losses can exceed deposits.
Please be advised that the information presented on TradingView is provided to Tradu (‘Company’, ‘we’) by a third-party provider (‘TFA Global Pte Ltd’). Please be reminded that you are solely responsible for the trading decisions on your account. There is a very high degree of risk involved in trading. Any information and/or content is intended entirely for research, educational and informational purposes only and does not constitute investment or consultation advice or investment strategy. The information is not tailored to the investment needs of any specific person and therefore does not involve a consideration of any of the investment objectives, financial situation or needs of any viewer that may receive it. Kindly also note that past performance is not a reliable indicator of future results. Actual results may differ materially from those anticipated in forward-looking or past performance statements. We assume no liability as to the accuracy or completeness of any of the information and/or content provided herein and the Company cannot be held responsible for any omission, mistake nor for any loss or damage including without limitation to any loss of profit which may arise from reliance on any information supplied by TFA Global Pte Ltd.
The speaker(s) is neither an employee, agent nor representative of Tradu and is therefore acting independently. The opinions given are their own, constitute general market commentary, and do not constitute the opinion or advice of Tradu or any form of personal or investment advice. Tradu neither endorses nor guarantees offerings of third-party speakers, nor is Tradu responsible for the content, veracity or opinions of third-party speakers, presenters or participants.
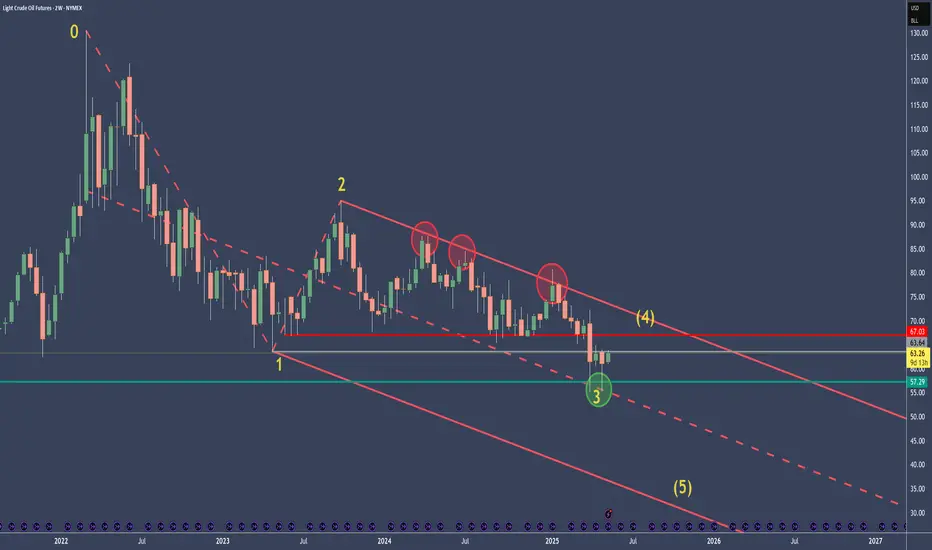
Crude Oil Going Higher - TA and fundamentals aligneThe 0-5 count is not over yet.
Sudo 4 and 5 are still lurking.
It's good to see how the Medianline-Set cought the Highs of the swings. Likewise we can see the subborn rejection at the Center-Line at P3.
I will not trade CL to the short side, until it's clear that P4 is engraved in this Chart. Until then, I maybe shoot for some intraday or dayli trades in Crude.
Economy Facts that support a rise, up to P4:
Crude oil refineries typically switch to producing more gasoline (fuel for cars) in the spring, particularly around March to April in the United States and other northern hemisphere countries.
Seasonal demand: Warmer months mean more driving and vacation travel, increasing gasoline demand.
Regulatory change: Refineries begin producing summer-grade gasoline, which has lower volatility and is required by environmental regulations (especially in the U.S. under EPA rules).
The switch to summer-grade gasoline must be completed by June 1st for retail and May 1st for terminals and pipelines in the U.S.
In Summary:
- Switch begins: March–April
- Completed by: May (terminals), June (retail)
- This seasonal shift is often called the "refinery maintenance season" or "spring blend switch."
WTI Crude Oil 4H Chart – Bullish Setup from Demand Zone📈 Current Price: $61.74
🔵 Key Zones & Levels
🔹 Demand Zone (Buy Area):
🟦 $59.48 – $61.39
→ Price expected to bounce here
→ 🔄 Potential reversal zone
🔹 Entry Point:
🎯 $61.39
→ Ideal level to enter LONG
→ Just above demand zone
🔹 Stop Loss:
🛑 Below $59.48
→ Exit if price drops here
→ Protects capital
🔹 Target Point:
🚀 $67.00
→ Profit-taking zone
→ Strong resistance zone nearby:
* 66.63
* 66.75
* 67.60
📊 Indicators
📍 EMA (70): 🔴 61.40
→ Price trading above = bullish signal
→ EMA acting as support
📏 Trendline Channel:
🔼 Higher highs & higher lows
→ Supports uptrend continuation
📌 Trade Plan Summary
* Bias: 📈 Bullish
* Buy: At 61.39
* Stop: Below 59.48 🛑
* Target: 67.00 🎯
* Risk-Reward: ✔️ Favorable (~1:3)
🔍 What to Watch
* ✅ Bullish candles in demand zone
* 🔁 Retest of EMA or lower channel
* ❌ Avoid if it breaks below $59.48

WTI(20250612)Today's AnalysisMarket news:
① The EU hopes that the trade negotiations will be extended beyond the suspension period set by Trump. ② Bessant: As long as "sincerity" is shown in the negotiations, the Trump administration is willing to extend the current 90-day tariff suspension period beyond July 9. ③ Trump will hold multiple bilateral talks during the G7 summit. ④ The total customs revenue of the United States in May reached a record high of US$23 billion, an increase of nearly four times year-on-year. ⑤ Lutnick: One deal after another will be reached.
Technical analysis:
Today's buying and selling boundaries:
66.02
Support and resistance levels:
69.56
68.23
67.38
64.66
63.80
62.47
Trading strategy:
If the price breaks through 67.38, consider buying in, and the first target price is 68.23
If the price breaks through 66.02, consider selling in, and the first target price is 64.66
