USOIL:Long at 61.3-61.5
Last week's long target has been completed, the current decline is mainly due to concerns that global supply growth may exceed demand growth, from the technical trend, the objective trend of the middle line downward, short term long and short frequently alternate, pay attention to the support point of 60.3-60.5 within the day. Considering that it has been around this point of shock and not broken, short - term trading to do more.
So the trading strategy :BUY@61.3-61.5 TP@62.5-62.7
↓↓↓ More detailed strategies and trading will be notified here →→→
↓↓↓ Keep updated, come to "get" →→→
Crude Oil WTI

USOIL:Go long first
Crude oil short-term trend to maintain weak shock upward rhythm, K line closed long lower shadow line, there are signs of rebound. Short - term moving average system gradually long arrangement, relying on oil prices, short - term objective trend direction to upward. It is expected that the intraday trend of crude oil will continue to extend upward, hitting around 62.8-63
Recommended Trading Strategies:
61-61.2 range to be long, short-term target to see 62, break through the target to see 62.8-63
↓↓↓ The detailed strategy club will have tips, updated daily, come and get them →→→

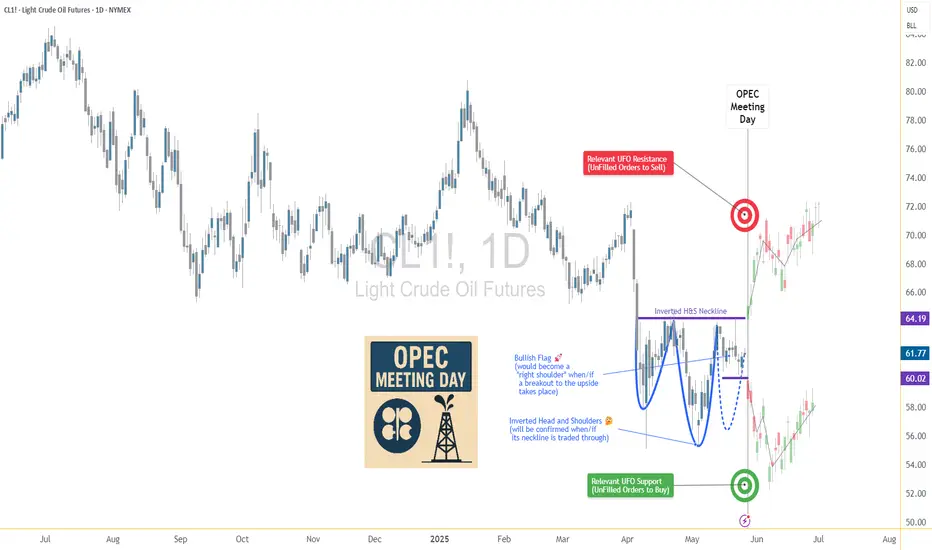
OPEC Countdown: Inverted H&S Signals Potential Oil Price Rise🧭 Market Context – OPEC in Focus
As Crude Oil Futures (CL) grind in tight consolidation, the calendar reminds traders that the next OPEC meeting takes place on May 28, 2025. This is no ordinary headline event — OPEC decisions directly influence global oil supply. From quota adjustments to production cuts, their moves can rapidly shift price dynamics across energy markets. Every tick in crude oil reflects not just current flows but also positioning ahead of such announcements.
OPEC — the Organization of the Petroleum Exporting Countries — coordinates oil policy among major producers. Its impact reverberates through futures markets like CL and MCL (Micro Crude), where both institutional and retail traders align positions weeks in advance. This time, technicals are speaking loud and clear.
A compelling bottoming structure is taking shape. The Daily timeframe reveals an Inverted Head and Shoulders pattern coinciding with a bullish flag, compressing into a potential breakout zone. If momentum confirms, CL could burst into a trend move — just as OPEC makes its call.
📊 Technical Focus – Inverted H&S + Flag Pattern
Price action on the CL daily chart outlines a classic Inverted Head and Shoulders — a reversal structure that traders often monitor for high-conviction setups. The neckline sits at 64.19, and price is currently coiled just below it, forming a bullish flag that overlaps with the pattern’s right shoulder.
What makes this setup powerful is its precision. Not only does the flag compress volatility, but the symmetry of the shoulders, the clean neckline, and the breakout potential align with high-quality chart pattern criteria.
The confirmation of the breakout typically requires trading activity above 64.19, which would trigger the measured move projection. That target? Around 70.59, which is near a relevant UFO-based resistance level — a region where sellers historically stepped in with force (UnFilled Orders to Sell).
Importantly, this bullish thesis will fail if price drops below 60.02, the base of the flag. That invalidation would potentially flip sentiment and set up a bearish scenario with a target near the next UFO support at 53.58.
To properly visualize the dual scenario forming in Crude Oil, a multi-timeframe approach is often very useful as each timeframe adds clarity to structure, breakout logic, and entry/exit positioning:
Weekly Chart: Reveals two consecutive indecision candles, reflecting hesitation as the market awaits the OPEC outcome.
Daily chart: Presents a MACD bullish divergence, potentially adding strength to the reversal case.
Zoomed-in 4H chart: Further clarifies the boundaries of the bullish flag.
🎯 Trade Plan – CL and MCL Long/Short Scenarios
⏫ Bullish Trade Plan:
o Product: CL or MCL
o Entry: Break above 64.19
o Target: 70.59 (UFO resistance)
o Stop Options:
Option A: 60.02 (tight, under flag)
Option B: ATR-based trailing stop
o Ideal for momentum traders taking advantage of chart pattern combined with fundamental data coming out of an OPEC meeting
⏬ Bearish Trade Plan:
o Trigger: Break below 60.02
o Target: 53.58 (UFO support)
o Stop Options:
Option A: 64.19 (tight, above flag)
Option B: ATR-based trailing stop
o Ideal for momentum traders fading pattern failures
⚙️ Contract Specs – CL vs MCL
Crude Oil can be traded through two futures contracts on CME Group: the standard CL (WTI Crude Oil Futures) and the smaller-sized MCL (Micro WTI Crude Oil Futures). Both offer identical tick structures, making MCL a powerful instrument for traders needing more flexibility in position sizing.
CL represents 1,000 barrels of crude per contract. Each tick (0.01 move) is worth $10, and one full point of movement equals $1,000. The current estimated initial margin required to trade one CL contract is approximately $6,000 per contract, although this may vary based on market volatility and brokerage terms.
MCL, the micro version, represents 100 barrels per contract — exactly 1/10th the size of CL. Each 0.01 tick move is worth $1, with one point equaling $100. The estimated initial margin for MCL is around $600, offering traders access to the same technical setups at significantly reduced capital exposure.
These two contracts mirror each other tick-for-tick. MCL is ideal for:
Testing breakout trades with lower risk
Scaling in/out around events like OPEC
Implementing precise risk management strategies
Meanwhile, CL provides larger exposure and higher dollar returns but requires tighter control of risk and account drawdowns. Traders can choose either—or both—based on their strategy and account size.
🛡️ Risk Management – The Foundation of Survival
Technical setups don’t make traders profitable — risk management does.
Before the OPEC meeting, traders must be aware that volatility can spike, spreads may widen, and whipsaws can invalidate even the cleanest chart pattern.
That’s why stop losses aren’t optional — they’re mandatory. Whether you choose a near level, a deeper stop below the head, or an ATR-based trailing method, the key is clear: define risk before entry.
MCL helps mitigate capital exposure for those testing breakout confirmation. CL demands higher margin and greater drawdown flexibility — but offers bigger tick rewards.
Precision also applies to exits. Targets must be defined before entry to maintain reward-to-risk discipline. Avoid adding to losers or chasing breakouts post-event.
And most importantly — never hold a losing position into an event like OPEC, hoping for recovery. Risk is not a gamble. It’s a calculated variable. Treat it with respect.
When charting futures, the data provided could be delayed. Traders working with the ticker symbols discussed in this idea may prefer to use CME Group real-time data plan on TradingView: tradingview.sweetlogin.com - This consideration is particularly important for shorter-term traders, whereas it may be less critical for those focused on longer-term trading strategies.
General Disclaimer:
The trade ideas presented herein are solely for illustrative purposes forming a part of a case study intended to demonstrate key principles in risk management within the context of the specific market scenarios discussed. These ideas are not to be interpreted as investment recommendations or financial advice. They do not endorse or promote any specific trading strategies, financial products, or services. The information provided is based on data believed to be reliable; however, its accuracy or completeness cannot be guaranteed. Trading in financial markets involves risks, including the potential loss of principal. Each individual should conduct their own research and consult with professional financial advisors before making any investment decisions. The author or publisher of this content bears no responsibility for any actions taken based on the information provided or for any resultant financial or other losses.
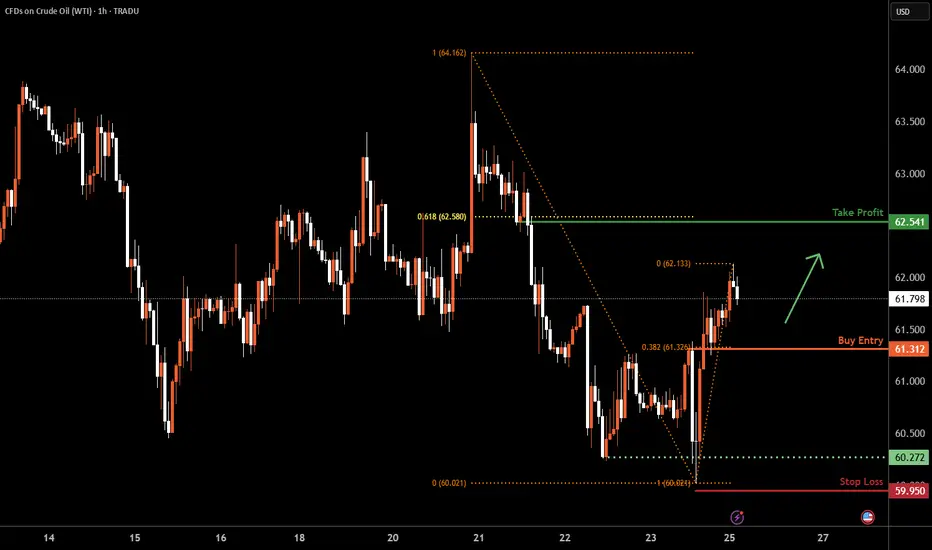
WTI Oil H1 | Falling toward an overlap supportWTI oil (USOIL) is falling towards an overlap support and could potentially bounce off this level to climb higher.
Buy entry is at 61.31 which is an overlap support that aligns with the 38.2% Fibonacci retracement.
Stop loss is at 59.95 which is a level that lies underneath a multi-swing-low support.
Take profit is at 62.54 which is a pullback resistance that aligns with the 61.8% Fibonacci retracement.
High Risk Investment Warning
Trading Forex/CFDs on margin carries a high level of risk and may not be suitable for all investors. Leverage can work against you.
Stratos Markets Limited (tradu.com ):
CFDs are complex instruments and come with a high risk of losing money rapidly due to leverage. 63% of retail investor accounts lose money when trading CFDs with this provider. You should consider whether you understand how CFDs work and whether you can afford to take the high risk of losing your money.
Stratos Europe Ltd (tradu.com ):
CFDs are complex instruments and come with a high risk of losing money rapidly due to leverage. 63% of retail investor accounts lose money when trading CFDs with this provider. You should consider whether you understand how CFDs work and whether you can afford to take the high risk of losing your money.
Stratos Global LLC (tradu.com ):
Losses can exceed deposits.
Please be advised that the information presented on TradingView is provided to Tradu (‘Company’, ‘we’) by a third-party provider (‘TFA Global Pte Ltd’). Please be reminded that you are solely responsible for the trading decisions on your account. There is a very high degree of risk involved in trading. Any information and/or content is intended entirely for research, educational and informational purposes only and does not constitute investment or consultation advice or investment strategy. The information is not tailored to the investment needs of any specific person and therefore does not involve a consideration of any of the investment objectives, financial situation or needs of any viewer that may receive it. Kindly also note that past performance is not a reliable indicator of future results. Actual results may differ materially from those anticipated in forward-looking or past performance statements. We assume no liability as to the accuracy or completeness of any of the information and/or content provided herein and the Company cannot be held responsible for any omission, mistake nor for any loss or damage including without limitation to any loss of profit which may arise from reliance on any information supplied by TFA Global Pte Ltd.
The speaker(s) is neither an employee, agent nor representative of Tradu and is therefore acting independently. The opinions given are their own, constitute general market commentary, and do not constitute the opinion or advice of Tradu or any form of personal or investment advice. Tradu neither endorses nor guarantees offerings of third-party speakers, nor is Tradu responsible for the content, veracity or opinions of third-party speakers, presenters or participants.
BRIEFING Week #21 : Watch out for ComoditiesHere's your weekly update ! Brought to you each weekend with years of track-record history..
Don't forget to hit the like/follow button if you feel like this post deserves it ;)
That's the best way to support me and help pushing this content to other users.
Kindly,
Phil

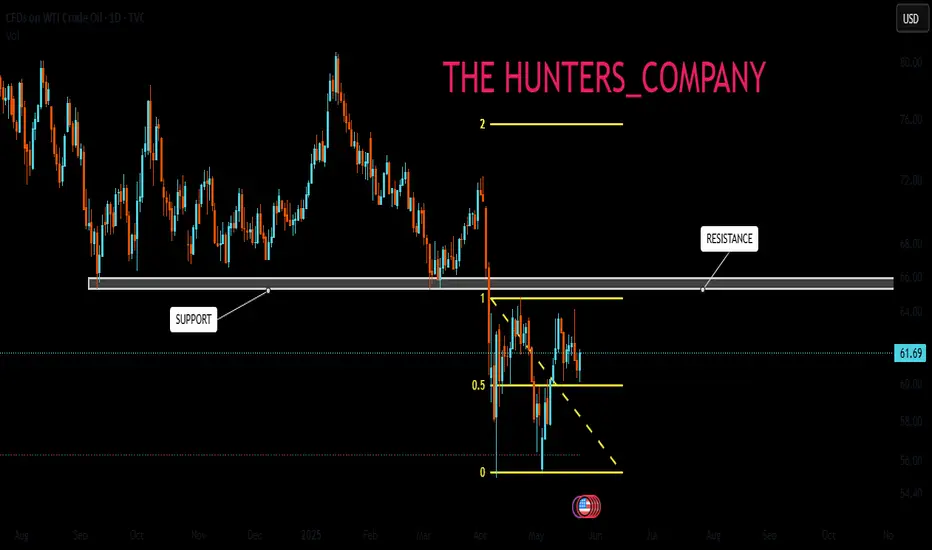
USOIL : What will happen to the price of oil?Hello friends
As you can see, we had support in the past, which has now become a strong resistance for the price after it was broken.
Now we need to see if the price will manage to break it at this moment when it is close to its key and sensitive resistance.
*Trade safely with us*
Forecast of the market trend at the opening on Monday”Oil prices remained under pressure this week, experiencing a notable decline due to multiple factors. As of Friday's Asian morning session, Brent crude futures fell 37 cents to $64.07 per barrel, while U.S. WTI crude futures dropped 39 cents to $60.81 per barrel. Brent crude fell 2% for the week, while WTI declined 2.7%.
Key Drivers of Oil Price Weakness
Stronger U.S. Dollar
The U.S. House of Representatives passed President Donald Trump’s tax-cut and fiscal spending bill, boosting the U.S. dollar index against a basket of currencies.
As oil is dollar-denominated, a stronger dollar typically reduces purchasing power for non-USD buyers, suppressing oil prices.
Supply-Demand Sensitivity and Market Sentiment
The combination of dollar strength and expectations of OPEC+ production increases has intensified bearish sentiment in the oil market.
While demand is gradually recovering, significant upward pressure on supply—including potential output hikes from OPEC+ and rising U.S. shale production—has created near-term volatility.
Technical Outlook and Trading Strategy
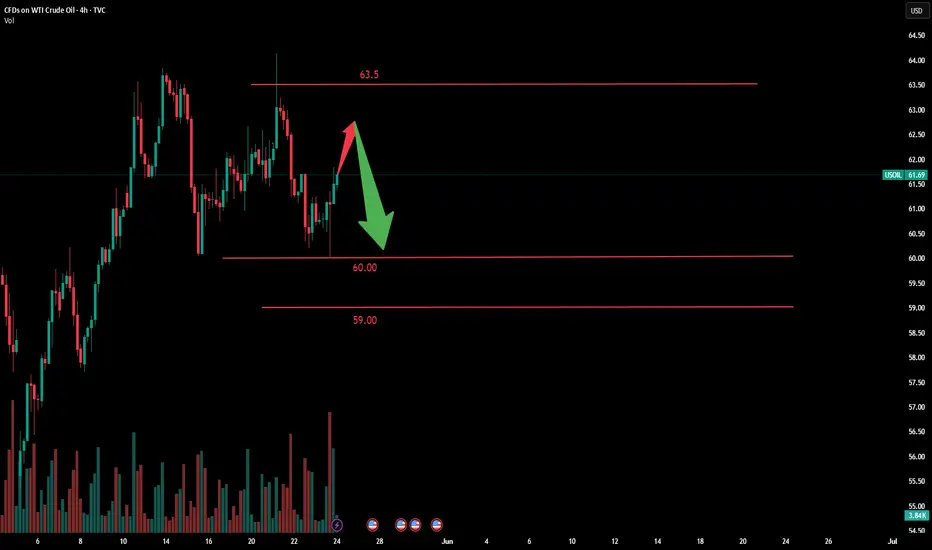
Short-Term Trend: Oil prices are likely to remain in a sideways-to-downward oscillation due to supply-demand imbalances.
Key Levels:
Resistance: $63.0–$63.5 per barrel (short-term overhead resistance).
Support: $60.5–$60.0 per barrel (critical near-term support zone).
Trading Approach:
Consider rebound shorting as the primary strategy, with retracement buying as a secondary approach.
Use rallies toward $63.0–$63.5 to initiate short positions, targeting support at $60.5–$60.0, with stop-losses above $64.0.
Note: Monitor OPEC+ policy updates and U.S. inventory data for potential shifts in market sentiment. Volatility may rise ahead of key economic indicators.
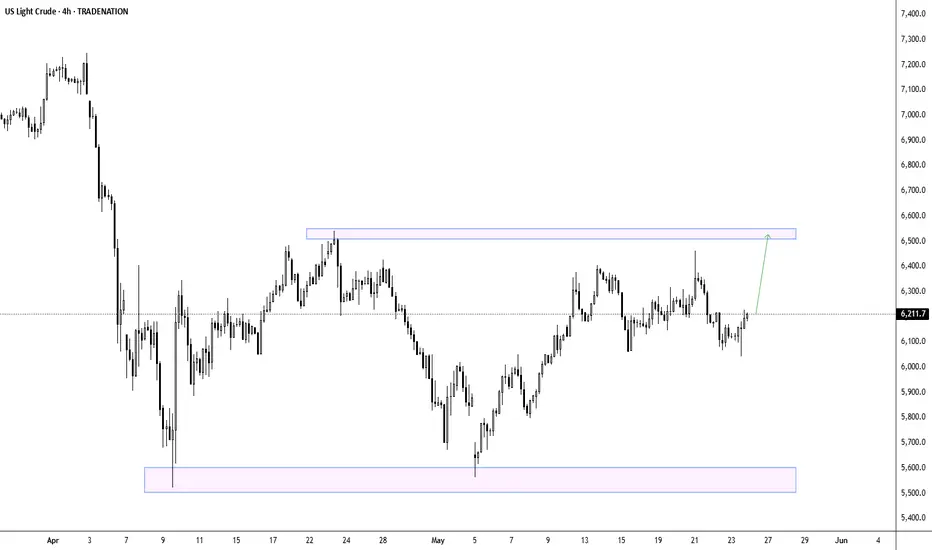
WTI - Bullish Momentum Targets $65US Light Crude has demonstrated remarkable resilience after experiencing a significant correction from March highs around $72 down to the $55 support zone in late April. The commodity has since staged an impressive recovery, climbing steadily from those April lows to current levels near $62, effectively reclaiming more than half of the previous decline. This recovery pattern suggests strong underlying demand and buying interest at lower levels, with crude oil successfully breaking above key resistance areas during its ascent. The current price action shows the market consolidating near recent highs while maintaining an upward bias, with the technical structure indicating further upside potential toward the resistance zone highlighted around $65. Given the strong bounce from support, sustained momentum, and the overall recovery trajectory, the higher probability scenario favors a continuation of the bullish move targeting the upper resistance band.
Disclosure: I am part of Trade Nation's Influencer program and receive a monthly fee for using their TradingView charts in my analysis.
USOIL: Market of Sellers
Our strategy, polished by years of trial and error has helped us identify what seems to be a great trading opportunity and we are here to share it with you as the time is ripe for us to sell USOIL.
Disclosure: I am part of Trade Nation's Influencer program and receive a monthly fee for using their TradingView charts in my analysis.
❤️ Please, support our work with like & comment! ❤️
USOIL: Bulls Are Winning! Long!
My dear friends,
Today we will analyse USOIL together☺️
The market is at an inflection zone and price has now reached an area around 61.687 where previous reversals or breakouts have occurred.And a price reaction that we are seeing on multiple timeframes here could signal the next move up so we can enter on confirmation, and target the next key level of 62.377.Stop-loss is recommended beyond the inflection zone.
❤️Sending you lots of Love and Hugs❤️
Stock Markets, Gold, Silver: Run With The Bulls!In this Weekly Market Forecast, we will analyze the S&P 500, NASDAQ, DOW JONES, Gold and Silver futures, for the week of May 25 - 31st.
The Stock Markets are bullish, so run with valid buy setups when they form.
Gold and Silver are relatively strong. With tensions in Gaza and Iran, this is expected. Valid buys should be taken.
Crude Oil is a tad bearish due to US inventories, so valid sells are warranted in the short term.
Enjoy!
May profits be upon you.
Leave any questions or comments in the comment section.
I appreciate any feedback from my viewers!
Like and/or subscribe if you want more accurate analysis.
Thank you so much!
Disclaimer:
I do not provide personal investment advice and I am not a qualified licensed investment advisor.
All information found here, including any ideas, opinions, views, predictions, forecasts, commentaries, suggestions, expressed or implied herein, are for informational, entertainment or educational purposes only and should not be construed as personal investment advice. While the information provided is believed to be accurate, it may include errors or inaccuracies.
I will not and cannot be held liable for any actions you take as a result of anything you read here.
Conduct your own due diligence, or consult a licensed financial advisor or broker before making any and all investment decisions. Any investments, trades, speculations, or decisions made on the basis of any information found on this channel, expressed or implied herein, are committed at your own risk, financial or otherwise.

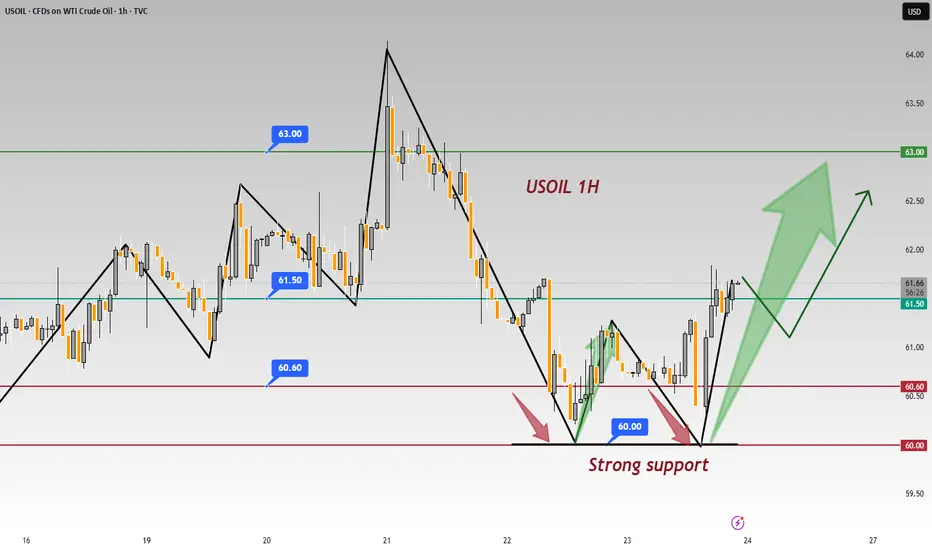
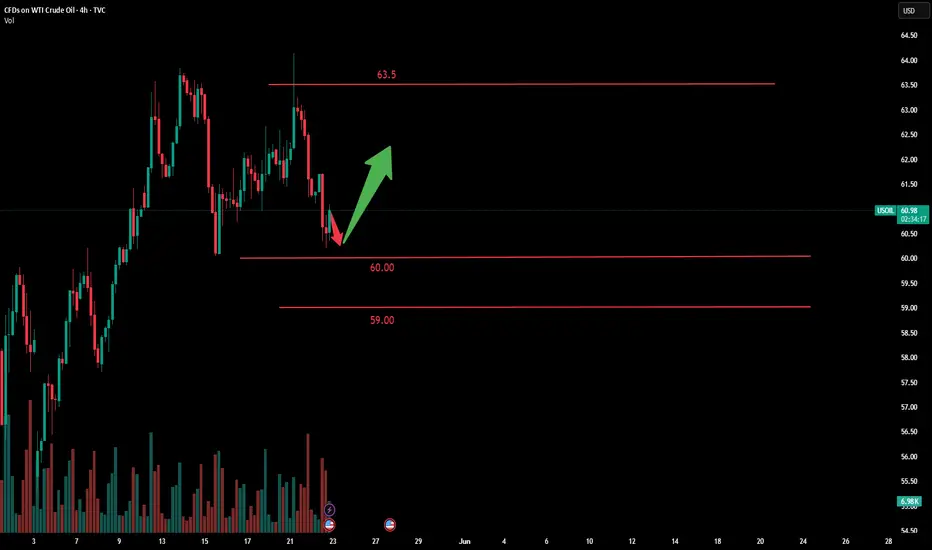
In - depth: USOIL 1 - hr Chart - Significance of 60.00 Support In the USOIL 1 - hour chart, 60.00 acts as a strong support 💪.
Support Validation
The price twice failed to break 60.00 and rebounded 📈. Psychologically, investors see 60.00 as a key level 🔑. Approaching it, buy orders pour in as they think crude oil is undervalued 📉. Technically, it's on a support line from prior lows, and repeated tests have fortified its support 🛡️.
⚡️⚡️⚡️ USOil ⚡️⚡️⚡️
🚀 Buy@ 60.00 - 60.60
🚀 TP 62.50 - 62.80
Accurate signals are updated every day 📈 If you encounter any problems during trading, these signals can serve as your reliable guide 🧭 Feel free to refer to them! I sincerely hope they'll be of great help to you 🌟 👇
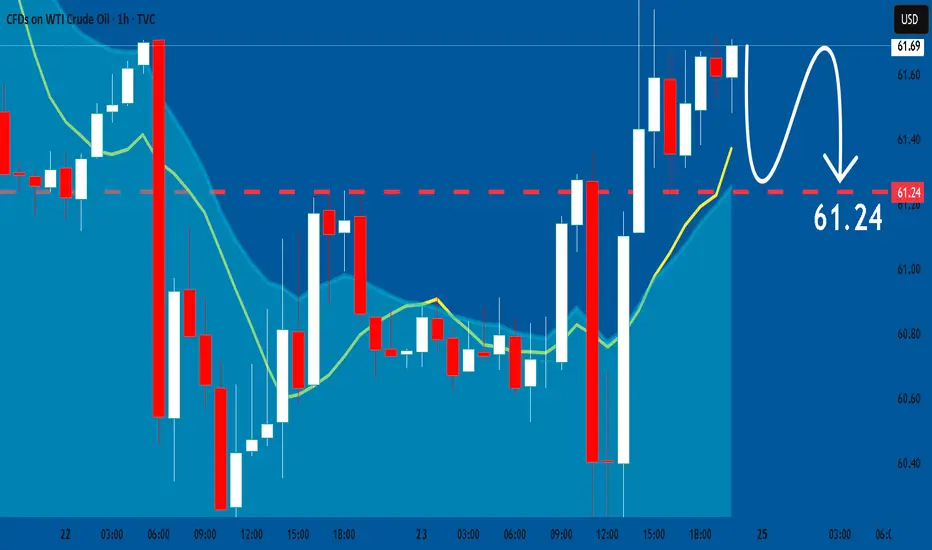
USOIL Under Pressure! SELL!
My dear friends,
Please, find my technical outlook for USOIL below:
The price is coiling around a solid key level - 61.69
Bias - Bearish
Technical Indicators: Pivot Points Low anticipates a potential price reversal.
Super trend shows a clear sell, giving a perfect indicators' convergence.
Goal - 61.18
About Used Indicators:
The pivot point itself is simply the average of the high, low and closing prices from the previous trading day.
Disclosure: I am part of Trade Nation's Influencer program and receive a monthly fee for using their TradingView charts in my analysis.
———————————
WISH YOU ALL LUCK

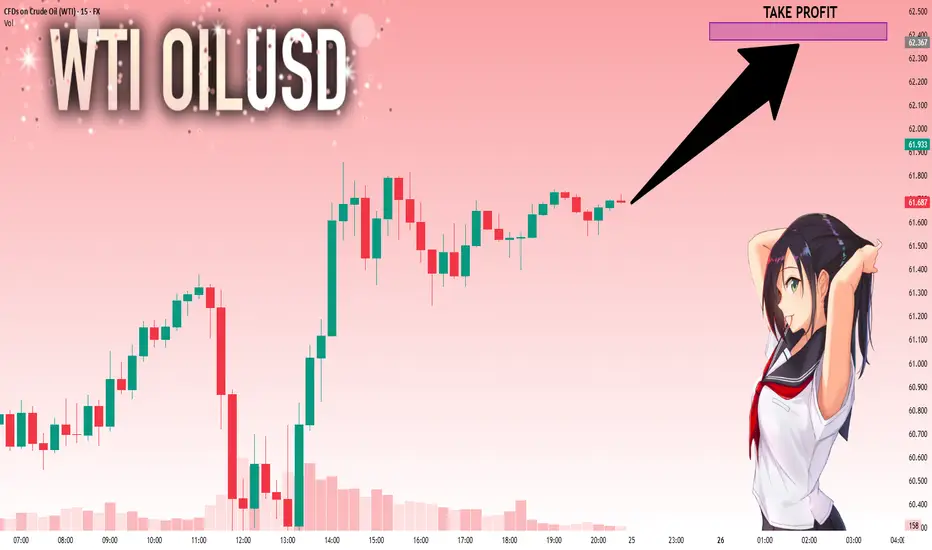
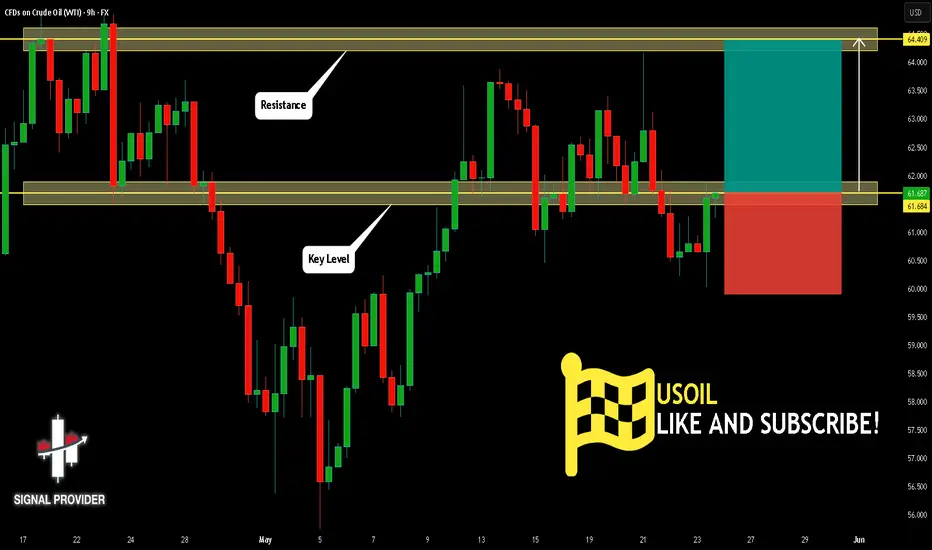
USOIL Will Go Higher From Support! Buy!
Please, check our technical outlook for USOIL.
Time Frame: 9h
Current Trend: Bullish
Sentiment: Oversold (based on 7-period RSI)
Forecast: Bullish
The price is testing a key support 61.684.
Current market trend & oversold RSI makes me think that buyers will push the price. I will anticipate a bullish movement at least to 64.409 level.
P.S
Please, note that an oversold/overbought condition can last for a long time, and therefore being oversold/overbought doesn't mean a price rally will come soon, or at all.
Disclosure: I am part of Trade Nation's Influencer program and receive a monthly fee for using their TradingView charts in my analysis.
Like and subscribe and comment my ideas if you enjoy them!
SELL USOILAs we had analysed the US DOLLAR which we expect big drop, in todays session we are monitoring USOIL for selling opportunities . Our entry is at 60.75 and stops above 61.50. Targets are 59.00 and below. Use proper risk management.

WTI Oil H4 | Pullback support at 50% Fibonacci retracementWTI oil (USOIL) is falling towards a pullback support and could potentially bounce off this level to climb higher.
Buy entry is at 59.71 which is a pullback support that aligns with the 50.0% Fibonacci retracement.
Stop loss is at 57.50 which is a level that lies underneath a swing-low support.
Take profit is at 63.72 which is a multi-swing-high resistance.
High Risk Investment Warning
Trading Forex/CFDs on margin carries a high level of risk and may not be suitable for all investors. Leverage can work against you.
Stratos Markets Limited (tradu.com ):
CFDs are complex instruments and come with a high risk of losing money rapidly due to leverage. 63% of retail investor accounts lose money when trading CFDs with this provider. You should consider whether you understand how CFDs work and whether you can afford to take the high risk of losing your money.
Stratos Europe Ltd (tradu.com ):
CFDs are complex instruments and come with a high risk of losing money rapidly due to leverage. 63% of retail investor accounts lose money when trading CFDs with this provider. You should consider whether you understand how CFDs work and whether you can afford to take the high risk of losing your money.
Stratos Global LLC (tradu.com ):
Losses can exceed deposits.
Please be advised that the information presented on TradingView is provided to Tradu (‘Company’, ‘we’) by a third-party provider (‘TFA Global Pte Ltd’). Please be reminded that you are solely responsible for the trading decisions on your account. There is a very high degree of risk involved in trading. Any information and/or content is intended entirely for research, educational and informational purposes only and does not constitute investment or consultation advice or investment strategy. The information is not tailored to the investment needs of any specific person and therefore does not involve a consideration of any of the investment objectives, financial situation or needs of any viewer that may receive it. Kindly also note that past performance is not a reliable indicator of future results. Actual results may differ materially from those anticipated in forward-looking or past performance statements. We assume no liability as to the accuracy or completeness of any of the information and/or content provided herein and the Company cannot be held responsible for any omission, mistake nor for any loss or damage including without limitation to any loss of profit which may arise from reliance on any information supplied by TFA Global Pte Ltd.
The speaker(s) is neither an employee, agent nor representative of Tradu and is therefore acting independently. The opinions given are their own, constitute general market commentary, and do not constitute the opinion or advice of Tradu or any form of personal or investment advice. Tradu neither endorses nor guarantees offerings of third-party speakers, nor is Tradu responsible for the content, veracity or opinions of third-party speakers, presenters or participants.

USOIL A Fall Expected! SELL!
My dear followers,
This is my opinion on the USOIL next move:
The asset is approaching an important pivot point 61.87
Bias - Bearish
Technical Indicators: Supper Trend generates a clear short signal while Pivot Point HL is currently determining the overall Bearish trend of the market.
Goal - 61.38
About Used Indicators:
For more efficient signals, super-trend is used in combination with other indicators like Pivot Points.
Disclosure: I am part of Trade Nation's Influencer program and receive a monthly fee for using their TradingView charts in my analysis.
———————————
WISH YOU ALL LUCK
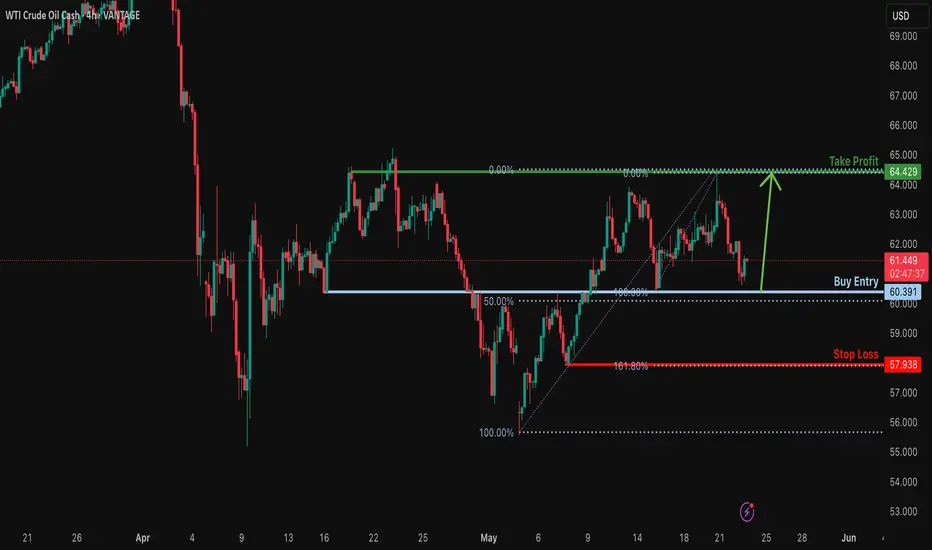
Bullish bounce?USO/USD is falling towards the support level which is an overlap support that lines up with the 50% Fibonacci retracement and could bounce from this level to our take profit.
Entry: 60.39
Why we like it:
There is an overlap support level that lines up with the 50% Fibonacci retracement.
Stop loss: 57.93
Why we like it:
There is a pullback support level that aligns with the 161.8% Fibonacci extension.
Take profit: 64.42
Why we like it:
There is a pullback resistance level.
Enjoying your TradingView experience? Review us!
Please be advised that the information presented on TradingView is provided to Vantage (‘Vantage Global Limited’, ‘we’) by a third-party provider (‘Everest Fortune Group’). Please be reminded that you are solely responsible for the trading decisions on your account. There is a very high degree of risk involved in trading. Any information and/or content is intended entirely for research, educational and informational purposes only and does not constitute investment or consultation advice or investment strategy. The information is not tailored to the investment needs of any specific person and therefore does not involve a consideration of any of the investment objectives, financial situation or needs of any viewer that may receive it. Kindly also note that past performance is not a reliable indicator of future results. Actual results may differ materially from those anticipated in forward-looking or past performance statements. We assume no liability as to the accuracy or completeness of any of the information and/or content provided herein and the Company cannot be held responsible for any omission, mistake nor for any loss or damage including without limitation to any loss of profit which may arise from reliance on any information supplied by Everest Fortune Group.
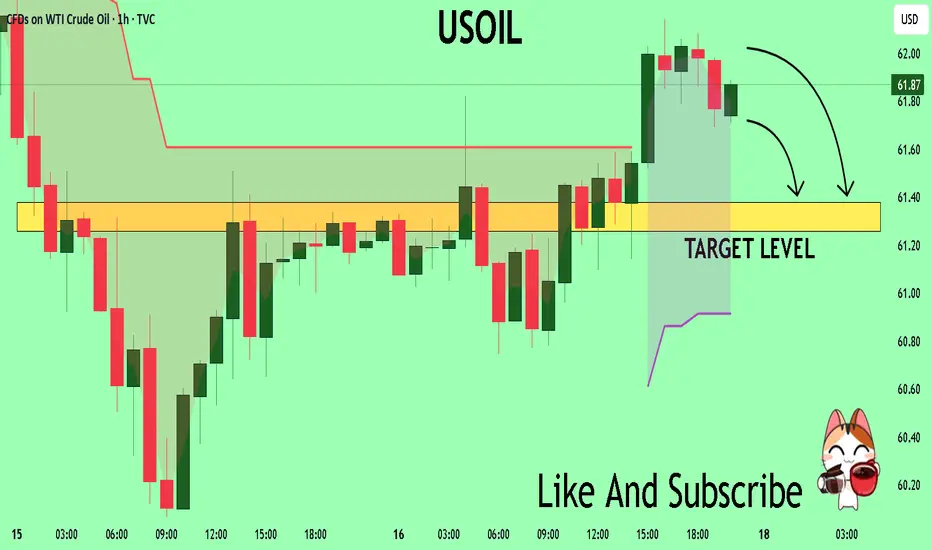
Latest Strategic Positioning for Crude OilDuring the US trading session, crude oil prices declined for the second consecutive trading day after rebounding from intraday lows and encountering resistance. The commodity traded at $60.42 per barrel, representing a 1.87% daily loss.
Per the Commitments of Traders (COT) report released last Friday, there exists a moderate divergence in sentiment between managed funds and asset management firms regarding WTI crude oil futures. While both investor categories maintain net long positions, over the prior two weeks, managed funds reduced their net long exposure by approximately 20,000 contracts, whereas large speculators increased their net long positions by 10,000 contracts.
Technically, crude oil exhibited a "rally-and-reversal" pattern today, retreating under selling pressure near the $61.7 resistance zone before stabilizing and rebounding around $60.0. Current price action indicates a range-bound oscillation, with bullish stabilization probabilities contingent on the $60.0 support level holding firm.
In summary, crude oil remains trapped in a narrow consolidation phase, with overhead resistance levels retaining dominance. For today's trading strategy, a "rebound shorting-first" approach is recommended, complemented by tactical long positions on dips. Key resistance lies between $61.7-$62.5, while support zones are identified at $60.0-$59.0.
In the market, there are no absolutes, and neither upward nor downward trends are set in stone. Therefore, the ability to judge the balance between market gains and losses is your key to success. Let money become our loyal servant.
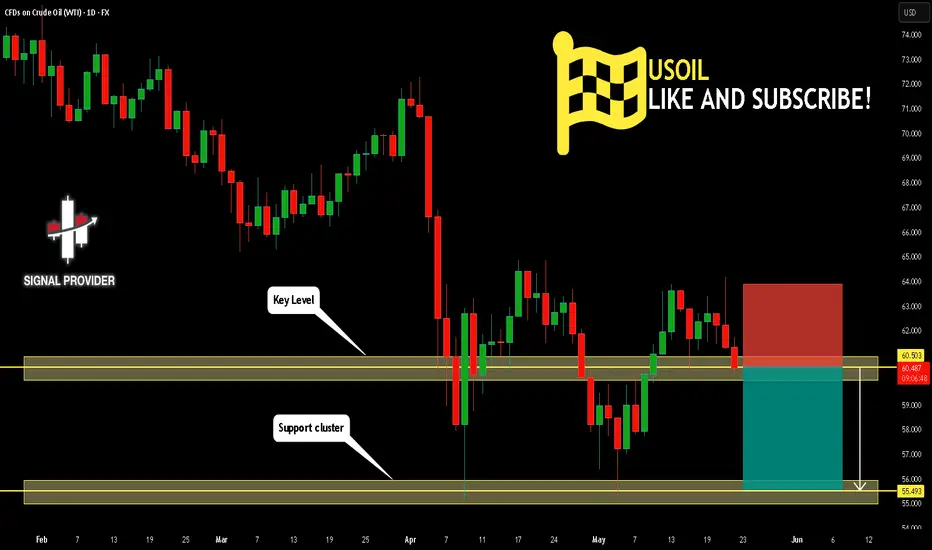
USOIL Will Fall! Short!
Take a look at our analysis for USOIL.
Time Frame: 1D
Current Trend: Bearish
Sentiment: Overbought (based on 7-period RSI)
Forecast: Bearish
The market is testing a major horizontal structure 60.503.
Taking into consideration the structure & trend analysis, I believe that the market will reach 55.493 level soon.
P.S
Please, note that an oversold/overbought condition can last for a long time, and therefore being oversold/overbought doesn't mean a price rally will come soon, or at all.
Disclosure: I am part of Trade Nation's Influencer program and receive a monthly fee for using their TradingView charts in my analysis.
Like and subscribe and comment my ideas if you enjoy them!
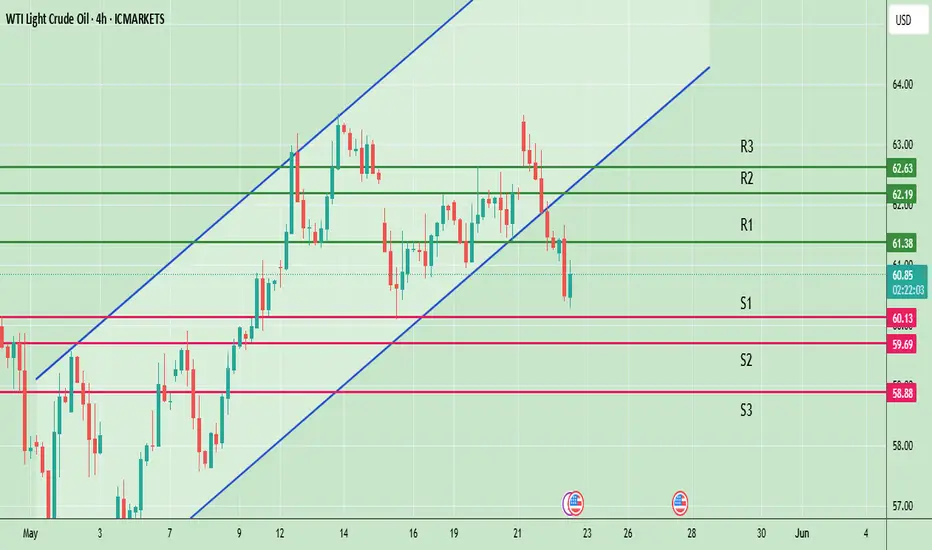
USOil Dips Amid Global Demand WorriesXTI/USD is currently exhibiting bearish technical signals, with key indicators pointing towards potential further declines. However, the presence of oversold conditions suggests that a short-term rebound could occur if prices find support at current levels. Traders should monitor the $60.13 support and $61.38 resistance levels closely, as breaks of these levels could signal the next directional move.
XTI/USD is experiencing a noticeable downward shift in market sentiment. After a period of relative stability, prices have started to decline, influenced primarily by concerns over global demand and shifting geopolitical conditions. Despite earlier support from tensions in Eastern Europe and U.S. sanctions on Russian energy exports, the market now appears to be reacting more to economic headwinds, such as signs of slowing industrial growth in major economies like China and the Eurozone. Traders are closely watching whether current support levels will hold or if the recent downward momentum will lead to a deeper correction. Overall, the sentiment leans cautious, with traders waiting for clearer signals from both supply-side developments and macroeconomic indicators.
Pivot Points:
Support Levels: S1 at $60.13, S2 at $59.69, S3 at $58.88.
Resistance Levels: R1 at $61.38, R2 at $62.19, R3 at $62.63.
Bearish Outlook
Trigger: A break below the $60.13 support level.
Targets: $59.69 followed by $58.88
Invalidation: A decisive move above the $61.38 resistance level.
Bullish Outlook
Trigger: A sustained break above the $61.38 resistance level.
Targets: $62.19 followed by $62.63
Invalidation: A drop below the $60.13 support level.
Note
Please risk management in trading is a Key so use your money accordingly. If you like the idea then please like and boost. Thank you and Good Luck!
Will Middle East Tensions Ignite a Global Oil Crisis?The global oil market faces significant turbulence amidst reports of potential Israeli military action against Iran's nuclear facilities. This looming threat has triggered a notable surge in oil prices, reflecting deep market anxieties. The primary concern stems from the potential for severe disruption to Iran's oil output, a critical component of global supply. More critically, an escalation risks Iranian retaliation, including a possible blockade of the Strait of Hormuz, a vital maritime chokepoint through which a substantial portion of the world's oil transits. Such an event would precipitate an unprecedented supply shock, echoing historical price spikes seen during past Middle Eastern crises.
Iran currently produces around 3.2 million barrels per day and holds strategic importance beyond its direct volume. Its oil exports, primarily to China, serve as an economic lifeline, making any disruption profoundly impactful. A full-scale conflict would unleash a cascade of economic consequences: extreme oil price surges would fuel global inflation, potentially pushing economies into recession. While some spare capacity exists, a prolonged disruption or a Hormuz blockade would render it insufficient. Oil-importing nations, particularly vulnerable developing economies, would face severe economic strain, while major oil exporters, including Saudi Arabia, the US, and Russia, would see substantial financial gains.
Beyond economics, a conflict would fundamentally destabilize the geopolitical landscape of the Middle East, unraveling diplomatic efforts and exacerbating regional tensions. Geostrategically, the focus would intensify on safeguarding critical maritime routes, highlighting the inherent vulnerabilities of global energy supply chains. Macroeconomically, central banks would confront the difficult task of managing inflation without stifling growth, leading to a surge in safe-haven assets. The current climate underscores the profound fragility of global energy markets, where geopolitical developments in a volatile region can have immediate and far-reaching global repercussions.
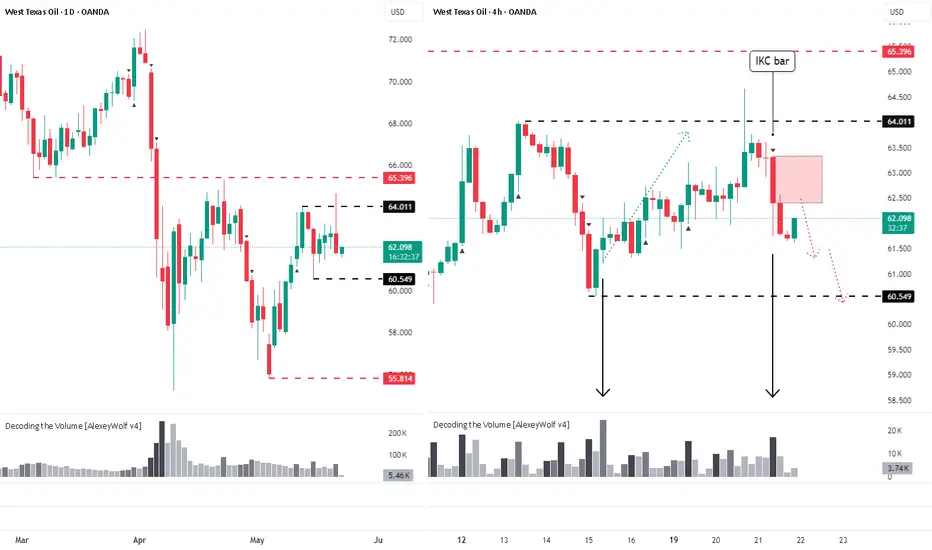
WTI Crude: Bears Target 60.549 USDHey traders and investors!
🔹 Crude Oil — 1D / 4H
📍 Context
Daily (1D): clear short trend; price capped below 65.40 USD.
4-Hour (4H): sideways range — its boundaries are marked by black lines on the chart — with seller initiative in control.
Higher-time-frame levels reinforce the bearish bias.
🔎 Analysis
Sellers keep the upper hand on 4H. The daily shows no strong buyer bars, sustaining downward pressure. If price retests the IKC zone and prints bearish confirmation (high-volume seller bar or buyer absorption), the odds of breaking 60.549 USD increase.
🎯 Trade Idea
Setup: hunt for short patterns inside the IKC range.
Target: 60.549 USD (range low).
Confirmation: pattern on M15–H1 + seller-side volume.
📌 Takeaway
Bears remain in control. Wait for a trigger inside the IKC zone and lower-TF confirmation before joining the move toward 60.549 USD.
This analysis is based on the Initiative Analysis concept (IA).
Wishing you profitable trades!