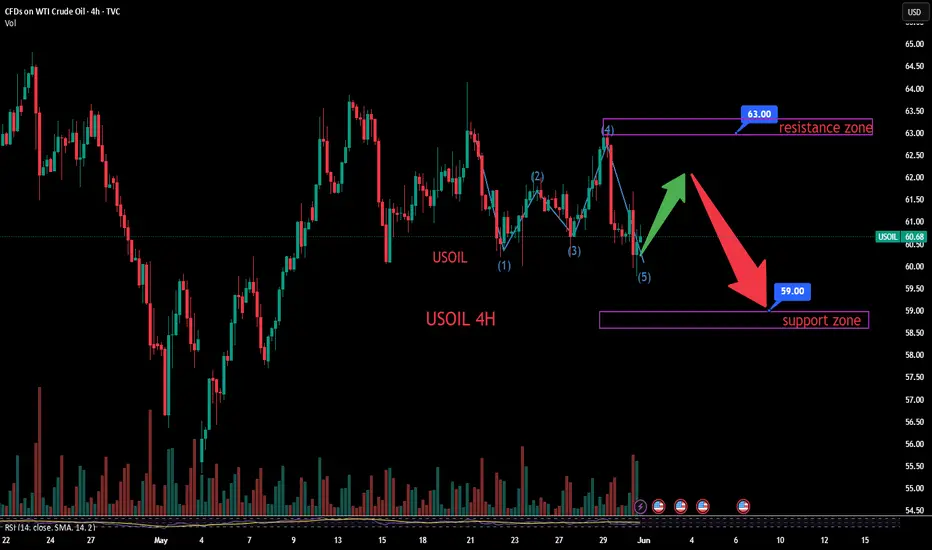
USOIL Trade Setup: Watching for a Bullish Break After Pullback 📈 US OIL Trade Plan
Currently, USOIL is in a strong bullish trend 🔥 — price action has pushed into overextended territory, which opens the door for a potential pullback 🌀.
I'm watching for a WTI retracement into equilibrium, ideally aligning with the 50%–61.8% Fibonacci levels from the previous swing low to high 🔍📉. If price corrects into that zone and we find support, followed by a bullish break in market structure 💥 — that would be the confirmation I’m waiting for to consider a long position 🚀.
⚠️ Key Level to Watch: That structure break is the trigger — no confirmation, no trade 🧠.
⚠️ Disclaimer:
This content is for educational and informational purposes only and should not be considered financial advice. Always conduct your own analysis and consult a professional before making trading decisions. Trade responsibly.
Usoilanalysis

The rollover of crude oil contracts leads to price differences.Crude oil is currently in the contract rollover phase, and prices may vary between different brokers. For specific trading strategies, you can contact me directly, and I will provide you with accurate trading strategies accordingly.
I am committed to sharing trading signals every day. Among them, real-time signals will be flexibly pushed according to market dynamics. All the signals sent out last week accurately matched the market trends, helping numerous traders achieve substantial profits. Regardless of your previous investment performance, I believe that with the support of my professional strategies and timely signals, I will surely be able to assist you in breaking through investment bottlenecks and achieving new breakthroughs in the trading field.

Possible "W Pattern" Initiation After Breaking Through $64.5USOIL surged strongly last Friday, closing with a large bullish candle on the daily chart. Since the sharp decline on April 4th, the $64.5 level has acted as resistance on the chart. The price remained capped at $64.5 for four consecutive trading days (Monday to Thursday) last week, but Friday’s strong bullish candle successfully broke above $64.5, signaling a valid breakout. This breakout suggests the formation of a potential W-bottom pattern, paving the way for further upward movement. Crude oil is expected to continue rising to new highs in today's trading.
USOIL
buy@63.5-64
tp:64.7-65.2
I am committed to sharing trading signals every day. Among them, real-time signals will be flexibly pushed according to market dynamics. All the signals sent out last week accurately matched the market trends, helping numerous traders achieve substantial profits. Regardless of your previous investment performance, I believe that with the support of my professional strategies and timely signals, I will surely be able to assist you in breaking through investment bottlenecks and achieving new breakthroughs in the trading field.

Crude oil breaks through strongly.On the daily chart of crude oil, the upper Bollinger Band is opening upward, and the 64.85 level is basically unable to hold. Once this level is broken, it will open up upward space, and the rally will just be beginning. After the breakout, the market will shift from the previous sustained oscillation to a strong unilateral trend, and the rally will at least continue with a wave of strength. Focus on going long at 63.50/64, or if there is a strong rally in the European session, pullbacks in the US session are also buying opportunities. Now it is about whether there will be a strong breakout.
Humans need to breathe, and perfect trading is like breathing—maintaining flexibility without needing to trade every market swing. The secret to profitable trading lies in implementing simple rules: repeating simple tasks consistently and enforcing them strictly over the long term.
Trading Strategy:
buy@63.5-64.0
TP:65.5-66.0
$USOIL & $XLE: Sustainable bull run or short-term bounce?Recently the commodities and the commodity stocks are having a bull run. Oil being one of the largest categories within the Bloomberg Commodity Index Futures is late to the party after the AMEX:GLD rally. In my recent posts I made the case that the TVC:USOIL will remain range bound, and we will see 55 $ in $USOIL. But since then, TVC:USOIL has gone through a small rally with price currently @ 65 $ which has taken it closer to the 0.5 Fib retracement level. AMEX:XLE , which represents the S&P500 energy sector stocks, is also attempting to post a rally.
In the short-term markets have diverged from our last predictions. Let’s be honest in the short term such rallies might be accompanied by short covering and the weakness in TVC:DXY is also helping the Energy rally. But now the question comes where do we go from here?
TVC:USOIL and AMEX:XLE can have a bull rally due to short covering and momentum pushing it across the 0.5 Fib level. If TVC:USOIL breaks above 0.5 then the next stop 0.618 will take us 80 $ indicating a 25% upside form here. And a similar upside in the AMEX:XLE will take us 131 $, which is also 25% up from its current value and the upper range of the upward slopping channel indicative from the chart.
Verdict: Short term probable bounce in TVC:USOIL and $XLE. Long term bearish on TVC:USOIL with target 55 - 60 $.

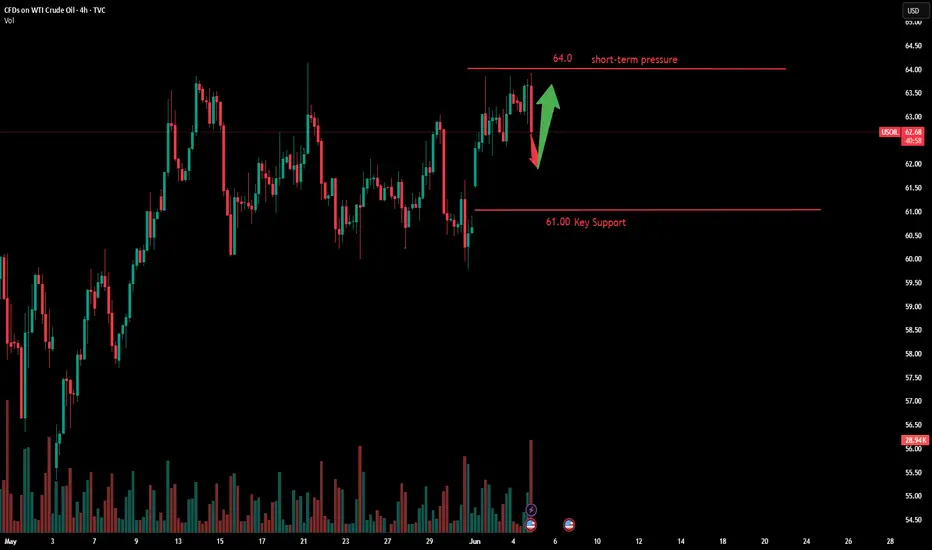
USOIL:Wait 63.6-64 to go long
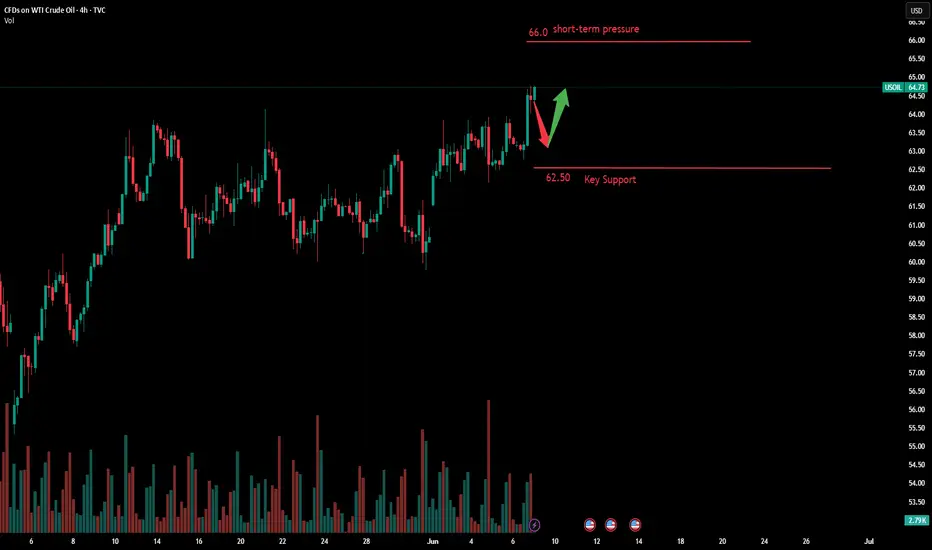
Affected by last week's data, crude oil directly broke through the short-term pressure 64, technical point of view of the daily track upward opening, 64.8 position basically can not hold, and once the break open the space for rise, the rise has just begun;
After breaking from the early continuous shock to a strong unilateral, the market will at least continue a wave of strength, pay attention to 63.6-64 range to do more, or the European market force to rise, the United States is also more, now is to see a strong break.
Trading Strategy:
BUY@63.6-64
TP: 65-65.2
↓↓↓ More detailed strategies and trading will be notified here ↗↗↗
↓↓↓ Keep updated, come to "get" ↗↗↗

USOIL:Sharing of the Trading Strategy for Next WeekAll the trading signals this week have resulted in profits!!! Check it!!!👉👉👉
Fundamental Analysis:
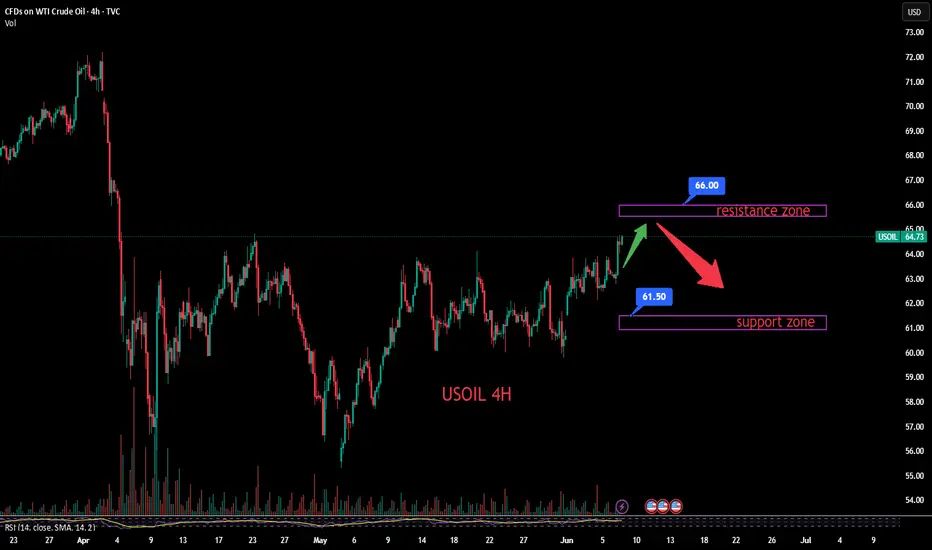
OPEC+ plans to increase production by 411K bpd in July, with major producers like Saudi Arabia and the UAE holding ample idle capacity. This expansion could exacerbate global crude oil oversupply, pressuring prices. Concurrently, the U.S. steel import tariff hikes may trigger trade frictions, dampening global economic recovery and curbing industrial crude demand.
Technical Analysis:
The MACD indicator shows expanding green bars (bearish momentum), with short-term moving averages trending toward a bearish crossover of long-term averages. However, recent price retracement from relative highs suggests potential rebound. Key resistance lies at the $66–67/barrel zone, while critical support holds at $61.5–62/barrel.
Trading Recommendation:
Aggressive traders may initiate light short positions near 66 on a confirmed resistance rejection.
Trading Strategy:
Sell@66-65.5
TP:63-62
Share accurate trading signals daily—transform your life starting now!
👇 👇 👇 Obtain signals👉👉👉
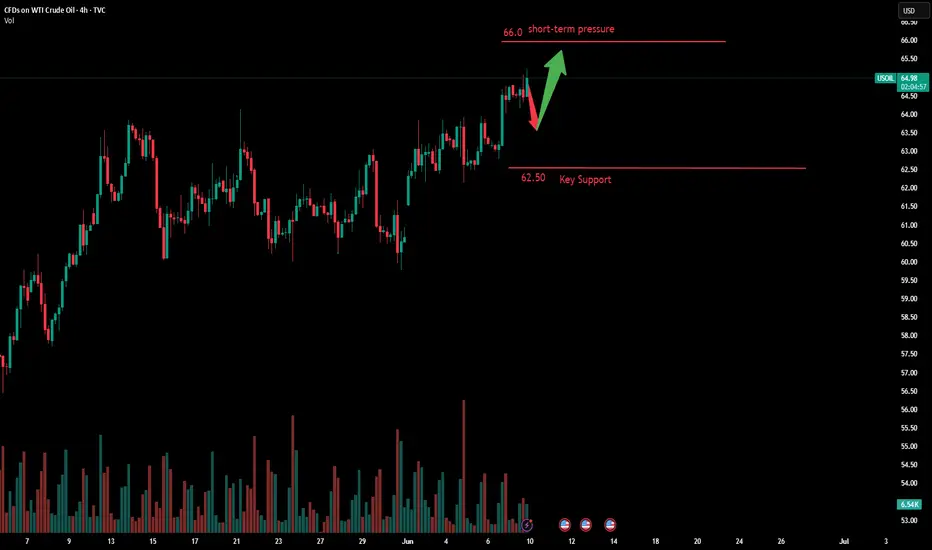
Analysis of Upward/Downward Trends in Monday's Opening MarketBoosted by the telephone conversation between leaders of the world's two largest economies, oil prices maintained their upward momentum on Friday. Brent crude stabilized at around $65 per barrel, notching its first weekly rebound since mid-May; WTI crude also held near $63. "Against the backdrop of gradually easing macro uncertainties, the risk of panic selling in the market has significantly diminished," analysts said. "With the arrival of the summer peak demand season and the superimposition of geopolitical tensions in the Middle East and Russia, the downside for oil prices has been notably constrained."
The recent steady rebound in oil prices indicates that the market has gradually digested macro uncertainties, though the underlying supporting factors remain fragile. While trade concerns have temporarily subsided, whether OPEC+ will continue to release capacity as expected by the market will be key to determining whether oil prices can sustain their rebound. Meanwhile, the options market reflects expectations of a year-end supply glut, which will test the coordination capabilities of oil-producing countries.
Overall, for next week's crude oil trading strategy, it is recommended to prioritize buying on dips and supplement with shorting on rebounds. In the short term, monitor resistance at the $66.0-$67.0 level, while short-term support lies at the $63.5-$62.5 level.
Humans need to breathe, and perfect trading is like breathing—maintaining flexibility without needing to trade every market swing. The secret to profitable trading lies in implementing simple rules: repeating simple tasks consistently and enforcing them strictly over the long term.
Trading Strategy:
buy@62.0-62.5
TP:64.5-65.0
USOIL:The strategy of going short
USOIL: Same thinking, still maintain the short strategy. Friends with short orders at 63.3-63.5 continue to wait, can increase short orders near 63.8, the target is 62.5-62.3 unchanged
↓↓↓ More detailed strategies and trading will be notified here ↗↗↗
↓↓↓ Keep updated, come to "get" ↗↗↗
Crude Oil is Building Momentum for a BreakoutDuring the U.S. trading session on Thursday, international oil prices fluctuated higher, with U.S. crude oil currently trading near $63.55 per barrel. Despite the intraday volatility, international oil prices remain under downward pressure, primarily influenced by two key factors.
First, data from the U.S. Energy Information Administration (EIA) showed that as of last week, U.S. gasoline and distillate inventories increased more than expected, signaling weakening refined product demand in the world’s largest economy. This development has sparked investor concerns about whether the U.S. summer driving season can sustain demand growth, leading to a ~1% decline in oil prices on Wednesday.
The current crude oil market is caught between supply and demand headwinds:
Supply-side pressures: OPEC+’s production increase plan and Saudi Arabia’s strategic price cuts have created short-term bearish sentiment.
Demand-side uncertainties: The unexpected rise in U.S. refined product inventories has amplified market doubts about the vigor of global consumption recovery.
Additionally, the escalation of international trade frictions has further dampened risk appetite, exacerbating downward pressure on prices.
In the short term, oil prices are likely to continue oscillating within the $60–$65 per barrel range. Market participants should closely monitor U.S. macroeconomic data and OPEC+’s compliance with its production policies for directional cues.
Humans need to breathe, and perfect trading is like breathing—maintaining flexibility without needing to trade every market swing. The secret to profitable trading lies in implementing simple rules: repeating simple tasks consistently and enforcing them strictly over the long term.
Trading Strategy:
buy@61.5-62.0
TP:63.0-63.5

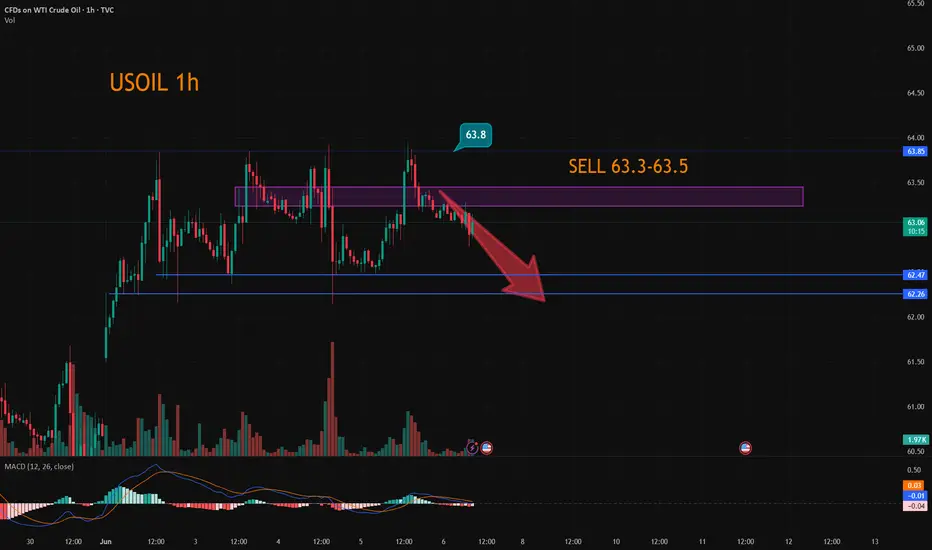
USOIL:Go short first today
USOIL: Crude oil downward momentum gradually stronger, the day's trend is weak, trading ideas first short.
Trading Strategy:
SELL@63.3-63.5
TP: 62.5-62.3
↓↓↓ More detailed strategies and trading will be notified here ↗↗↗
↓↓↓ Keep updated, come to "get" ↗↗↗

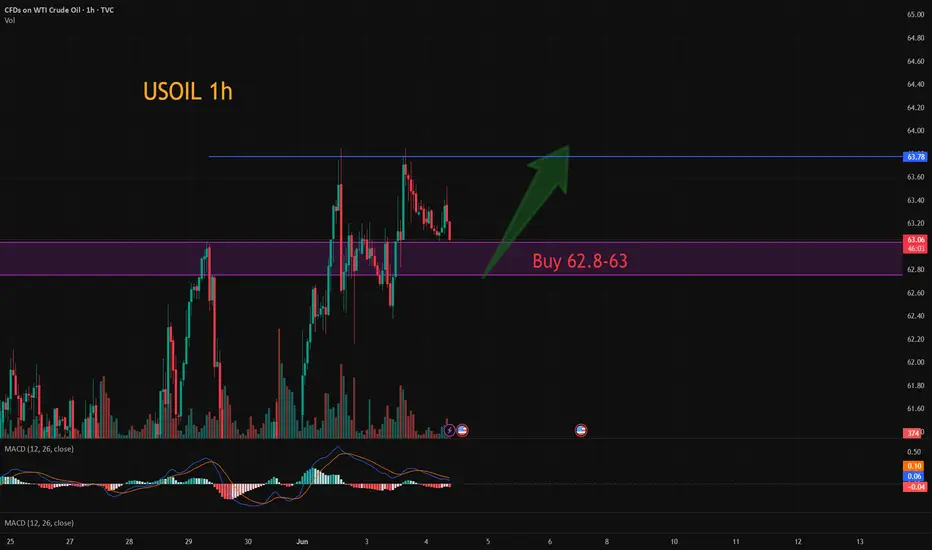
USOIL:tay long
USOIL: The short-term objective trend is oscillating. In terms of momentum, the MACD indicator is above the zero axis, showing a top divergence, indicating that the upward momentum is weakening. In the first two trading days, the overall rhythm trend was alternating between primary and secondary, and it is expected that the intraday crude oil trend will still maintain the probability of shock upward, so maintain the long idea.
Trading can wait for the retracement after the long.
Trading Strategy:
BUY@62.8-63
TP: 63.8-64
↓↓↓ More detailed strategies and trading will be notified here ↗↗↗
↓↓↓ Keep updated, come to "get" ↗↗↗
Maintain high-level volatility.In early trading on Wednesday in the Asian market, international oil prices fell slightly, mainly affected by the easing of supply-demand balance and the drag on the global economic outlook from trade concerns. Brent crude oil futures fell 0.1% to $65.58 per barrel, while U.S. WTI crude oil fell 0.1% to $63.32. This decline came after both rose about 2% in the previous trading day, hitting two-week highs. Tuesday's rally was driven by two main factors: first, large-scale wildfires in Canada since early May, which caused thousands of people to evacuate and disrupted part of crude oil production; second, markets expected Asian countries to reject the nuclear agreement draft proposed by the United States, thereby maintaining sanctions on the major oil-producing country and reducing crude oil supply. The current international oil market is in a game of multiple forces. On the one hand, geopolitical factors and natural disasters have increased short-term supply risks; on the other hand, OPEC+ production expansion and trade concerns have constrained the sustainability of price rebounds. In the absence of clear policy directions and confirmation from inventory data, oil prices may remain volatile at high levels.
Humans need to breathe, and perfect trading is like breathing—maintaining flexibility without needing to trade every market swing. The secret to profitable trading lies in implementing simple rules: epeating simple tasks consistently and enforcing them strictly over the long term.
Trading Strategy:
buy@62.0-62.5
TP:63.5-64.0
USOIL LETS MAKE OIL GREAT AGAIN TO 80$HELLO TRADERS
As i can see USOIL it formaing H & S pattrent and now trading above a strong Weekly horizontal Support zone if prices hold above 65$ then given Tp can be easy target if we see a higher demand and tight supply with the War going on around the world its a huge possibilty that pricce can shoot up we have to monitor the 65$ price zone which is importat to hold bull cycle on smaller TF 4HR it is creating Wickoff pattren too and we can see Fibo levels golden ratio can hit our targers or risk reward is great for us becaus we was buying the dip in May it is just starting chart is crystal clear its just a trade idea share your thoughts we appriciate ur comments and support Stay tuned for more updates

Crude oil surges stronglyInternational oil prices rose in early Asian trading on Tuesday, primarily driven by heightened risks of supply disruptions. Iran is expected to reject a U.S.-proposed nuclear deal proposal that could have paved the way for easing sanctions on Iranian oil exports. Additionally, wildfires in Alberta, Canada, have suspended part of oil and gas production, exacerbating market concerns about supply. Brent crude rose 0.85% to $65.18 per barrel, while U.S. West Texas Intermediate (WTI) crude gained 0.75% to $62.97, extending a nearly 3% rally from the previous session.
The current oil price surge reflects the effect (superimposition) of multiple factors, including geopolitical uncertainties and sudden natural disasters. Notably, the market’s reaction to the OPEC+ production increase strategy highlights its high sensitivity to supply-side control. The Iran and Canada incidents have further underscored the short-term vulnerability of the global oil market. If U.S.-Iran negotiations completely collapse or wildfires continue to spread, oil prices may sustain their upward momentum.
Technically, the K-line chart has repeatedly formed bullish candlesticks with long lower shadows and small real bodies, indicating strong buying support at lower levels. Short-term intraday crude oil is expected to retain further upside potential.
Humans need to breathe, and perfect trading is like breathing—maintaining flexibility without needing to trade every market swing. The secret to profitable trading lies in implementing simple rules: repeating simple tasks consistently and enforcing them strictly over the long term.
Trading Strategy:
buy@62.0-62.5
TP:63.5-64.0

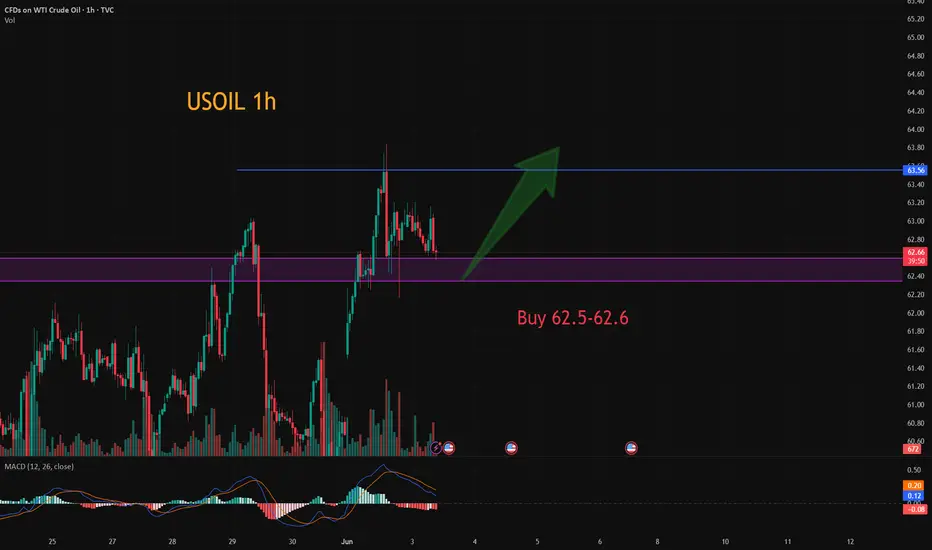
USOIL:Go long
Crude oil prices rose due to ongoing tariff uncertainty as well as ongoing geopolitical tensions in the Middle East.
From the chart, the K line has repeatedly appeared long lower shadow small solid positive line, indicating that the lower buying long support is strong. Expected intraday crude oil short - term trend still exists a wave of upward space.
Trading Strategy:
BUY@62.5-62.6
TP: 63.5-64
↓↓↓ More detailed strategies and trading will be notified here ↗↗↗
↓↓↓ Keep updated, come to "get" ↗↗↗
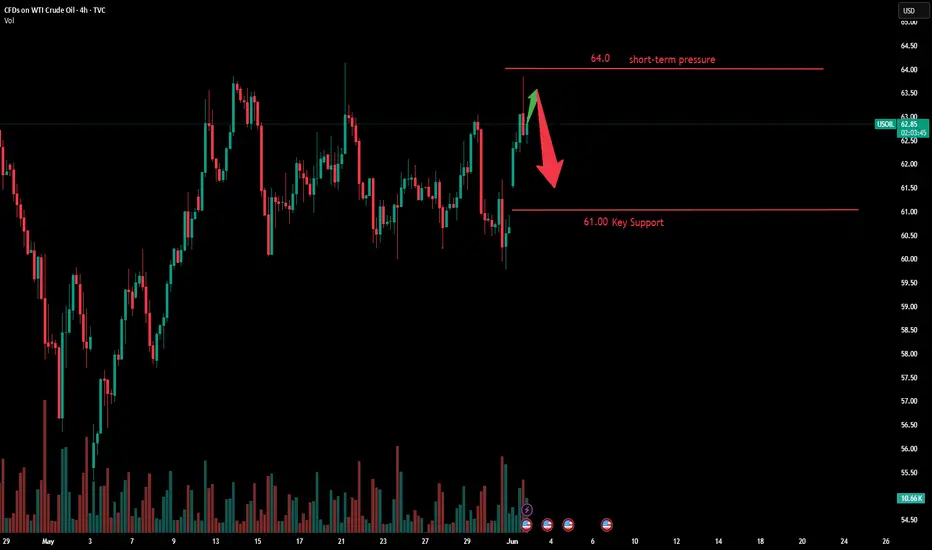
There remains a risk of further downside for crude oil prices.During Monday's US trading session, international oil prices rebounded strongly. The main US crude contract surged 2.5% at one point to $62.31 per barrel, while the August Brent crude futures also rose more than 2% to $64.12 per barrel. Two key drivers underlie this rally: OPEC+'s maintenance of a "modest production increase" strategy at its weekend meeting, and Ukraine's surprise attack on a Russian military airfield. The crude oil market is currently in a dual game of "policy and geopolitics": OPEC+ seeks to balance the market with "modest production increases," while Ukraine's raid serves as a reminder that black swans are never far away.
Short-term Outlook:
US oil prices may remain range-bound between $60-$64 per barrel.
However, if the Russia-Ukraine conflict deteriorates or internal rifts within OPEC+ deepen, a new round of violent volatility (sharp rallies or crashes) cannot be ruled out.
Technical Analysis:
Early trading saw oil prices consolidate in a narrow range near $61, reflecting a secondary rhythm.
The MACD indicator is bearishly diverging below the zero axis with strong bearish momentum, suggesting a risk of continued downward movement in crude oil prices during the session.
Trading Strategy:
sell@63.5-64.0
TP:61.6-62.0
The bears continue to dominate!Oil prices fluctuated lower this week, primarily pressured by the repeated U.S. tariff policies and expectations of OPEC+ production increases. During Friday's Asian session, Brent crude oil futures fell 0.41% to $63.89 per barrel, while U.S. WTI crude oil futures declined 0.44% to $60.67. The Brent July futures contract is set to expire on Friday. The tariffs imposed by U.S. President Trump were originally suspended, but the U.S. Federal Appellate Court temporarily reinstated them on Thursday, overturning the trade court's suspension ruling made on Wednesday. This legal volatility caused oil prices to plummet by more than 1% on Thursday.
The crude oil market this week has shown high sensitivity, influenced not only by legal rulings but also by dual pressures from geopolitical tensions and internal coordination imbalances within the organization. Under the intertwined effects of tariffs and production expectations, oil prices have struggled to achieve directional breakthroughs. If OPEC+ fails to reach an agreement on production control and demand from Asian countries and other major consumers has not recovered, oil prices are likely to maintain a weak oscillating pattern in the coming weeks. The MACD indicator is opening downward below the zero axis, with strong bearish momentum, suggesting a risk of further downside for crude oil during the day.
Overall, for next week's crude oil trading strategy, He Bosheng recommends focusing on bearish trades on rebounds, complemented by bullish trades on pullbacks.
Humans need to breathe, and perfect trading is like breathing—maintaining flexibility without needing to trade every market swing. The secret to profitable trading lies in implementing simple rules: repeating simple tasks consistently and enforcing them strictly over the long term.
Trading Strategy:
sell@61.5-62,0
TP:59.5-60.0

USOIL:Sharing of the Trading Strategy for Next WeekAll the trading signals this week have resulted in profits!!! Check it!!!👉👉👉
Fundamental Analysis:
Uncertainty over the OPEC+ production increase plan continues to unsettle markets. If the 增产 (production hike) is implemented, increased supply will pressure oil prices.
Meanwhile, uneven global economic recovery has impacted crude oil demand expectations.
Technical Analysis:
Daily candlestick charts show prices oscillating within a $59–$63 range. The MACD indicator remains below the zero line, with bearish signals persisting.
The 50-day moving average forms strong resistance near $63, while $58.9 serves as key support.
Trading Strategy:
Await rebounds to initiate short positions.
Trading Strategy:
Sell@63-62
TP:60-59
Share accurate trading signals daily—transform your life starting now!
👇 👇 👇 Obtain signals👉👉👉
USOIL:First go short, then go long
USOIL: There are still signs of a pullback on an hourly basis after oil prices climbed to near 63 after OPEC+ said there would be no immediate changes to current production policies.
So the trading strategy :SELL@62.5-62.8 TP@61.6-61.3
After stepping back to the point can not break a wave of rebound, the target can look at 63 again
↓↓↓ More detailed strategies and trading will be notified here →→→
↓↓↓ Keep updated, come to "get" →→→

USOIL:Long thinking, target 62.5
USOIL: Same idea, the front 61.3-61.5 has been given to the entry point, it is slowly rising, the upper target is still seen near 62.5.
So strategically, stay long and wait for the rally, TP@62.5
Tip: It is always right to sell when there is a profit, according to individual risk appetite.
↓↓↓ More detailed strategies and trading will be notified here →→→
↓↓↓ Keep updated, come to "get" Or just find me→→→
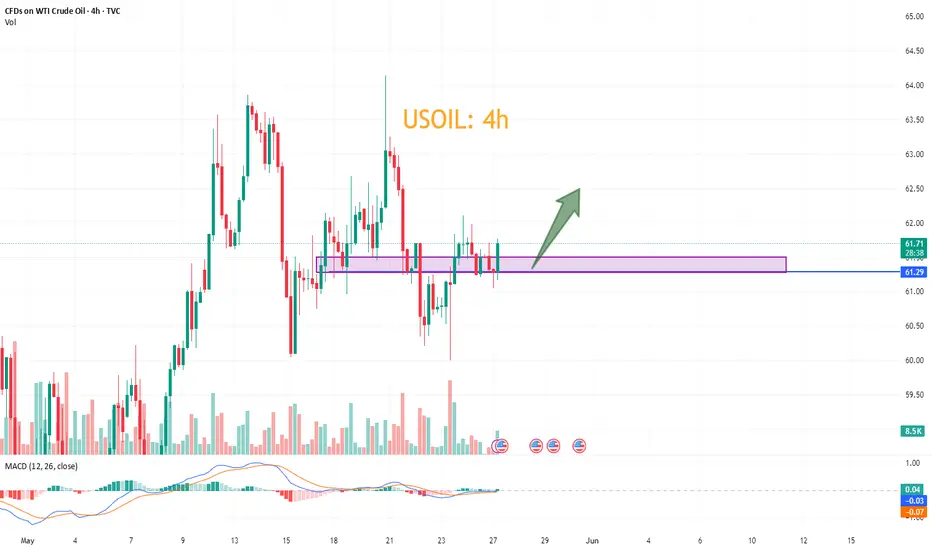
USOIL:Long at 61.3-61.5
Last week's long target has been completed, the current decline is mainly due to concerns that global supply growth may exceed demand growth, from the technical trend, the objective trend of the middle line downward, short term long and short frequently alternate, pay attention to the support point of 60.3-60.5 within the day. Considering that it has been around this point of shock and not broken, short - term trading to do more.
So the trading strategy :BUY@61.3-61.5 TP@62.5-62.7
↓↓↓ More detailed strategies and trading will be notified here →→→
↓↓↓ Keep updated, come to "get" →→→

USOIL:Go long first
Crude oil short-term trend to maintain weak shock upward rhythm, K line closed long lower shadow line, there are signs of rebound. Short - term moving average system gradually long arrangement, relying on oil prices, short - term objective trend direction to upward. It is expected that the intraday trend of crude oil will continue to extend upward, hitting around 62.8-63
Recommended Trading Strategies:
61-61.2 range to be long, short-term target to see 62, break through the target to see 62.8-63
↓↓↓ The detailed strategy club will have tips, updated daily, come and get them →→→
