Forecast of the market trend at the opening on Monday”Oil prices remained under pressure this week, experiencing a notable decline due to multiple factors. As of Friday's Asian morning session, Brent crude futures fell 37 cents to $64.07 per barrel, while U.S. WTI crude futures dropped 39 cents to $60.81 per barrel. Brent crude fell 2% for the week, while WTI declined 2.7%.
Key Drivers of Oil Price Weakness
Stronger U.S. Dollar
The U.S. House of Representatives passed President Donald Trump’s tax-cut and fiscal spending bill, boosting the U.S. dollar index against a basket of currencies.
As oil is dollar-denominated, a stronger dollar typically reduces purchasing power for non-USD buyers, suppressing oil prices.
Supply-Demand Sensitivity and Market Sentiment
The combination of dollar strength and expectations of OPEC+ production increases has intensified bearish sentiment in the oil market.
While demand is gradually recovering, significant upward pressure on supply—including potential output hikes from OPEC+ and rising U.S. shale production—has created near-term volatility.
Technical Outlook and Trading Strategy
Short-Term Trend: Oil prices are likely to remain in a sideways-to-downward oscillation due to supply-demand imbalances.
Key Levels:
Resistance: $63.0–$63.5 per barrel (short-term overhead resistance).
Support: $60.5–$60.0 per barrel (critical near-term support zone).
Trading Approach:
Consider rebound shorting as the primary strategy, with retracement buying as a secondary approach.
Use rallies toward $63.0–$63.5 to initiate short positions, targeting support at $60.5–$60.0, with stop-losses above $64.0.
Note: Monitor OPEC+ policy updates and U.S. inventory data for potential shifts in market sentiment. Volatility may rise ahead of key economic indicators.
Usoilanalysis
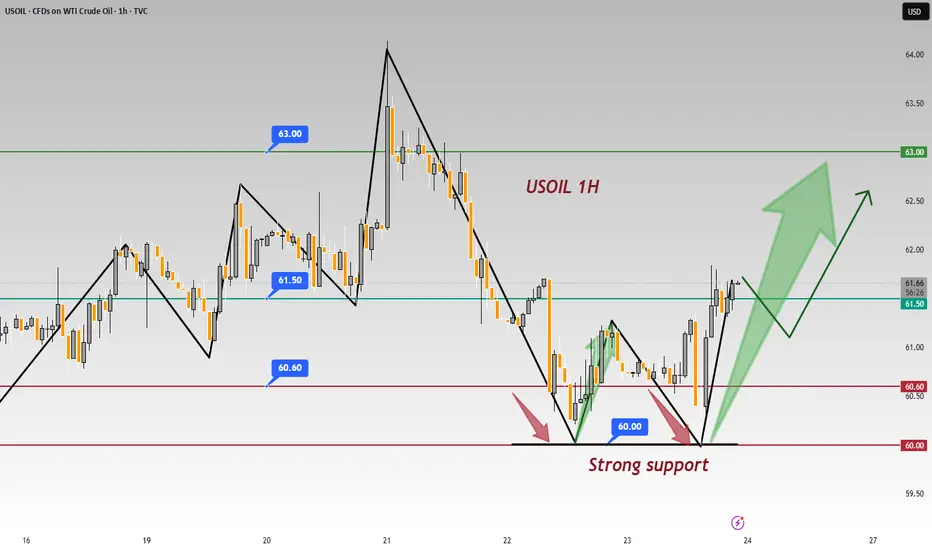
In - depth: USOIL 1 - hr Chart - Significance of 60.00 Support In the USOIL 1 - hour chart, 60.00 acts as a strong support 💪.
Support Validation
The price twice failed to break 60.00 and rebounded 📈. Psychologically, investors see 60.00 as a key level 🔑. Approaching it, buy orders pour in as they think crude oil is undervalued 📉. Technically, it's on a support line from prior lows, and repeated tests have fortified its support 🛡️.
⚡️⚡️⚡️ USOil ⚡️⚡️⚡️
🚀 Buy@ 60.00 - 60.60
🚀 TP 62.50 - 62.80
Accurate signals are updated every day 📈 If you encounter any problems during trading, these signals can serve as your reliable guide 🧭 Feel free to refer to them! I sincerely hope they'll be of great help to you 🌟 👇
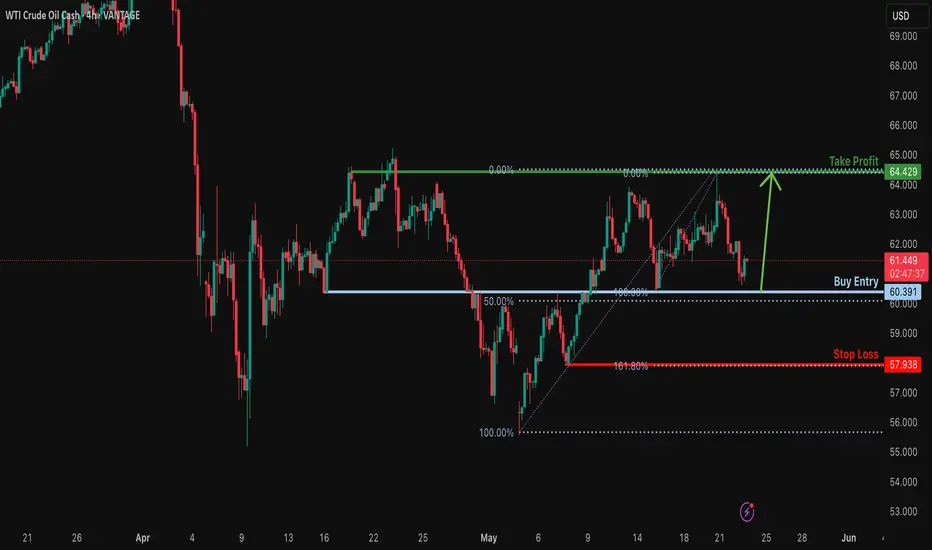
Bullish bounce?USO/USD is falling towards the support level which is an overlap support that lines up with the 50% Fibonacci retracement and could bounce from this level to our take profit.
Entry: 60.39
Why we like it:
There is an overlap support level that lines up with the 50% Fibonacci retracement.
Stop loss: 57.93
Why we like it:
There is a pullback support level that aligns with the 161.8% Fibonacci extension.
Take profit: 64.42
Why we like it:
There is a pullback resistance level.
Enjoying your TradingView experience? Review us!
Please be advised that the information presented on TradingView is provided to Vantage (‘Vantage Global Limited’, ‘we’) by a third-party provider (‘Everest Fortune Group’). Please be reminded that you are solely responsible for the trading decisions on your account. There is a very high degree of risk involved in trading. Any information and/or content is intended entirely for research, educational and informational purposes only and does not constitute investment or consultation advice or investment strategy. The information is not tailored to the investment needs of any specific person and therefore does not involve a consideration of any of the investment objectives, financial situation or needs of any viewer that may receive it. Kindly also note that past performance is not a reliable indicator of future results. Actual results may differ materially from those anticipated in forward-looking or past performance statements. We assume no liability as to the accuracy or completeness of any of the information and/or content provided herein and the Company cannot be held responsible for any omission, mistake nor for any loss or damage including without limitation to any loss of profit which may arise from reliance on any information supplied by Everest Fortune Group.
Latest Strategic Positioning for Crude OilDuring the US trading session, crude oil prices declined for the second consecutive trading day after rebounding from intraday lows and encountering resistance. The commodity traded at $60.42 per barrel, representing a 1.87% daily loss.
Per the Commitments of Traders (COT) report released last Friday, there exists a moderate divergence in sentiment between managed funds and asset management firms regarding WTI crude oil futures. While both investor categories maintain net long positions, over the prior two weeks, managed funds reduced their net long exposure by approximately 20,000 contracts, whereas large speculators increased their net long positions by 10,000 contracts.
Technically, crude oil exhibited a "rally-and-reversal" pattern today, retreating under selling pressure near the $61.7 resistance zone before stabilizing and rebounding around $60.0. Current price action indicates a range-bound oscillation, with bullish stabilization probabilities contingent on the $60.0 support level holding firm.
In summary, crude oil remains trapped in a narrow consolidation phase, with overhead resistance levels retaining dominance. For today's trading strategy, a "rebound shorting-first" approach is recommended, complemented by tactical long positions on dips. Key resistance lies between $61.7-$62.5, while support zones are identified at $60.0-$59.0.
In the market, there are no absolutes, and neither upward nor downward trends are set in stone. Therefore, the ability to judge the balance between market gains and losses is your key to success. Let money become our loyal servant.
Will crude oil prices continue to rise?On Wednesday, international crude oil prices surged to nearly a one-month high amid market concerns over supply disruptions in the Middle East. News that Israel may strike Iranian nuclear facilities has ignited a risk premium for crude oil, while stalled progress in U.S.-Iran nuclear negotiations has also tightened supply expectations. The latest data from the Fujairah Oil Industrial Zone in the UAE showed that as of the week ending May 19, total refined product inventories at the Port of Fujairah stood at 20.562 million barrels, a 4.9% decline from the previous week. Light distillate inventories fell by 357,000 barrels to 8.277 million barrels, medium distillate inventories dropped by 467,000 barrels to 1.295 million barrels, and heavy residual fuel oil inventories rose by 1.651 million barrels to 10.99 million barrels.
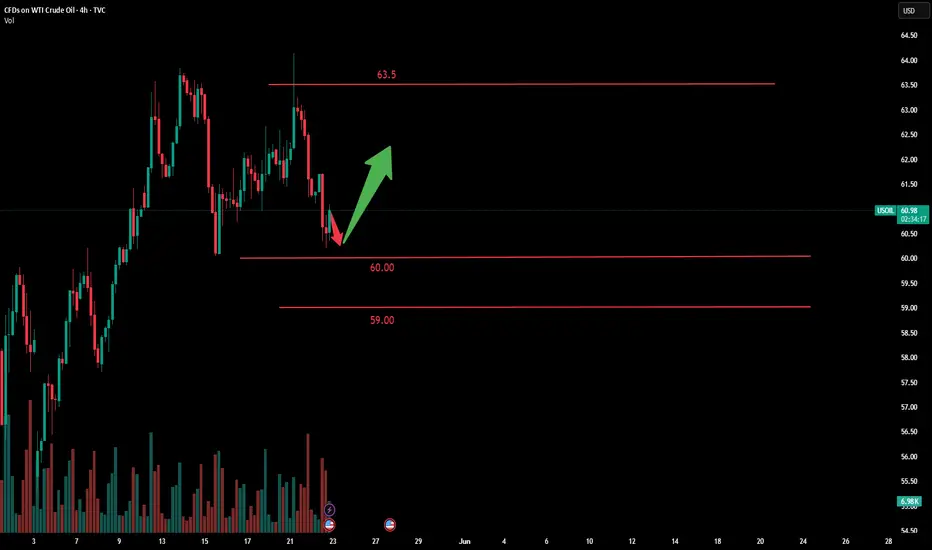
Crude oil experienced a pullback today, with prices oscillating lower after the opening, showing minor fluctuations. Notably, prices gradually broke to new lows, suggesting a high probability of a rapid decline. Overall, crude oil has been in a stalemate between rally and correction recently, showing a pattern of daytime declines and night-time gains, but this may shift today. In trading, consider going long on rebounds as the primary strategy and shorting at highs as a secondary approach. Monitor resistance at the $63.0-$64.0 per barrel level and support at the $61.0-$60.0 per barrel level.
Trading Strategy:
buy@60.0-61.0
TP:63.0-64.0
In the market, there are no absolutes, and neither upward nor downward trends are set in stone. Therefore, the ability to judge the balance between market gains and losses is your key to success. Let money become our loyal servant.
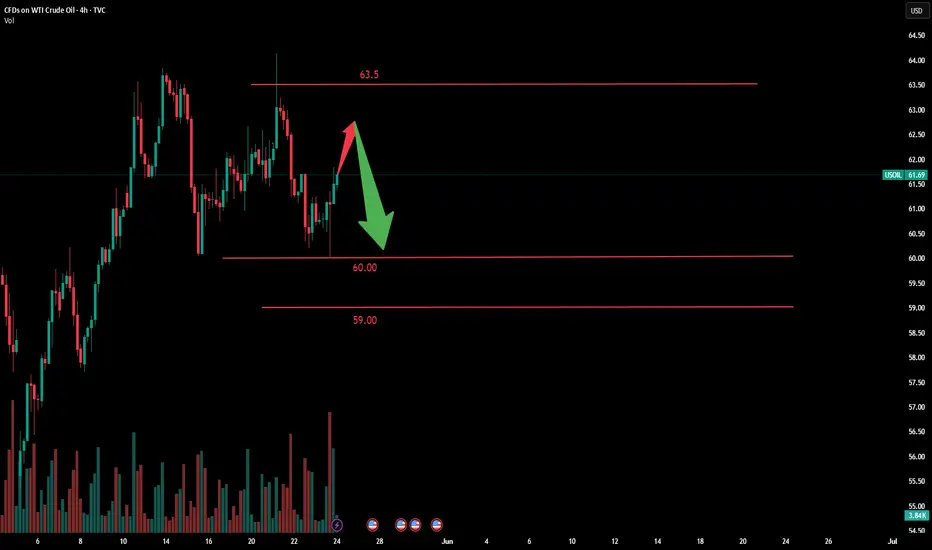
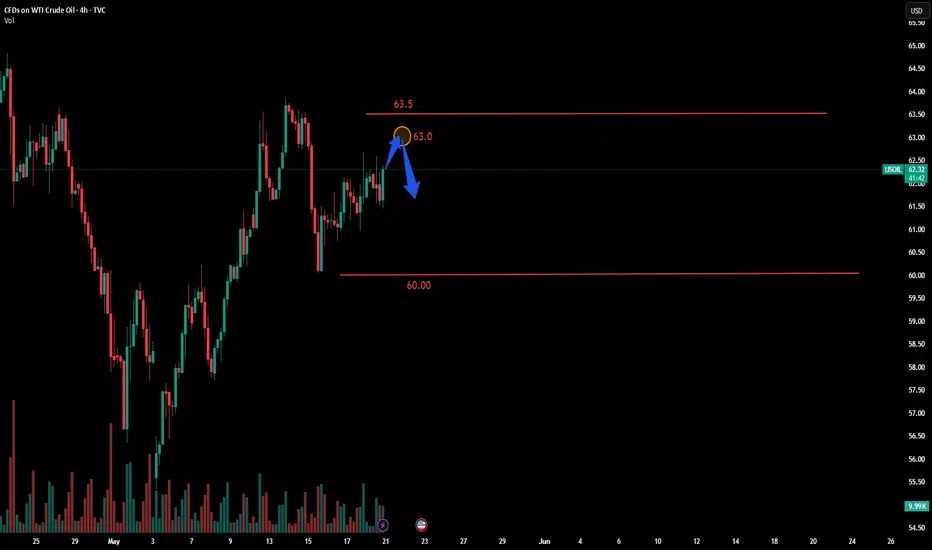
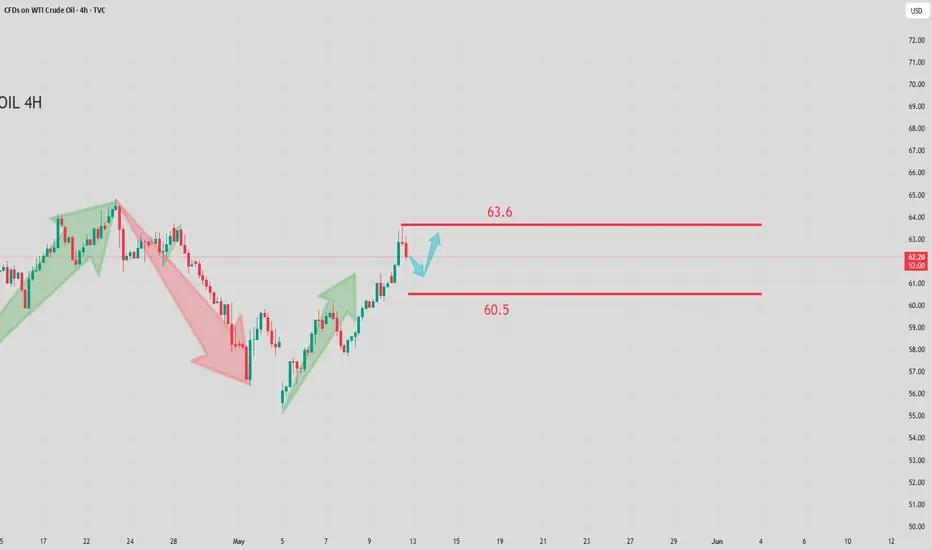
Crude Oil (WTI/USD) Short SetupInternational oil prices have been supported by the temporary easing of trade tensions and buying sentiment attracted by a double bottom. However, the upside for oil prices remains limited, mainly due to the impact of Trump's uncertain tariff policies on the economy and the OPEC+ strategy of maintaining production increases. In the forward view, attention should be paid to the progress of the Iran Nuclear Agreement and Russia-Ukraine negotiations. If the agreements are reached, pressure on the oil supply side will continue to increase. During the summer oil consumption peak season, the incremental oil demand in major consuming countries may be affected by factors such as the bleak prospects of economic recovery and the substitution of new energy, keeping oil prices under pressure. On the daily chart, crude oil closed with a small bullish candle, with the high price breaking above the previous high and the low price not breaking below the previous low, forming an breakout pattern. Crude oil has shown upward momentum after consecutive oscillations, and key attention should be paid to whether the resistance level at 63.6 is broken.
Trading Strategy:
sell@62.5-63.0
TP:61.0-61.5
In the market, there are no absolutes, and neither upward nor downward trends are set in stone. Therefore, the ability to judge the balance between market gains and losses is your key to success. Let money become our loyal servant.
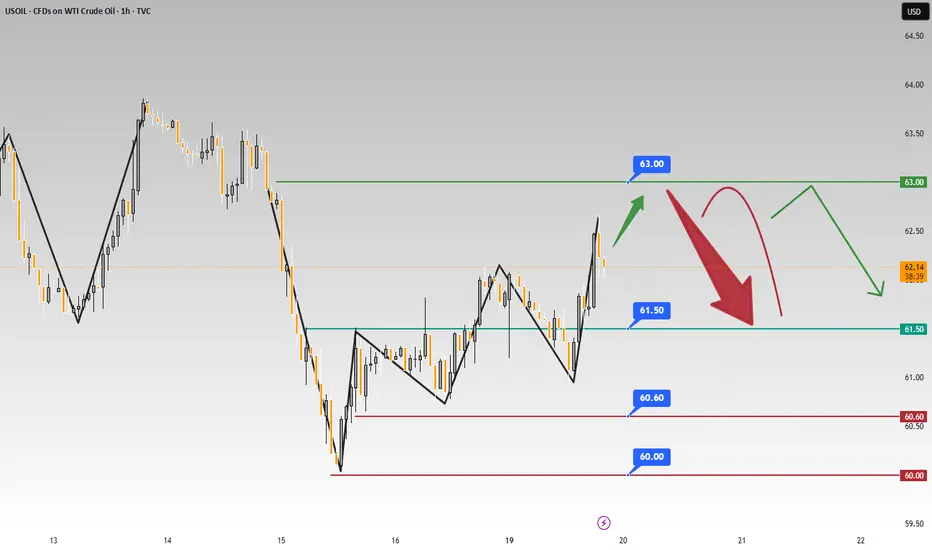
Crude oil: 63.00 resistance & 60.00 support keyPrices are currently testing the upper resistance at $63.00 📈. These levels are suppressing the price 🔻. A decisive breakthrough above this level may trigger a more intense upward rally 🔥. Meanwhile, recent selling pressure has pushed the price down to $60.60 📉. Watch the pivot support at $60.00, the real downward target 🎯
Crude oil surplus expanded in April, and imports increased, reaching multi - month highs from some countries 🌍. If global benchmark oil prices rise in the future, purchases may be reduced 📉.
Crude oil fell first and then rose today 📊. After a deep dive to $60.9, it stabilized and started to rise 🔼. After the previous price increase and adjustment, it remains to be seen if the upward momentum will continue and break through upwards 🔍.
Overall, on the delivery day, oil prices are volatile 🔼🔽. Watch the resistance at $63.0 on the upside and the support at $60.60 - $60.0 on the downside 👀.
⚡️⚡️⚡️ USOil ⚡️⚡️⚡️
🚀 Sell@ 62.50 - 62.30
🚀 TP 61.50 - 60.60
Accurate signals are updated every day 📈 If you encounter any problems during trading, these signals can serve as your reliable guide 🧭 Feel free to refer to them! I sincerely hope they'll be of great help to you 🌟 👇
The main strategy is to go long on pullbacksDuring the Asian trading session on Monday, Brent crude fell slightly by $0.05 to $65.15 per barrel; WTI crude was quoted at $61.76, while the more actively traded July contract dropped $0.04 to $61.93. Both benchmark oil prices recorded weekly gains of over 1% last week, mainly boosted by the easing of global trade sentiment. The market will closely monitor data to be released soon by a major Asian economy, including April industrial added value, fixed asset investment, and retail sales. ANZ Bank noted in a report that weak data from the major Asian economy could undermine the optimism brought by the tariff suspension, thereby pressing down oil prices.👉👉👉
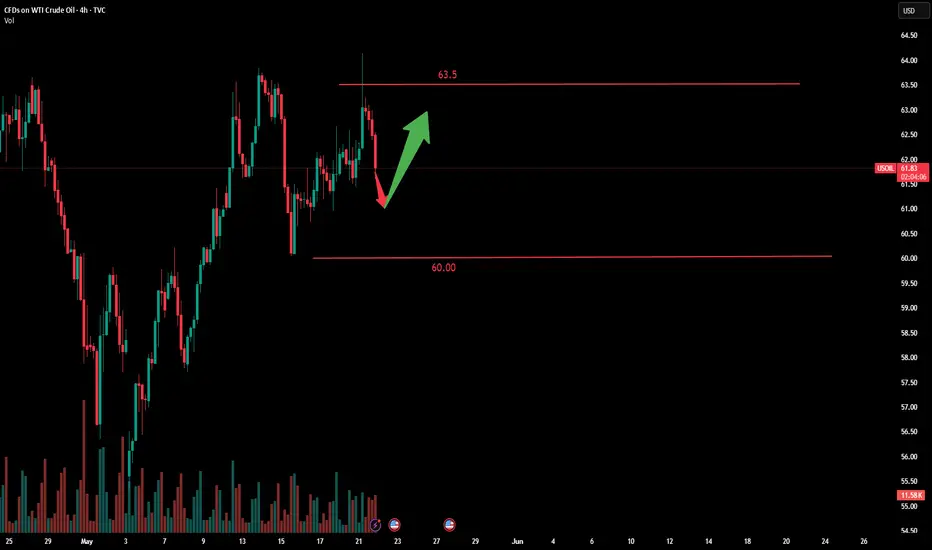
The K-line closed as a yang line with a long lower shadow, indicating strong bullish momentum from buyers. The moving average system is gradually arranging in a bullish formation, relying on the oil price, and the short-term objective trend direction has turned upward. It is expected that the intraday crude oil trend will continue to rise, reaching near 63. Overall, in terms of crude oil trading strategies, it is recommended to focus on buying low on pullbacks and supplement with selling high on rebounds. In the short term, pay attention to the resistance at the 63.0-63.5 level above, and the support at the 61.0-60.5 level below.
Oil trading strategy:
buy @ 61.00-61.50
sl 60.00
tp 62.30-62.80
If you think the analysis helpful, you can give a thumbs-up to show your support. If you have different opinions, you can leave your thoughts in the comments. Thank you for reading!👉👉👉

USOIL Temporary Drop seems inevitableOn Thursday, WTI crude oil futures prices fell approximately 3.5% during the session, extending losses after failing to test technical resistance levels. The decline was jointly driven by heightened expectations of a U.S.-Iran nuclear agreement and unexpected increases in crude oil inventories, both of which exerted heavy pressure on supply outlooks. Nevertheless, market analysis suggests the downside for the U.S. dollar may be limited. Improved global trade sentiment has reduced recession fears, leading markets to scale back expectations for aggressive Federal Reserve rate cuts. Data shows the probability of a 25-basis-point rate cut by the Fed in September is now 74%, down from earlier predictions of a July cut.
Crude oil continued to decline today, breaking the previous upward pattern, with a high probability that prices will trade in a broad range going forward. Overall, the magnitude of the decline has increased, suggesting a higher likelihood of further downside. Today's trading strategy considers shorting on rebounds as the primary approach, while waiting for long opportunities at lower levels. Resistance is focused on the $62.0–63.0 area, with support at $60.0–59.0.
you are currently struggling with losses, or are unsure which of the numerous trading strategies to follow, at this moment, you can choose to observe the operations within our channel.
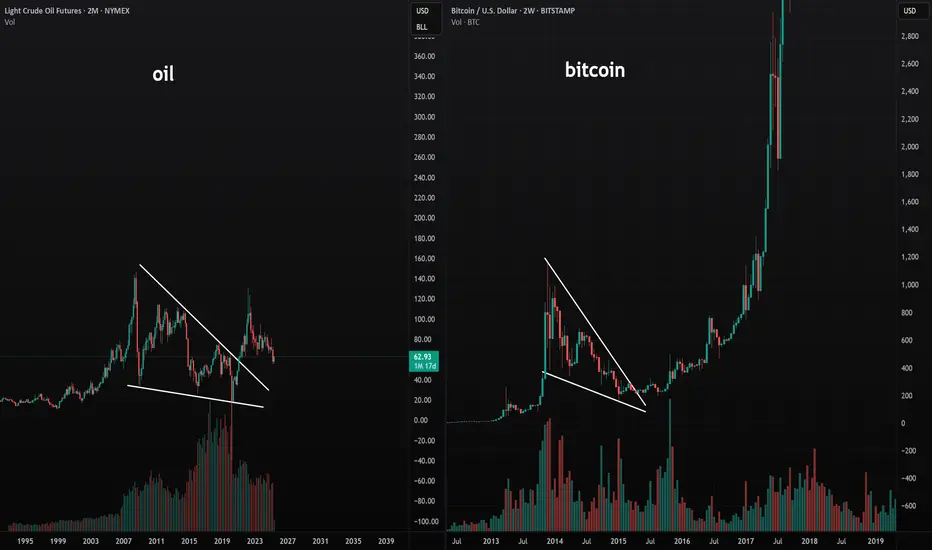
Crude oil is extremely bullish.I see a very similar market structure in crude oil’s big picture as in the early days of Bitcoin. People will say, “But what about electric cars?”—yet few realize that over 6,000 products are made with oil. Not to mention, long-term oil use isn't going anywhere, even with the rise of electric vehicles.
I believe oil is actually very undervalued and has been repressed for many years. It can't be held down forever—a big upward move is pretty much inevitable.
As always, stay profitable.
- Dalin Anderson
USOIL UPDATEweek hit its largest since the week of March 7, 2025. The EIA crude oil inventory for the week stood at 3.454 million barrels, contrasting with the expected -1.078 million barrels and the previous figure of -2.032 million barrels.
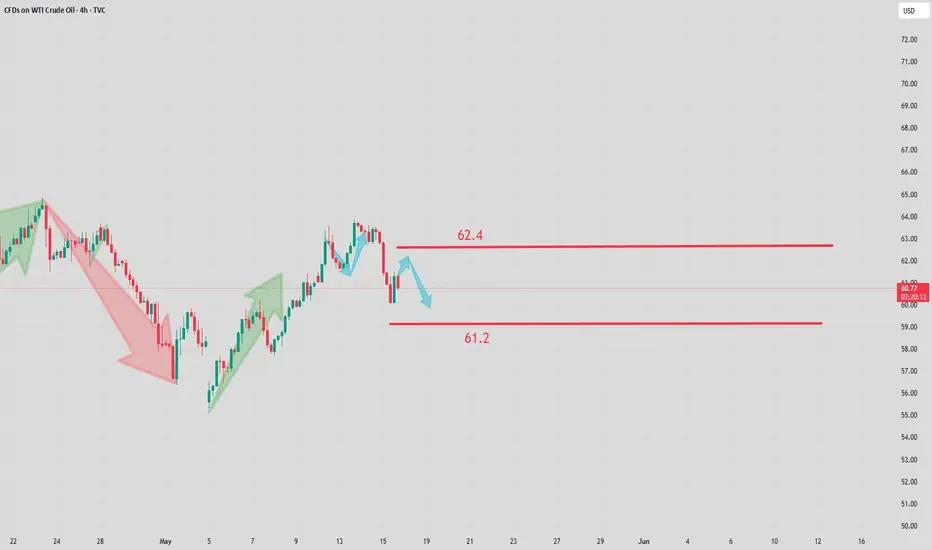
On Wednesday, crude oil exhibited a high-range oscillatory pattern: it stabilized and rebounded near $62.7, then pulled back after reaching $63.6, maintaining volatility within a narrow upper range. Influenced by the large bullish candlestick on the daily chart, oil prices still carry an upward probability.
Overall, crude oil remains in a bullish consolidation phase. For trading strategies, a "buy low, sell high" approach is recommended, with resistance levels to watch at $63.6–64.5 and support levels at $62.7–61.2.
you are currently struggling with losses, or are unsure which of the numerous trading strategies to follow, at this moment, you can choose to observe the operations within our channel.

USOIL UPDATEHello friends
Given the recent growth in oil prices, it is natural for the price to correct. Now we have obtained the most important price support areas for you and we have also specified the target. If you are willing to enter the transaction, be sure to observe capital management.
*Trade safely with us*
WTI Crude Oil (USOIL) Bullish Pullback Setup – Targeting $66.70 Entry Point: Around $62.30 - $62.26
Stop Loss: Set below the entry zone at $61.65, with a potential lower buffer at $60.90
Target Zone (EA TARGET POINT): Between $66.62 and $67.00
A projected gain of 4.22 points (~6.77%)
📈 Price Action & Indicators:
The price had a strong bullish run recently and is now consolidating or pulling back slightly.
The red and blue moving averages (likely short-term and medium-term MAs) show a bullish crossover and trend.
There's a potential bullish setup if the price pulls back to the entry zone and finds support.
The blue curved arrow indicates a projected bounce from the $62.30 support region back up toward the $66.70 target.
🛠️ Strategy Implied:
Wait for pullback to the entry zone (~$62.30).
Enter long at or around that level.
Set Stop Loss at $61.65 to limit downside risk.
Take Profit at $66.70 for a solid risk-reward ratio.
⚠️ Risks:
If support at $62.30 fails, price may head toward $61.65 or lower.
Market volatility (especially with crude oil) can invalidate setups quickly.
Economic events (e.g., U.S. inventory reports, OPEC news) can disrupt technical patterns.

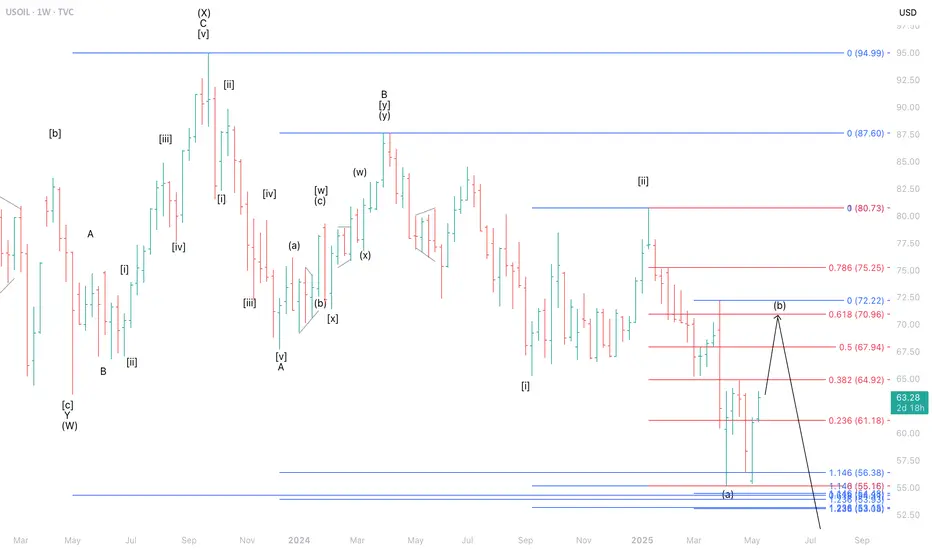
Potential Upside in USOIL Amid Ongoing Wave StructureThere remains a potential for USOIL to strengthen on the weekly timeframe, where it is currently expected to be forming wave (b) of wave within a diagonal pattern. This suggests that the upside area to watch lies in the range of 64.92–70.96.
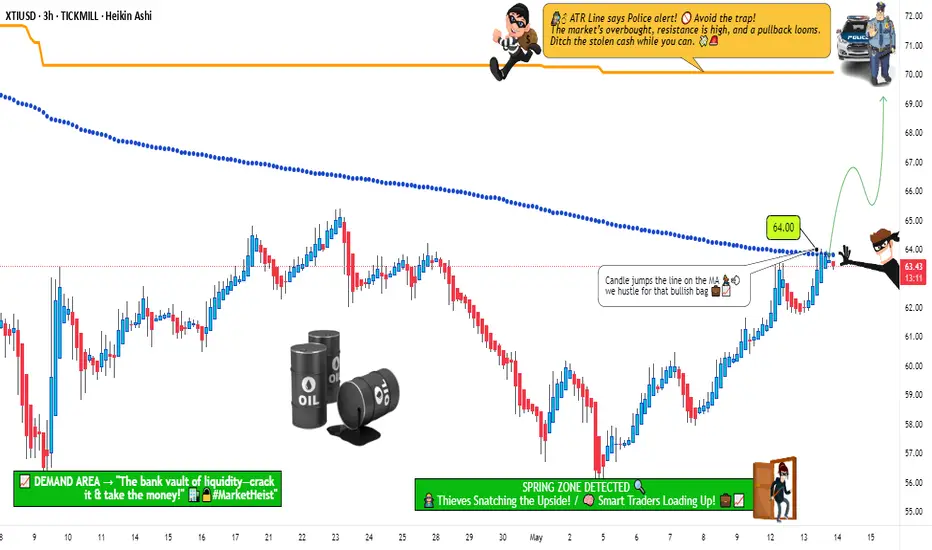
XTIUSD Crude oil Raid Plan: Snag Profits Before the ATR Trap!🌍 Greetings, Wealth Warriors! Salut! Ciao! Salaam! 🌟
Fellow Profit Pirates, 🤑💰🚀
Crafted with 🔥Bandit Blueprint analysis🔥 (technical + fundamental), here’s our cunning scheme to raid the "XTIUSD / WTI Oil" Energy Market. Follow the charted course for a long entry, aiming to slip away near the high-stakes ATR Zone. Watch out—overbought signals, consolidation, or a trend flip could trap the unwary where bearish bandits lurk! 🏴☠️💸 "Cash out and celebrate, traders—you’ve earned it! 🎉💪"
**Entry 📈**: "The vault’s open! Await the MA breakout (64.00), then strike—bullish riches await!"
Pro tip: Set buy stop orders above the Moving Average or place buy limit orders at the latest 15/30-min swing low/high for pullback entries.
📢 Set a chart "alert" to catch the breakout moment!
**Stop Loss 🛑**: "📣 Heads up, crew! 🗣️ For buy stop orders, hold off on placing that stop loss until the breakout sparks 🚀. Stick to my marked spot 📍 or go rogue at your own peril 😎—it’s your gamble! ⚠️"
📍 Bandit SL set at the recent 3H swing low (60.00) for swing trades.
📍 Adjust SL based on your risk, lot size, and number of orders.
**Target 🎯**: 70.000 or bail out before the finish line.
🧲 **Scalpers, listen up** 👀: Stick to long-side scalps. Big bankrolls can dive in; smaller stacks, join the swing trade heist. Use trailing SL to shield your loot 💰.
💸 **US Oil Spot / WTI** Swing Trade Plan: Bullish vibes 🐂 are surging, fueled by key drivers. ☝
📰 **Dive Deeper**: Check Fundamentals, Macro Trends, COT Reports, Seasonal Patterns, Intermarket Insights, Inventory Data, and Future Targets 👉🔗
⚠️ **Trading Alert: News & Position Tips** 🗞️ 🚨
News drops can shake prices and volatility. To protect your haul:
- Skip new trades during news events.
- Use trailing stops to lock in gains.
💖 **Fuel our heist!** 💥Tap the Boost Button💥 to power up our profit raid. Join the Bandit Trading Crew, snatching wins daily with ease! 🏆🤝🎉
Stay sharp for the next caper—see you soon! 🤑🐱👤🚀
---
Real-Time Data (UTC+1, May 14, 2025) 📊
**WTI Oil (XTIUSD)**:
- **Price**: ~$63.80 (based on latest market data)
- **MA Breakout Level**: ~$64.00 (as per strategy)
- **Stop Loss Level**: ~$60.00 (3H swing low)
- **Target**: $70.00
- **Market Sentiment**: Bullish 🐂, driven by inventory draws and geopolitical factors (per recent analysis).
**Latest COT Data (Friday, May 9, 2025)**:
- **Commercial Hedgers**: Increased net long positions in WTI futures, signaling bullish bias.
- **Large Speculators**: Moderately net long, cautious due to overbought risks.
- **Data Source**: CFTC (official Commitment of Traders report).
**Key Fundamental Drivers**:
- **Inventory**: EIA reported a -2.5M barrel draw last week, supporting bullish momentum.
- **Geopolitical**: Middle East tensions continue to prop up oil prices.
- **Seasonal**: Summer demand expectations rising.
🔔 **Note**: Monitor upcoming EIA inventory data (Wednesday, May 14, 2025) for volatility.
---
💥 Boost this plan and let’s plunder the markets together! 🚀
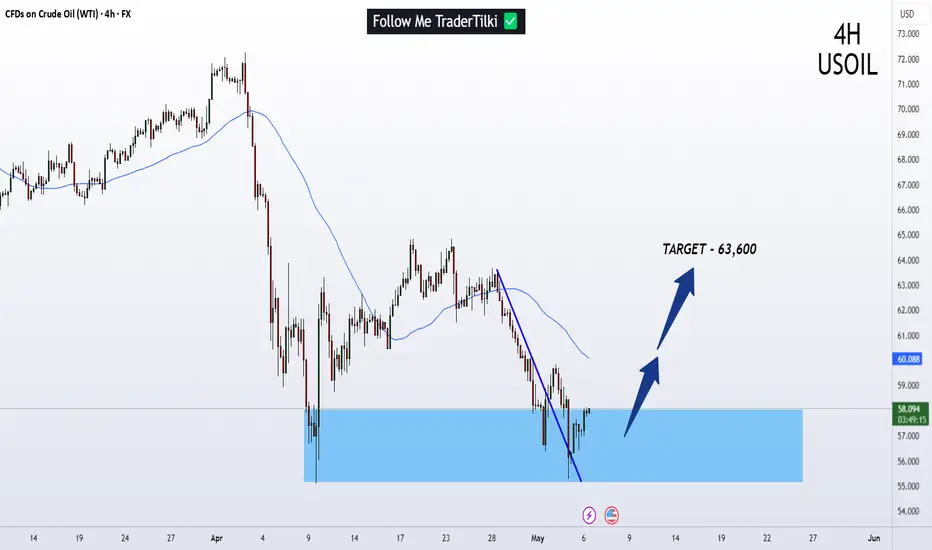
USOIL | 4H | SWING TRADING Good morning, dear friends
Due to high demand, I’ve prepared a USOIL analysis for you. My target level is set at 63.600.
Once my target is reached, I’ll be sharing updates under this post.
Dear friends, your likes are always my biggest motivation to keep sharing analyses. That’s why I kindly ask each of my followers to show their support—please don’t hold back on the likes.
I sincerely thank everyone who supports me with their likes. It truly means a lot
Oil Price Reversal? Why I’m Bullish on WTI Right Now! 🛢️ WTI crude oil is showing renewed bullish momentum. This move is backed by a shift in sentiment following the recent U.S.–China tariff truce and positive trade headlines. While OPEC+ supply increases and elevated inventories remain headwinds, surprise U.S. crude draws and strong jet fuel demand are tightening the market. I’m watching the current retrace. As always, keep risk tight—oil can turn fast! 🚀🛢️📈

Crude oil trend todayInternational oil prices continued last week's upward trend. Brent crude oil futures rose 27 cents to $66.06 per barrel; WTI crude oil futures rose 28 cents to $63.5 per barrel. OPEC+ plans to accelerate the pace of production increase from May to June to meet market demand. However, according to market surveys, the production of the organization in April instead saw a slight decline. The expected production increase has, to a certain extent, curbed the room for oil prices to rise. The United States and Iran concluded nuclear negotiations in Oman and plan to continue consultations. If an agreement is reached, the return of Iranian crude oil supply will increase global supply pressure, which may push down oil prices. In addition, data shows that the number of active oil and gas drilling rigs in the United States last week dropped to the lowest level since January this year, reflecting that U.S. energy companies remain cautious about the future market. Crude oil showed a volatile upward trend, and the oil price broke through the previous high, reaching the expected price. The oil price has formed a three-wave structure. If the subsequent adjustment does not break through the channel, there is a high probability of a continuation of the bullish trend.
The increase in crude oil has approached the previous wide-range oscillation pressure level. Whether it can break through still requires some tug-of-war. In terms of operation, it is considered to lay out long positions on the pullback as the main strategy, with short selling at highs as a supplementary strategy. Pay attention to the resistance at the range of $63.5-64.5 per barrel, and the support at the range of $62.2-61.1 per barrel.
you are currently struggling with losses, or are unsure which of the numerous trading strategies to follow, at this moment, you can choose to observe the operations within our channel.
US-Oil will further push upside After Testing TrendlineAt present, the price of crude oil is above the key technical level, and the geopolitical sentiment has also become more favorable, so the short-term outlook for crude oil is bullish. If the upcoming Sino-US meeting leads to a relaxation of trade tensions, the upward momentum is likely to accelerate. Unless OPEC+ unexpectedly increases the supply, the target for the next few trading days may be set at $63 and higher. Crude oil opened lower this week and then rebounded. The weekly candlestick closed as a large positive candlestick, approaching the resistance of the 5-week moving average. On the daily chart, after the second pullback, the price rebounded upwards without breaking the low point. $64.80 is a key watershed. Below this level, there is still a possibility of a bearish trend. In the short term, the trend is bullish. Overall, it is expected to rise first and then fall next week. Pay attention to the resistance at $63.50 and go short, and set the stop-loss with the position of $64.80 for a bearish outlook.
you are currently struggling with losses, or are unsure which of the numerous trading strategies to follow, at this moment, you can choose to observe the operations within our channel.
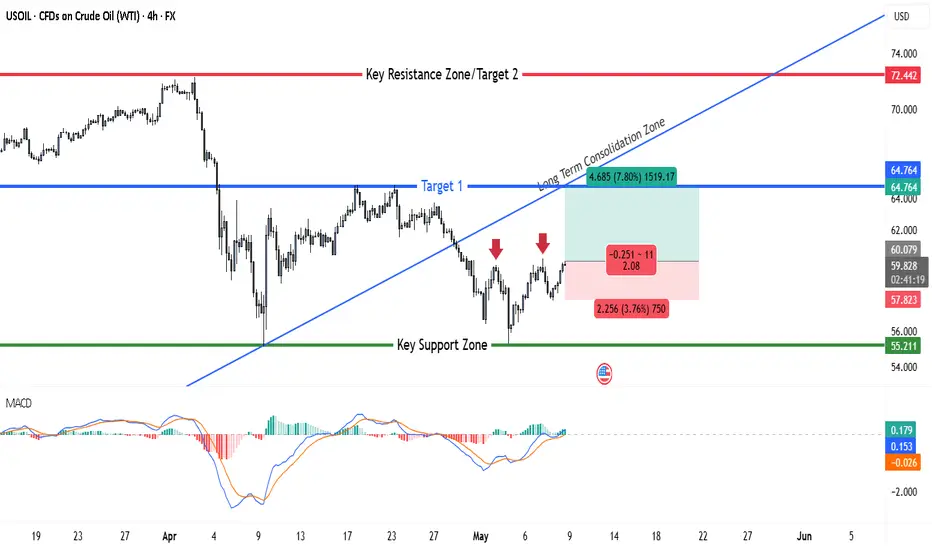
USOIL Bulls Eye Breakout – Can Momentum Carry It to $64The 4-hour chart of USOIL shows a market that has recently experienced a sharp decline, followed by a consolidation phase near a key support level. This key support zone is clearly defined at 55.21 USD, where the price found strong buying interest and bounced back up. From there, the market started to climb, attempting to form a potential short-term bottom.
The price is now approaching a previous trendline, which used to act as support during the uptrend and is now being retested as resistance. This retest area overlaps with horizontal resistance at around 60.00 USD, making it a critical decision zone. The two red arrows in the image mark failed attempts to break higher, indicating sellers are still active at this level.
If the price manages to break through this resistance with strength, the next likely objective is Target 1, set at 64.76 USD. This level coincides with the prior support that was broken during the selloff and could now act as a strong resistance. Beyond that, Target 2 at 72.44 USD marks a major resistance zone from which the last downtrend began.
From a trade setup perspective, the chart suggests a bullish opportunity:
The entry is near 59.98 USD, just above the short-term consolidation area, ideally after a breakout.
The stop loss is placed just below the recent swing low, at around 57.82 USD, providing room for volatility without exposing the trade to unnecessary risk.
The take profit is positioned at 64.76 USD, giving this trade a clear structure with a risk-to-reward ratio of about 1:3.75, which aligns well with strong risk management principles.
Additionally, the MACD indicator at the bottom supports the bullish bias. It shows a recent crossover of the MACD line above the signal line, with a rising histogram—indicating building upward momentum.
In summary, this chart presents a well-structured bullish setup with a favorable risk-to-reward ratio, clear entry and exit levels, and supporting momentum signals. However, the region around the trendline retest remains crucial. A strong close above this zone would confirm the breakout, while another rejection could signal the need for caution or reevaluation.
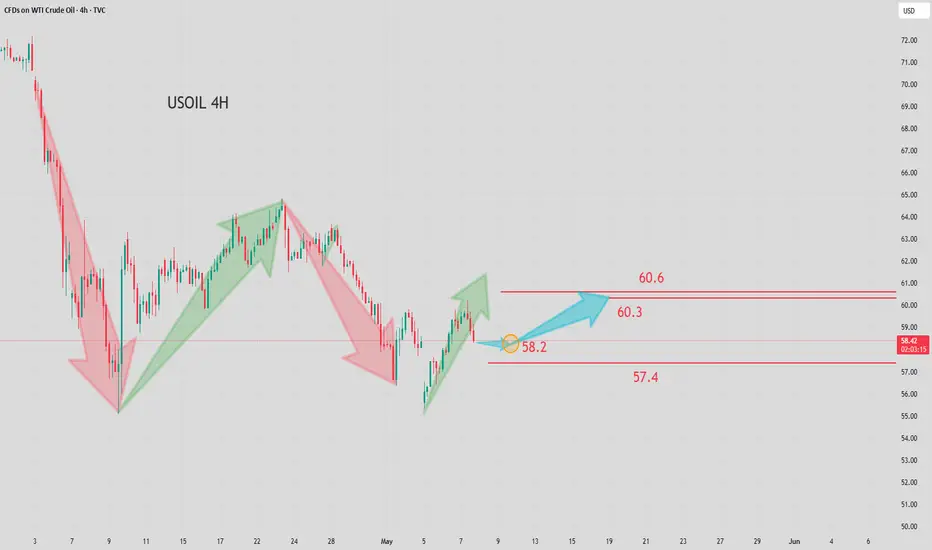
USOIL:Strategic Analysis on ThursdayThe Ministry of Energy of Kazakhstan stated that the country has no plans to cut oil production in May. The country has continuously exceeded production limits, creating tensions within OPEC+. The Ministry of Energy in Astana said that the largest oil-producing country in Central Asia will have an average daily production of crude oil and condensate of 277,000 tons in May, remaining the same as in April, while the average daily production in March was 260,000 tons. OPEC+ has agreed to significantly increase production for two consecutive months, surprising traders and pushing down oil prices. This move is largely driven by Saudi Arabia, the leader of OPEC, which hopes to punish member states such as Kazakhstan that have continuously exceeded production limits. Crude oil has shown a trend of stabilizing and rebounding at a low level today, stabilizing and rising around $57.7, and showing a volatile upward trend. The key today is whether the upward trend of crude oil can continue to break above the level of $60.6.
you are currently struggling with losses, or are unsure which of the numerous trading strategies to follow, at this moment, you can choose to observe the operations within our channel.
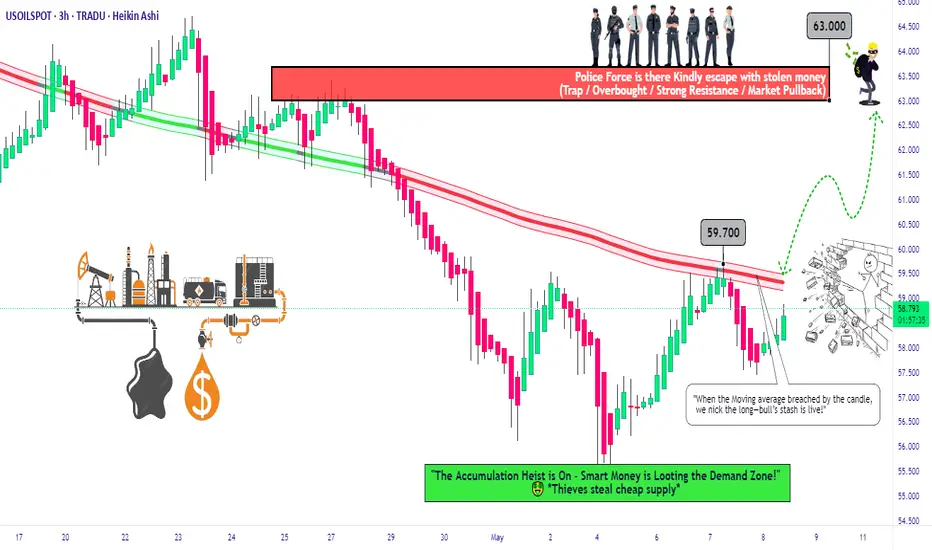
"US Oil Spot/WTI" Energy Market Bullish Heist (Swing Trade Plan)🌟Hi! Hola! Ola! Bonjour! Hallo! Marhaba!🌟
Dear Money Makers & Robbers, 🤑 💰💸✈️
Based on 🔥Thief Trading style technical and fundamental analysis🔥, here is our master plan to heist the "US Oil Spot/WTI" Energy Market. Please adhere to the strategy I've outlined in the chart, which emphasizes long entry. Our aim is to escape near the high-risk Red Zone Level. Risky level, overbought market, consolidation, trend reversal, trap at the level where traders and bearish robbers are stronger. 🏆💸"Take profit and treat yourself, traders. You deserve it!💪🏆🎉
Entry 📈 : "The heist is on! Wait for the MA breakout (59.700) then make your move - Bullish profits await!"
however I advise to Place Buy stop orders above the Moving average (or) Place buy limit orders within a 15 or 30 minute timeframe most recent or swing, low or high level for Pullback entries.
📌I strongly advise you to set an "alert (Alarm)" on your chart so you can see when the breakout entry occurs.
Stop Loss 🛑: "🔊 Yo, listen up! 🗣️ If you're lookin' to get in on a buy stop order, don't even think about settin' that stop loss till after the breakout 🚀. You feel me? Now, if you're smart, you'll place that stop loss where I told you to 📍, but if you're a rebel, you can put it wherever you like 🤪 - just don't say I didn't warn you ⚠️. You're playin' with fire 🔥, and it's your risk, not mine 👊."
📍 Thief SL placed at the recent/swing low level Using the 3H timeframe (57.400) Swing trade basis.
📍 SL is based on your risk of the trade, lot size and how many multiple orders you have to take.
🏴☠️Target 🎯: 63.000 (or) Escape Before the Target.
🧲Scalpers, take note 👀 : only scalp on the Long side. If you have a lot of money, you can go straight away; if not, you can join swing traders and carry out the robbery plan. Use trailing SL to safeguard your money 💰.
💰💵💴💸"US Oil Spot / WTI" Energy Market Heist Plan (Swing Trade) is currently experiencing a bullishness🐂.., driven by several key factors.☝☝☝
⚠️Trading Alert : News Releases and Position Management 📰 🗞️ 🚫🚏
As a reminder, news releases can have a significant impact on market prices and volatility. To minimize potential losses and protect your running positions,
we recommend the following:
Avoid taking new trades during news releases
Use trailing stop-loss orders to protect your running positions and lock in profits
💖Supporting our robbery plan 💥Hit the Boost Button💥 will enable us to effortlessly make and steal money 💰💵. Boost the strength of our robbery team. Every day in this market make money with ease by using the Thief Trading Style.🏆💪🤝❤️🎉🚀
I'll see you soon with another heist plan, so stay tuned 🤑🐱👤🤗🤩
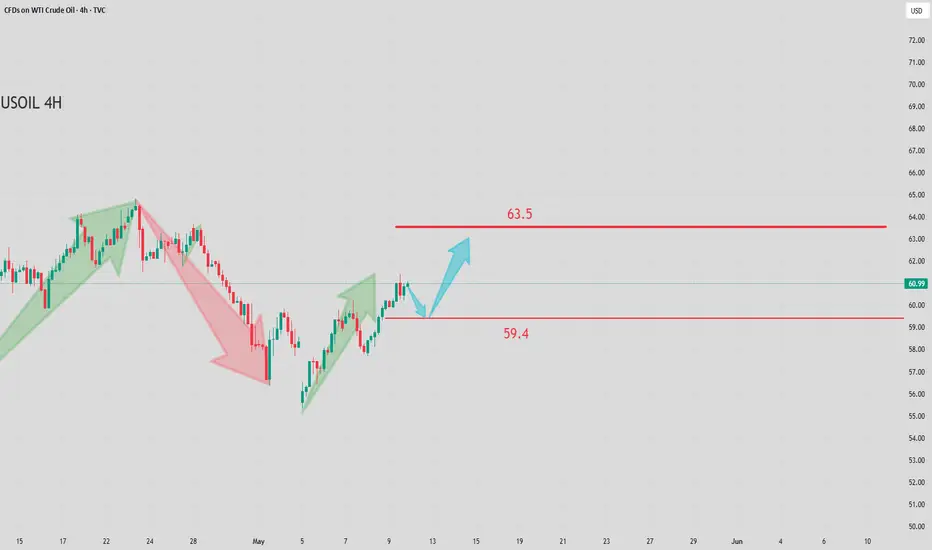
USOIL seems to be in a potential bullish reversalWTI crude oil futures rose slightly. Traders weighed factors such as the optimistic sentiment in Sino - US trade, the decline in US production, and the technical position, while also considering the persistent concerns about supply surplus. The recent decline in oil prices is largely due to the decision of OPEC + to accelerate production increase for the second consecutive month. It is reported that the number of drilling rigs is being reduced, which implies that the future shale oil production may decline, providing support for the bullish view on oil prices. This supply restriction, together with the signs of strong demand from Europe and China, helps to stabilize market sentiment. Crude oil showed a trend of rising first and then falling today. After reaching $60.2, it showed a callback trend. After two consecutive positive days on the daily chart, the oil price adjusted, which may indicate that crude oil will continue to maintain a wide - range oscillation. Overall, the reduction in crude oil inventory is expected to support the rebound of oil prices.
you are currently struggling with losses, or are unsure which of the numerous trading strategies to follow, at this moment, you can choose to observe the operations within our channel.
Trading Strategy:
buy@57.4-58.4
TP:59.4-60.6