USCrudeOil| Inventory Draw Lifts Prices Fed Geopolitics in Focus🛢️ USCRUDE OIL – Overview
Oil edges higher amid U.S. stock draw
WTI crude oil futures rose to $63.45 per barrel on Thursday, extending gains from the previous session after U.S. crude inventories posted a bigger-than-expected draw.
📊 EIA data showed stockpiles fell by 6 million barrels to 420.7 million, compared to expectations for a 1.3 million-barrel draw, providing short-term support for prices.
At the same time, markets are watching closely for progress in the Russia-Ukraine peace talks, brokered by U.S. President Donald Trump. Any breakthrough that results in easing sanctions on Russian crude exports could shift global supply dynamics.
Despite the latest rebound, crude prices remain down over 10% year-to-date, pressured by expectations of oversupply as OPEC+ restores output and tariff concerns weigh on demand outlook.
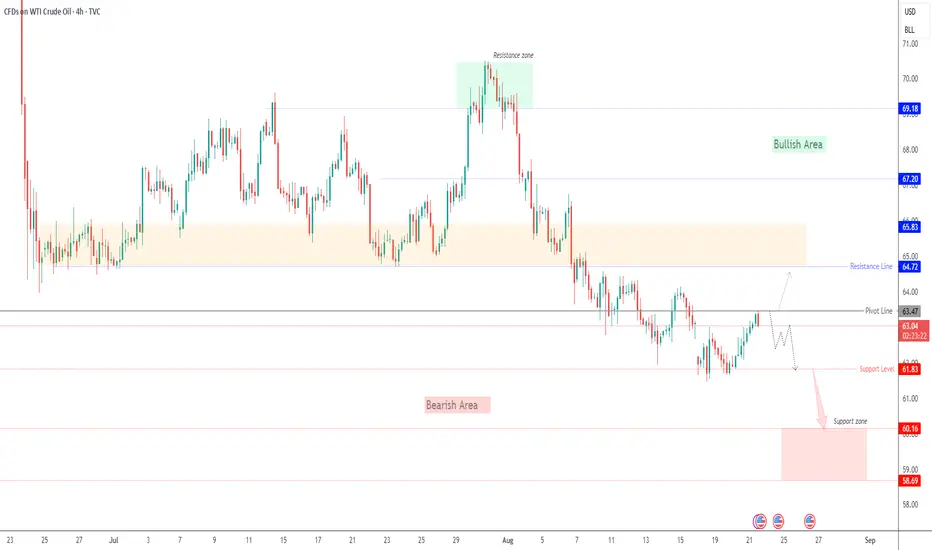
🔎 Technical Outlook
Bearish Scenario:
As long as price trades below the pivot line at 63.47, downside targets are seen at 61.83, and a break lower could extend losses toward 60.16.
Bullish Scenario:
A 4H candle close above 63.47 would open the way toward 64.72, with further upside potential toward 65.80 – 67.20.
📍 Key Levels
Pivot: 63.47
Support: 62.25 – 61.85 – 60.20
Resistance: 64.70 – 65.80 – 67.20
⚠️ Crude remains highly sensitive to geopolitical headlines and inventory data — expect volatility around key supply developments.
Previous idea:
Usoild
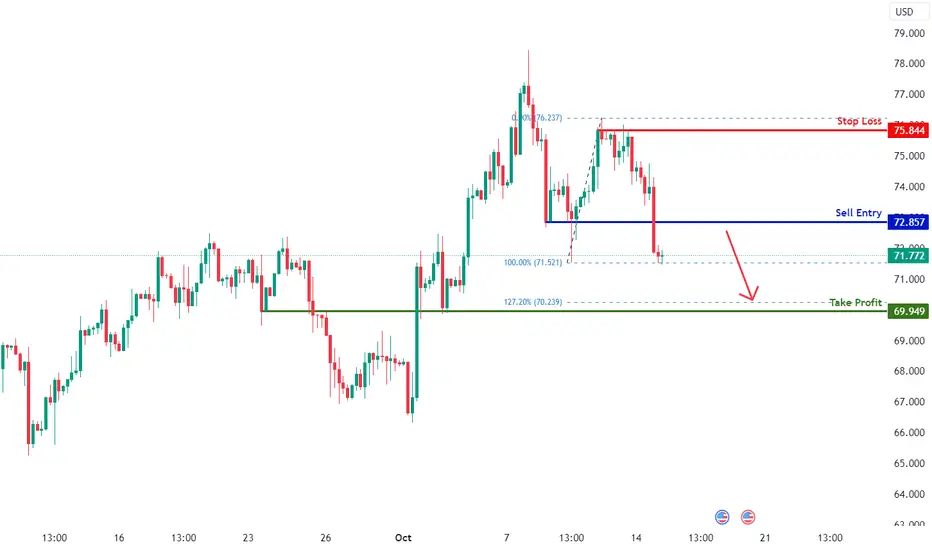
USOIL H4 | Bearish Drop Based on the H4 chart analysis, we can see that the price is rising toward our sell entry at 72.85, which is a pullback resistance.
Our take profit will be at 69.94, an overlap support level close to 127.2& Fibo extension
The stop loss will be at 75.84, a multi-swing high resistance level.
High Risk Investment Warning
Trading Forex/CFDs on margin carries a high level of risk and may not be suitable for all investors. Leverage can work against you.
Stratos Markets Limited (www.fxcm.com):
CFDs are complex instruments and come with a high risk of losing money rapidly due to leverage. 62% of retail investor accounts lose money when trading CFDs with this provider.You should consider whether you understand how CFDs work and whether you can afford to take the high risk of losing your money.
Stratos Europe Ltd, previously FXCM EU Ltd (www.fxcm.com):
CFDs are complex instruments and come with a high risk of losing money rapidly due to leverage. 59% of retail investor accounts lose money when trading CFDs with this provider. You should consider whether you understand how CFDs work and whether you can afford to take the high risk of losing your money.
Stratos Trading Pty. Limited (www.fxcm.com):
Trading FX/CFDs carries significant risks. FXCM AU (AFSL 309763), please read the Financial Services Guide, Product Disclosure Statement, Target Market Determination and Terms of Business at www.fxcm.com
Stratos Global LLC (www.fxcm.com):
Losses can exceed deposits.
Please be advised that the information presented on TradingView is provided to FXCM (‘Company’, ‘we’) by a third-party provider (‘TFA Global Pte Ltd’). Please be reminded that you are solely responsible for the trading decisions on your account. There is a very high degree of risk involved in trading. Any information and/or content is intended entirely for research, educational and informational purposes only and does not constitute investment or consultation advice or investment strategy. The information is not tailored to the investment needs of any specific person and therefore does not involve a consideration of any of the investment objectives, financial situation or needs of any viewer that may receive it. Kindly also note that past performance is not a reliable indicator of future results. Actual results may differ materially from those anticipated in forward-looking or past performance statements. We assume no liability as to the accuracy or completeness of any of the information and/or content provided herein and the Company cannot be held responsible for any omission, mistake nor for any loss or damage including without limitation to any loss of profit which may arise from reliance on any information supplied by TFA Global Pte Ltd.
The speaker(s) is neither an employee, agent nor representative of FXCM and is therefore acting independently. The opinions given are their own, constitute general market commentary, and do not constitute the opinion or advice of FXCM or any form of personal or investment advice. FXCM neither endorses nor guarantees offerings of third party speakers, nor is FXCM responsible for the content, veracity or opinions of third-party speakers, presenters or participants.
USOIL - 4hrs ( Sell Trade After Retest / Tp Range 600 PIP ) 💲Pair Name : USOIL
🗨Time Frame : 4hrs Chart / Close
➕Scale Type : Large Scale
------
🗒 spreading knowledge among us and to clarify the most important points of entry, exit and entry with more than 5 reasons
We seek to spread understanding rather than make money
✔️ Key Technical / Direction ( ↘️ Short After Retest )
Type : Mid Term Swing
———————————
🔰Bearish Retest
70.50
Reasons
- Major Turn level
- Visible Range Hvn
- Head & Shoulder Retest
- Fixed Range poc area
- Quarter's Area
🔰Bullish Reversal
64.50 Area
Reasons
- Major Turn level
- Pattern Target
- Fibo Golden
- 3 Quarter low

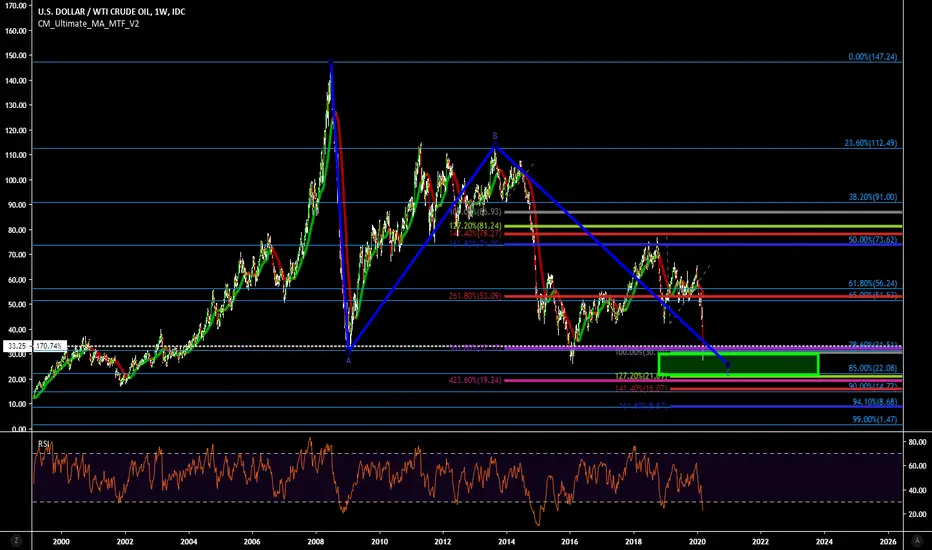
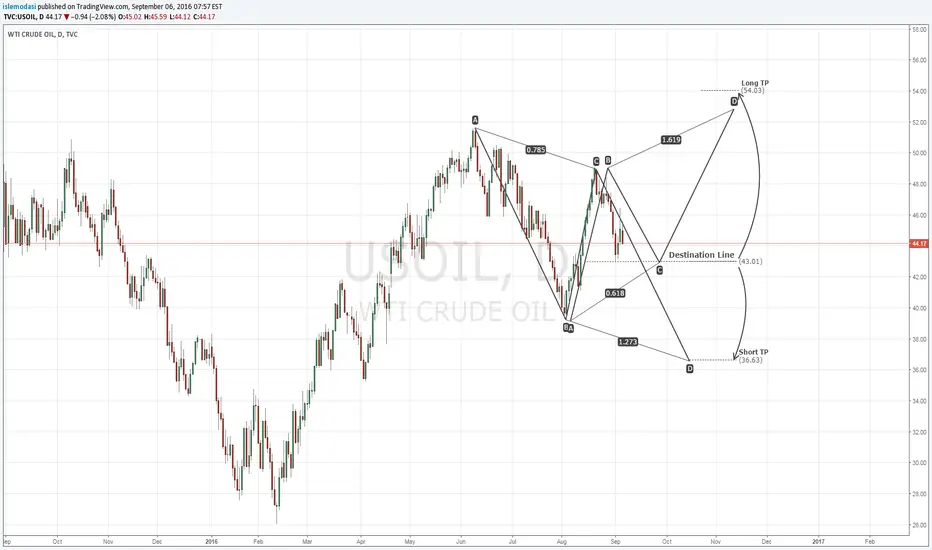
Crude oil Looks to be in 3rd of 5th wave Of C waveDef completing its correction soon.... anywhere around here is a solid buy. Obviously lower targets however RvsR would be high
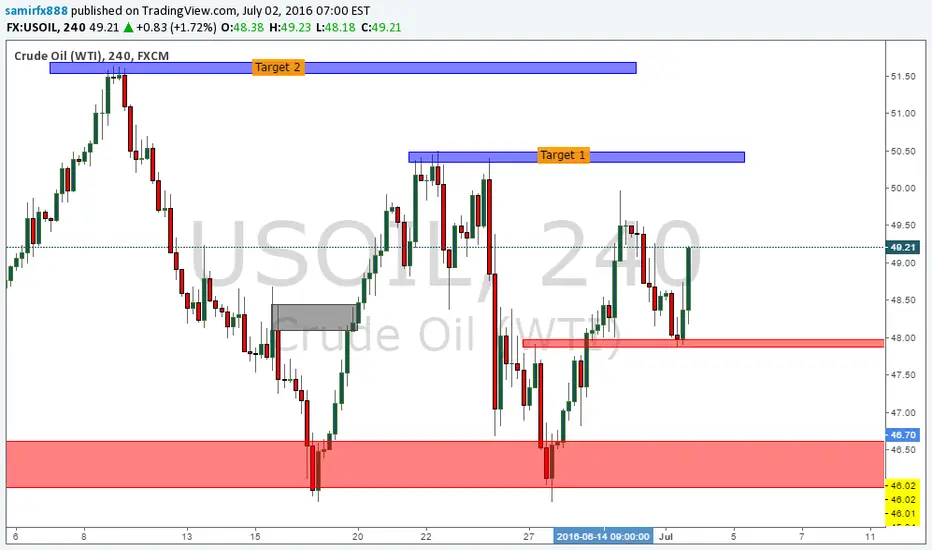
USOIL. Short term potentially into long term USOIL has raided into daily OB. retest the breaker. upside target
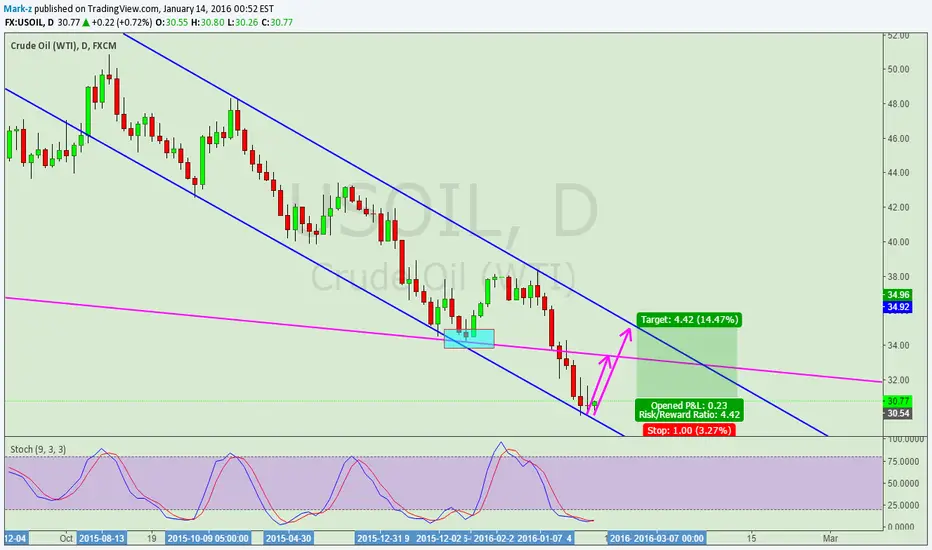
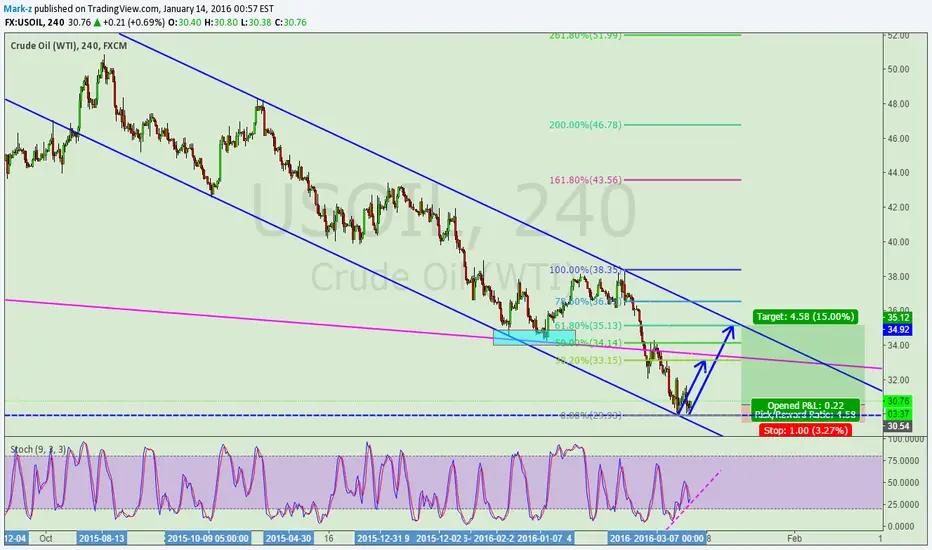
Crude oil is expected to rebound in the short term is expected tPrices have come to the bottom of the downward channel trend line, 30!
SL:29.50
TP1:33
TP2:35
Crude oil is expected to rebound in the short term is expected tPrices have come to the bottom of the downward channel trend line, 30!
SL:29.50
TP1:33
TP2:35