USOIL:Go short before you go long
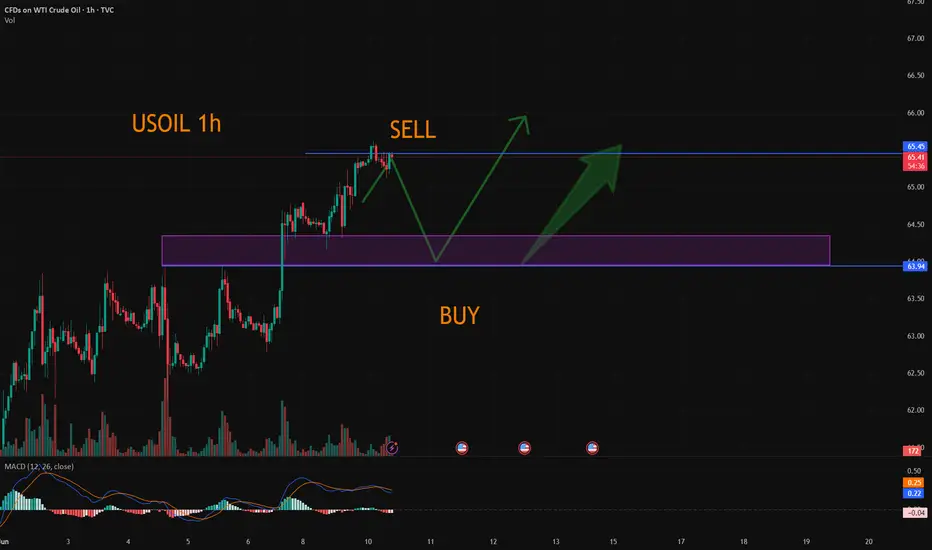
USOIL:Crude oil trend in line with expectations to break 65, hourly level to see adjustment, trading can be done first short and then long. Here are my range trading ideas.
Trading Strategy:
SELL@65.4-65.5
TP:64.5-64.
BUY@64.5-64
TP: 65.3-65.5
↓↓↓ More detailed strategies and trading will be notified here ↗↗↗
↓↓↓ Keep updated, come to "get" ↗↗↗
Usoillong
USOIL: Downward Movement in Primary-Secondary AlternationUSOIL's short-term trend is moving downward in a primary-secondary alternating pattern. After hitting $66.2, the moving average system diverges downward, indicating an objectively downward short-term trend. In terms of momentum, the MACD indicator opens downward below the zero axis and coincides with bearish columns, suggesting abundant downward momentum. It is expected that the intraday crude oil trend will continue to fall and seek support below $64.5.
USOIL
sell@65-65.5
tp:64.5-64
I am committed to sharing trading signals every day. Among them, real-time signals will be flexibly pushed according to market dynamics. All the signals sent out last week accurately matched the market trends, helping numerous traders achieve substantial profits. Regardless of your previous investment performance, I believe that with the support of my professional strategies and timely signals, I will surely be able to assist you in breaking through investment bottlenecks and achieving new breakthroughs in the trading field.
USOIL Trade Setup: Watching for a Bullish Break After Pullback 📈 US OIL Trade Plan
Currently, USOIL is in a strong bullish trend 🔥 — price action has pushed into overextended territory, which opens the door for a potential pullback 🌀.
I'm watching for a WTI retracement into equilibrium, ideally aligning with the 50%–61.8% Fibonacci levels from the previous swing low to high 🔍📉. If price corrects into that zone and we find support, followed by a bullish break in market structure 💥 — that would be the confirmation I’m waiting for to consider a long position 🚀.
⚠️ Key Level to Watch: That structure break is the trigger — no confirmation, no trade 🧠.
⚠️ Disclaimer:
This content is for educational and informational purposes only and should not be considered financial advice. Always conduct your own analysis and consult a professional before making trading decisions. Trade responsibly.

The rollover of crude oil contracts leads to price differences.Crude oil is currently in the contract rollover phase, and prices may vary between different brokers. For specific trading strategies, you can contact me directly, and I will provide you with accurate trading strategies accordingly.
I am committed to sharing trading signals every day. Among them, real-time signals will be flexibly pushed according to market dynamics. All the signals sent out last week accurately matched the market trends, helping numerous traders achieve substantial profits. Regardless of your previous investment performance, I believe that with the support of my professional strategies and timely signals, I will surely be able to assist you in breaking through investment bottlenecks and achieving new breakthroughs in the trading field.

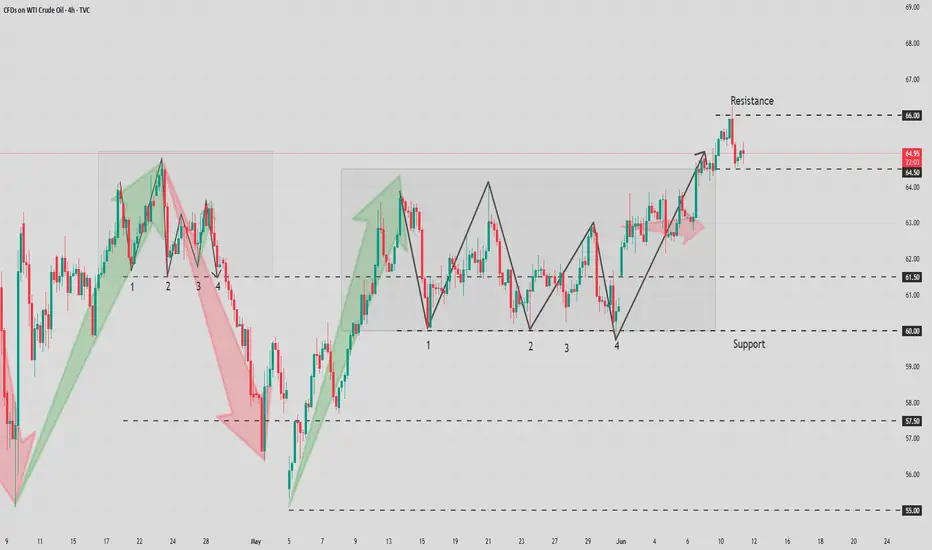
Possible "W Pattern" Initiation After Breaking Through $64.5USOIL surged strongly last Friday, closing with a large bullish candle on the daily chart. Since the sharp decline on April 4th, the $64.5 level has acted as resistance on the chart. The price remained capped at $64.5 for four consecutive trading days (Monday to Thursday) last week, but Friday’s strong bullish candle successfully broke above $64.5, signaling a valid breakout. This breakout suggests the formation of a potential W-bottom pattern, paving the way for further upward movement. Crude oil is expected to continue rising to new highs in today's trading.
USOIL
buy@63.5-64
tp:64.7-65.2
I am committed to sharing trading signals every day. Among them, real-time signals will be flexibly pushed according to market dynamics. All the signals sent out last week accurately matched the market trends, helping numerous traders achieve substantial profits. Regardless of your previous investment performance, I believe that with the support of my professional strategies and timely signals, I will surely be able to assist you in breaking through investment bottlenecks and achieving new breakthroughs in the trading field.

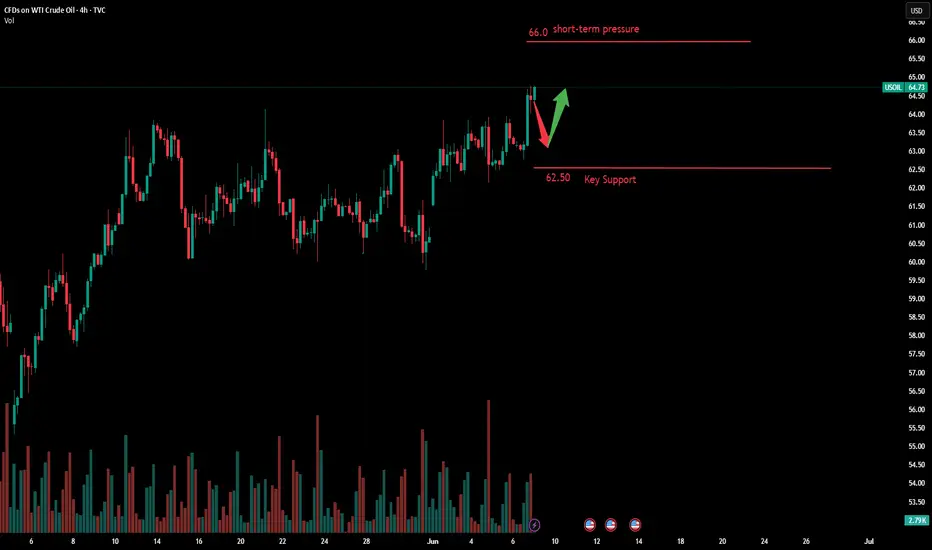
Crude oil breaks through strongly.On the daily chart of crude oil, the upper Bollinger Band is opening upward, and the 64.85 level is basically unable to hold. Once this level is broken, it will open up upward space, and the rally will just be beginning. After the breakout, the market will shift from the previous sustained oscillation to a strong unilateral trend, and the rally will at least continue with a wave of strength. Focus on going long at 63.50/64, or if there is a strong rally in the European session, pullbacks in the US session are also buying opportunities. Now it is about whether there will be a strong breakout.
Humans need to breathe, and perfect trading is like breathing—maintaining flexibility without needing to trade every market swing. The secret to profitable trading lies in implementing simple rules: repeating simple tasks consistently and enforcing them strictly over the long term.
Trading Strategy:
buy@63.5-64.0
TP:65.5-66.0
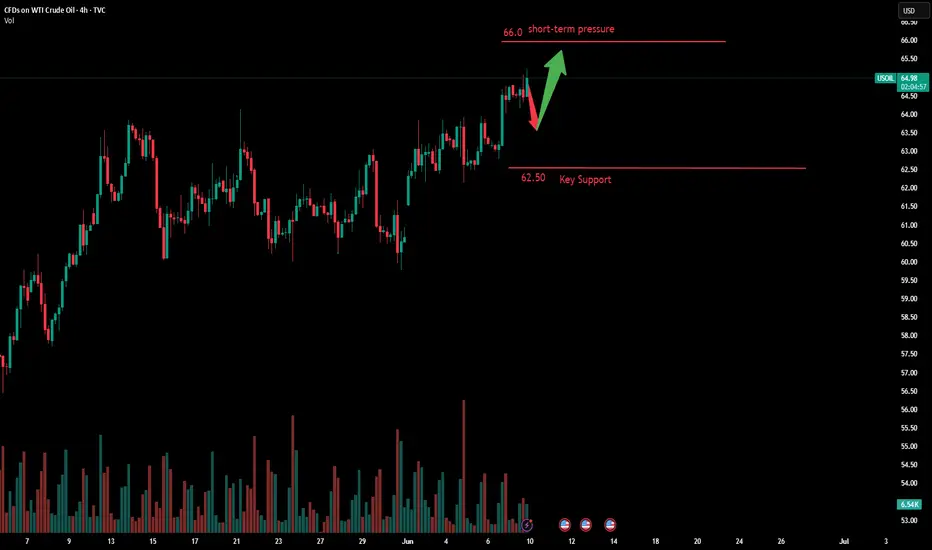
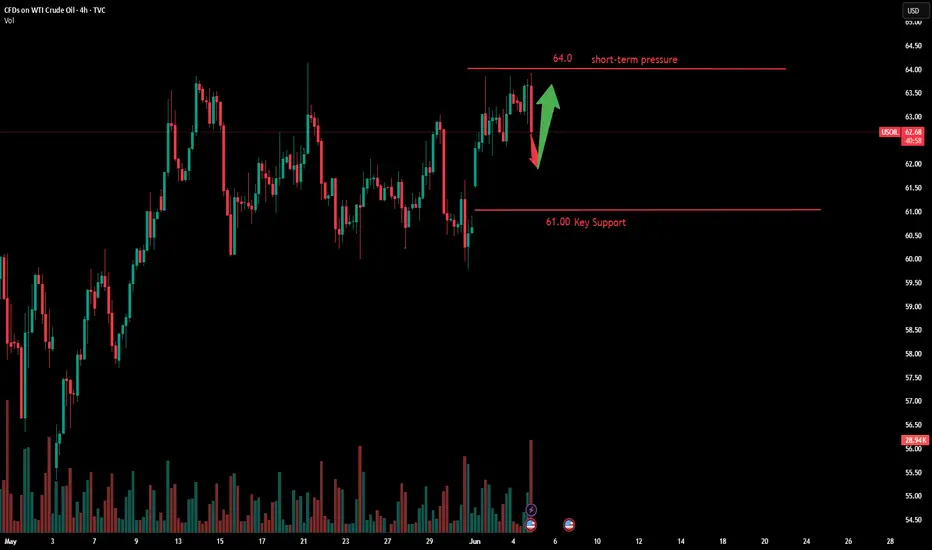
USOIL:Wait 63.6-64 to go long
Affected by last week's data, crude oil directly broke through the short-term pressure 64, technical point of view of the daily track upward opening, 64.8 position basically can not hold, and once the break open the space for rise, the rise has just begun;
After breaking from the early continuous shock to a strong unilateral, the market will at least continue a wave of strength, pay attention to 63.6-64 range to do more, or the European market force to rise, the United States is also more, now is to see a strong break.
Trading Strategy:
BUY@63.6-64
TP: 65-65.2
↓↓↓ More detailed strategies and trading will be notified here ↗↗↗
↓↓↓ Keep updated, come to "get" ↗↗↗

Analysis of Upward/Downward Trends in Monday's Opening MarketBoosted by the telephone conversation between leaders of the world's two largest economies, oil prices maintained their upward momentum on Friday. Brent crude stabilized at around $65 per barrel, notching its first weekly rebound since mid-May; WTI crude also held near $63. "Against the backdrop of gradually easing macro uncertainties, the risk of panic selling in the market has significantly diminished," analysts said. "With the arrival of the summer peak demand season and the superimposition of geopolitical tensions in the Middle East and Russia, the downside for oil prices has been notably constrained."
The recent steady rebound in oil prices indicates that the market has gradually digested macro uncertainties, though the underlying supporting factors remain fragile. While trade concerns have temporarily subsided, whether OPEC+ will continue to release capacity as expected by the market will be key to determining whether oil prices can sustain their rebound. Meanwhile, the options market reflects expectations of a year-end supply glut, which will test the coordination capabilities of oil-producing countries.
Overall, for next week's crude oil trading strategy, it is recommended to prioritize buying on dips and supplement with shorting on rebounds. In the short term, monitor resistance at the $66.0-$67.0 level, while short-term support lies at the $63.5-$62.5 level.
Humans need to breathe, and perfect trading is like breathing—maintaining flexibility without needing to trade every market swing. The secret to profitable trading lies in implementing simple rules: repeating simple tasks consistently and enforcing them strictly over the long term.
Trading Strategy:
buy@62.0-62.5
TP:64.5-65.0
Crude Oil is Building Momentum for a BreakoutDuring the U.S. trading session on Thursday, international oil prices fluctuated higher, with U.S. crude oil currently trading near $63.55 per barrel. Despite the intraday volatility, international oil prices remain under downward pressure, primarily influenced by two key factors.
First, data from the U.S. Energy Information Administration (EIA) showed that as of last week, U.S. gasoline and distillate inventories increased more than expected, signaling weakening refined product demand in the world’s largest economy. This development has sparked investor concerns about whether the U.S. summer driving season can sustain demand growth, leading to a ~1% decline in oil prices on Wednesday.
The current crude oil market is caught between supply and demand headwinds:
Supply-side pressures: OPEC+’s production increase plan and Saudi Arabia’s strategic price cuts have created short-term bearish sentiment.
Demand-side uncertainties: The unexpected rise in U.S. refined product inventories has amplified market doubts about the vigor of global consumption recovery.
Additionally, the escalation of international trade frictions has further dampened risk appetite, exacerbating downward pressure on prices.
In the short term, oil prices are likely to continue oscillating within the $60–$65 per barrel range. Market participants should closely monitor U.S. macroeconomic data and OPEC+’s compliance with its production policies for directional cues.
Humans need to breathe, and perfect trading is like breathing—maintaining flexibility without needing to trade every market swing. The secret to profitable trading lies in implementing simple rules: repeating simple tasks consistently and enforcing them strictly over the long term.
Trading Strategy:
buy@61.5-62.0
TP:63.0-63.5

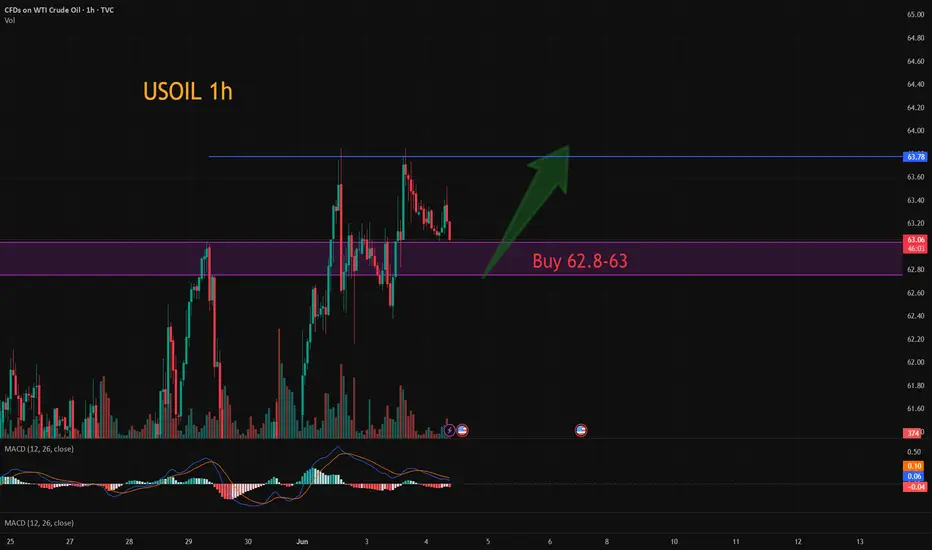
USOIL:tay long
USOIL: The short-term objective trend is oscillating. In terms of momentum, the MACD indicator is above the zero axis, showing a top divergence, indicating that the upward momentum is weakening. In the first two trading days, the overall rhythm trend was alternating between primary and secondary, and it is expected that the intraday crude oil trend will still maintain the probability of shock upward, so maintain the long idea.
Trading can wait for the retracement after the long.
Trading Strategy:
BUY@62.8-63
TP: 63.8-64
↓↓↓ More detailed strategies and trading will be notified here ↗↗↗
↓↓↓ Keep updated, come to "get" ↗↗↗
Maintain high-level volatility.In early trading on Wednesday in the Asian market, international oil prices fell slightly, mainly affected by the easing of supply-demand balance and the drag on the global economic outlook from trade concerns. Brent crude oil futures fell 0.1% to $65.58 per barrel, while U.S. WTI crude oil fell 0.1% to $63.32. This decline came after both rose about 2% in the previous trading day, hitting two-week highs. Tuesday's rally was driven by two main factors: first, large-scale wildfires in Canada since early May, which caused thousands of people to evacuate and disrupted part of crude oil production; second, markets expected Asian countries to reject the nuclear agreement draft proposed by the United States, thereby maintaining sanctions on the major oil-producing country and reducing crude oil supply. The current international oil market is in a game of multiple forces. On the one hand, geopolitical factors and natural disasters have increased short-term supply risks; on the other hand, OPEC+ production expansion and trade concerns have constrained the sustainability of price rebounds. In the absence of clear policy directions and confirmation from inventory data, oil prices may remain volatile at high levels.
Humans need to breathe, and perfect trading is like breathing—maintaining flexibility without needing to trade every market swing. The secret to profitable trading lies in implementing simple rules: epeating simple tasks consistently and enforcing them strictly over the long term.
Trading Strategy:
buy@62.0-62.5
TP:63.5-64.0
Crude oil surges stronglyInternational oil prices rose in early Asian trading on Tuesday, primarily driven by heightened risks of supply disruptions. Iran is expected to reject a U.S.-proposed nuclear deal proposal that could have paved the way for easing sanctions on Iranian oil exports. Additionally, wildfires in Alberta, Canada, have suspended part of oil and gas production, exacerbating market concerns about supply. Brent crude rose 0.85% to $65.18 per barrel, while U.S. West Texas Intermediate (WTI) crude gained 0.75% to $62.97, extending a nearly 3% rally from the previous session.
The current oil price surge reflects the effect (superimposition) of multiple factors, including geopolitical uncertainties and sudden natural disasters. Notably, the market’s reaction to the OPEC+ production increase strategy highlights its high sensitivity to supply-side control. The Iran and Canada incidents have further underscored the short-term vulnerability of the global oil market. If U.S.-Iran negotiations completely collapse or wildfires continue to spread, oil prices may sustain their upward momentum.
Technically, the K-line chart has repeatedly formed bullish candlesticks with long lower shadows and small real bodies, indicating strong buying support at lower levels. Short-term intraday crude oil is expected to retain further upside potential.
Humans need to breathe, and perfect trading is like breathing—maintaining flexibility without needing to trade every market swing. The secret to profitable trading lies in implementing simple rules: repeating simple tasks consistently and enforcing them strictly over the long term.
Trading Strategy:
buy@62.0-62.5
TP:63.5-64.0

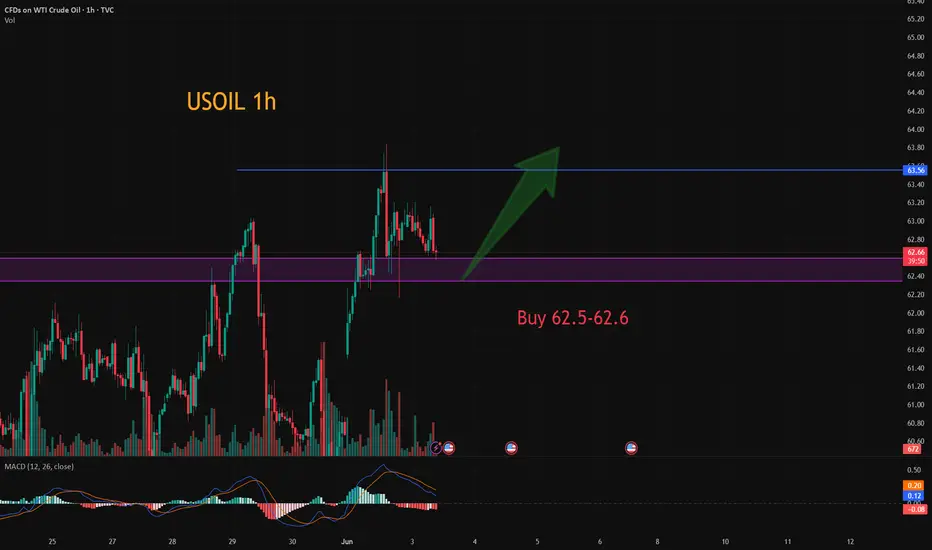
USOIL:Go long
Crude oil prices rose due to ongoing tariff uncertainty as well as ongoing geopolitical tensions in the Middle East.
From the chart, the K line has repeatedly appeared long lower shadow small solid positive line, indicating that the lower buying long support is strong. Expected intraday crude oil short - term trend still exists a wave of upward space.
Trading Strategy:
BUY@62.5-62.6
TP: 63.5-64
↓↓↓ More detailed strategies and trading will be notified here ↗↗↗
↓↓↓ Keep updated, come to "get" ↗↗↗
USOIL:First go short, then go long
USOIL: There are still signs of a pullback on an hourly basis after oil prices climbed to near 63 after OPEC+ said there would be no immediate changes to current production policies.
So the trading strategy :SELL@62.5-62.8 TP@61.6-61.3
After stepping back to the point can not break a wave of rebound, the target can look at 63 again
↓↓↓ More detailed strategies and trading will be notified here →→→
↓↓↓ Keep updated, come to "get" →→→

USOIL:Long thinking, target 62.5
USOIL: Same idea, the front 61.3-61.5 has been given to the entry point, it is slowly rising, the upper target is still seen near 62.5.
So strategically, stay long and wait for the rally, TP@62.5
Tip: It is always right to sell when there is a profit, according to individual risk appetite.
↓↓↓ More detailed strategies and trading will be notified here →→→
↓↓↓ Keep updated, come to "get" Or just find me→→→
USOIL:Long at 61.3-61.5
Last week's long target has been completed, the current decline is mainly due to concerns that global supply growth may exceed demand growth, from the technical trend, the objective trend of the middle line downward, short term long and short frequently alternate, pay attention to the support point of 60.3-60.5 within the day. Considering that it has been around this point of shock and not broken, short - term trading to do more.
So the trading strategy :BUY@61.3-61.5 TP@62.5-62.7
↓↓↓ More detailed strategies and trading will be notified here →→→
↓↓↓ Keep updated, come to "get" →→→

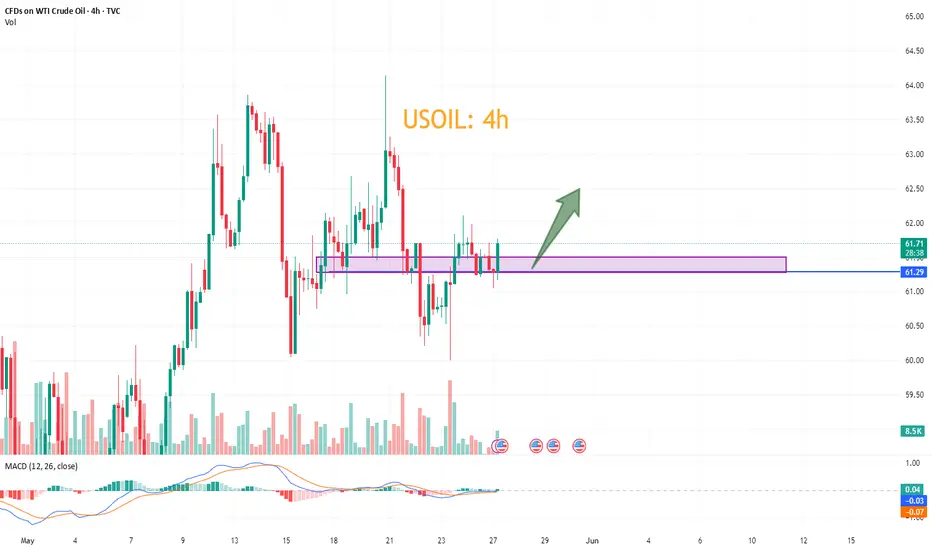
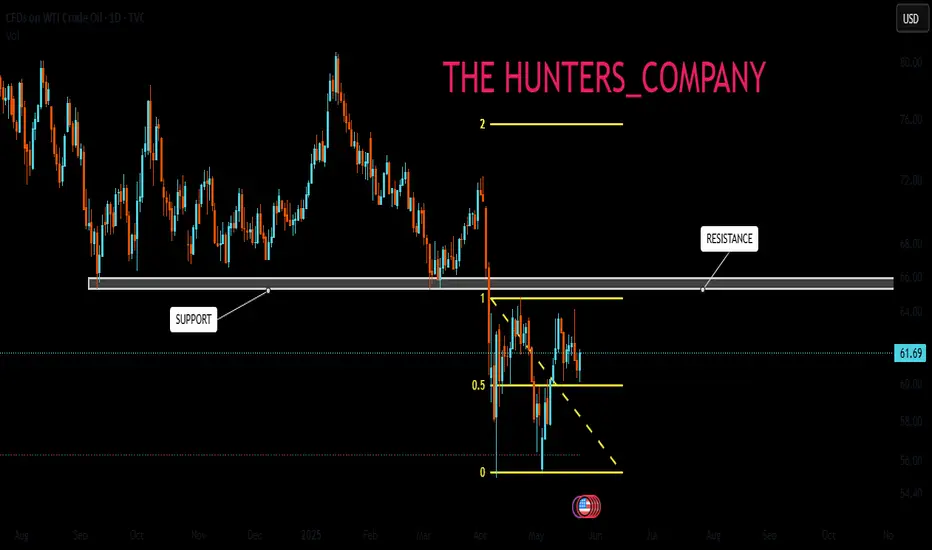
USOIL : What will happen to the price of oil?Hello friends
As you can see, we had support in the past, which has now become a strong resistance for the price after it was broken.
Now we need to see if the price will manage to break it at this moment when it is close to its key and sensitive resistance.
*Trade safely with us*
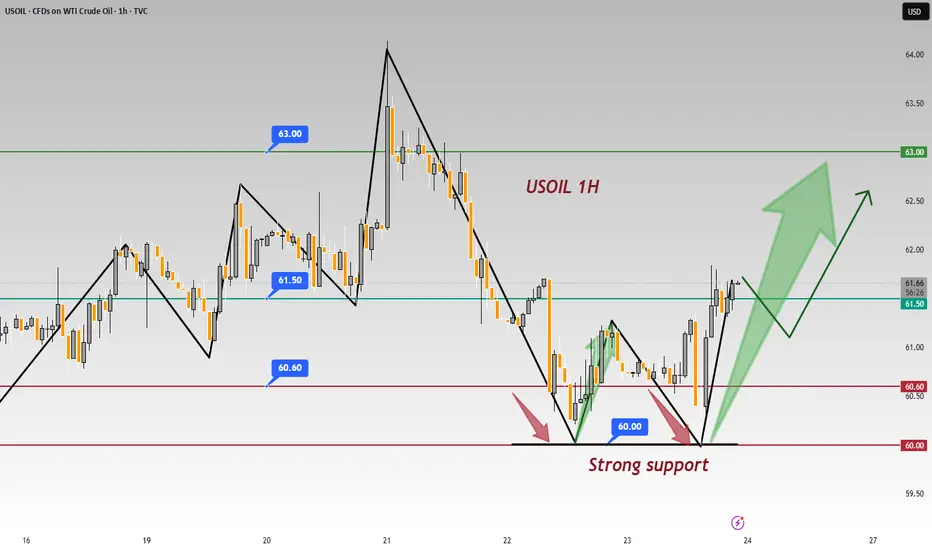
In - depth: USOIL 1 - hr Chart - Significance of 60.00 Support In the USOIL 1 - hour chart, 60.00 acts as a strong support 💪.
Support Validation
The price twice failed to break 60.00 and rebounded 📈. Psychologically, investors see 60.00 as a key level 🔑. Approaching it, buy orders pour in as they think crude oil is undervalued 📉. Technically, it's on a support line from prior lows, and repeated tests have fortified its support 🛡️.
⚡️⚡️⚡️ USOil ⚡️⚡️⚡️
🚀 Buy@ 60.00 - 60.60
🚀 TP 62.50 - 62.80
Accurate signals are updated every day 📈 If you encounter any problems during trading, these signals can serve as your reliable guide 🧭 Feel free to refer to them! I sincerely hope they'll be of great help to you 🌟 👇
Latest Strategic Positioning for Crude OilDuring the US trading session, crude oil prices declined for the second consecutive trading day after rebounding from intraday lows and encountering resistance. The commodity traded at $60.42 per barrel, representing a 1.87% daily loss.
Per the Commitments of Traders (COT) report released last Friday, there exists a moderate divergence in sentiment between managed funds and asset management firms regarding WTI crude oil futures. While both investor categories maintain net long positions, over the prior two weeks, managed funds reduced their net long exposure by approximately 20,000 contracts, whereas large speculators increased their net long positions by 10,000 contracts.
Technically, crude oil exhibited a "rally-and-reversal" pattern today, retreating under selling pressure near the $61.7 resistance zone before stabilizing and rebounding around $60.0. Current price action indicates a range-bound oscillation, with bullish stabilization probabilities contingent on the $60.0 support level holding firm.
In summary, crude oil remains trapped in a narrow consolidation phase, with overhead resistance levels retaining dominance. For today's trading strategy, a "rebound shorting-first" approach is recommended, complemented by tactical long positions on dips. Key resistance lies between $61.7-$62.5, while support zones are identified at $60.0-$59.0.
In the market, there are no absolutes, and neither upward nor downward trends are set in stone. Therefore, the ability to judge the balance between market gains and losses is your key to success. Let money become our loyal servant.
Will crude oil prices continue to rise?On Wednesday, international crude oil prices surged to nearly a one-month high amid market concerns over supply disruptions in the Middle East. News that Israel may strike Iranian nuclear facilities has ignited a risk premium for crude oil, while stalled progress in U.S.-Iran nuclear negotiations has also tightened supply expectations. The latest data from the Fujairah Oil Industrial Zone in the UAE showed that as of the week ending May 19, total refined product inventories at the Port of Fujairah stood at 20.562 million barrels, a 4.9% decline from the previous week. Light distillate inventories fell by 357,000 barrels to 8.277 million barrels, medium distillate inventories dropped by 467,000 barrels to 1.295 million barrels, and heavy residual fuel oil inventories rose by 1.651 million barrels to 10.99 million barrels.
Crude oil experienced a pullback today, with prices oscillating lower after the opening, showing minor fluctuations. Notably, prices gradually broke to new lows, suggesting a high probability of a rapid decline. Overall, crude oil has been in a stalemate between rally and correction recently, showing a pattern of daytime declines and night-time gains, but this may shift today. In trading, consider going long on rebounds as the primary strategy and shorting at highs as a secondary approach. Monitor resistance at the $63.0-$64.0 per barrel level and support at the $61.0-$60.0 per barrel level.
Trading Strategy:
buy@60.0-61.0
TP:63.0-64.0
In the market, there are no absolutes, and neither upward nor downward trends are set in stone. Therefore, the ability to judge the balance between market gains and losses is your key to success. Let money become our loyal servant.
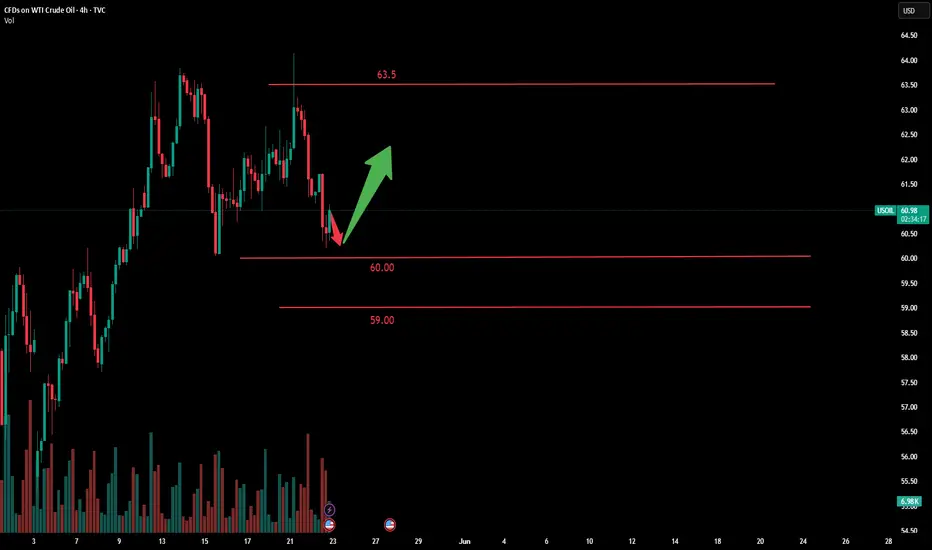
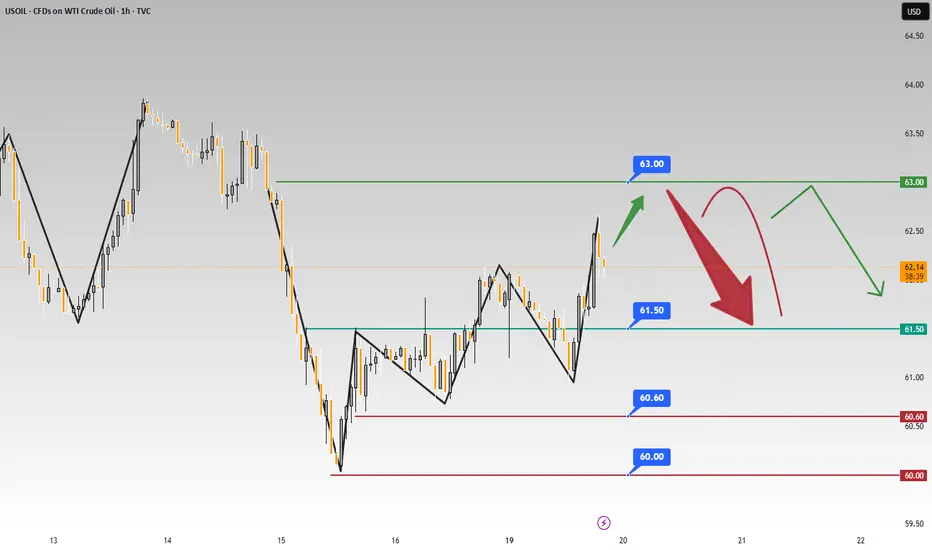
Crude oil: 63.00 resistance & 60.00 support keyPrices are currently testing the upper resistance at $63.00 📈. These levels are suppressing the price 🔻. A decisive breakthrough above this level may trigger a more intense upward rally 🔥. Meanwhile, recent selling pressure has pushed the price down to $60.60 📉. Watch the pivot support at $60.00, the real downward target 🎯
Crude oil surplus expanded in April, and imports increased, reaching multi - month highs from some countries 🌍. If global benchmark oil prices rise in the future, purchases may be reduced 📉.
Crude oil fell first and then rose today 📊. After a deep dive to $60.9, it stabilized and started to rise 🔼. After the previous price increase and adjustment, it remains to be seen if the upward momentum will continue and break through upwards 🔍.
Overall, on the delivery day, oil prices are volatile 🔼🔽. Watch the resistance at $63.0 on the upside and the support at $60.60 - $60.0 on the downside 👀.
⚡️⚡️⚡️ USOil ⚡️⚡️⚡️
🚀 Sell@ 62.50 - 62.30
🚀 TP 61.50 - 60.60
Accurate signals are updated every day 📈 If you encounter any problems during trading, these signals can serve as your reliable guide 🧭 Feel free to refer to them! I sincerely hope they'll be of great help to you 🌟 👇
USOIL:Beware of pullback.The short-term trend of crude usoil continues to fluctuate and fall, hitting the 60 mark. Usoil prices gained some support at 60 and formed a rebound rhythm. The moving average system still suppresses oil prices, and the objective short-term trend direction remains downward. In terms of momentum, the MACD indicator crosses upward below the zero axis, and bullish momentum strengthens. It is expected that after a slight upward movement in crude oil prices during the day, there is a high probability of being blocked again near 62.50 and falling.
USOIL
sell@62-62.5
tp:61-60.5
I am committed to sharing trading signals every day. Among them, real-time signals will be flexibly pushed according to market dynamics. All the signals sent out last week accurately matched the market trends, helping numerous traders achieve substantial profits. Regardless of your previous investment performance, I believe that with the support of my professional strategies and timely signals, I will surely be able to assist you in breaking through investment bottlenecks and achieving new breakthroughs in the trading field.

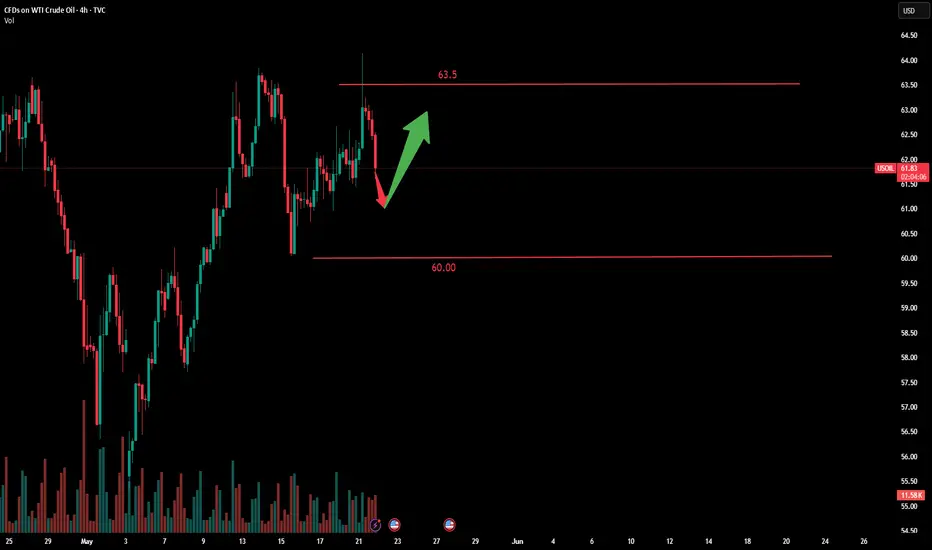
USOIL UPDATEweek hit its largest since the week of March 7, 2025. The EIA crude oil inventory for the week stood at 3.454 million barrels, contrasting with the expected -1.078 million barrels and the previous figure of -2.032 million barrels.
On Wednesday, crude oil exhibited a high-range oscillatory pattern: it stabilized and rebounded near $62.7, then pulled back after reaching $63.6, maintaining volatility within a narrow upper range. Influenced by the large bullish candlestick on the daily chart, oil prices still carry an upward probability.
Overall, crude oil remains in a bullish consolidation phase. For trading strategies, a "buy low, sell high" approach is recommended, with resistance levels to watch at $63.6–64.5 and support levels at $62.7–61.2.
you are currently struggling with losses, or are unsure which of the numerous trading strategies to follow, at this moment, you can choose to observe the operations within our channel.
