USOIL:The short-term trend direction resumes an upward trend.The short-term trend of USOIL has started to rise again and is currently fluctuating around $63. The moving average system is in a bullish arrangement, and the objective short-term trend direction has resumed an upward trend. The oil price in the early trading session has declined within a narrow range, forming a secondary rhythm. According to the law of primary and secondary alternation, it is expected that the intraday trend of crude oil will continue to rise slightly.
USOIL
buy@62-62.5
tp:64-64.5
I am committed to sharing trading signals every day. Among them, real-time signals will be flexibly pushed according to market dynamics. All the signals sent out last week accurately matched the market trends, helping numerous traders achieve substantial profits. Regardless of your previous investment performance, I believe that with the support of my professional strategies and timely signals, I will surely be able to assist you in breaking through investment bottlenecks and achieving new breakthroughs in the trading field.
Usoillong

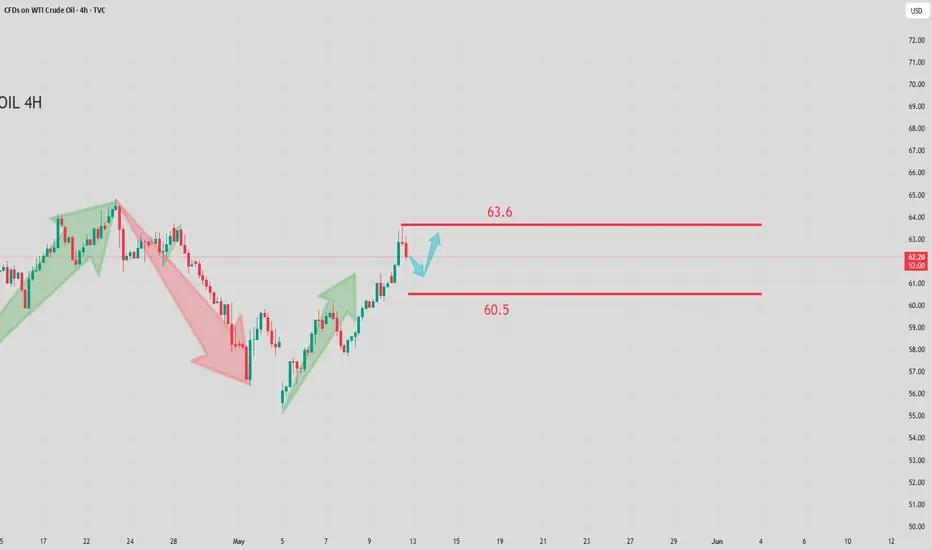
USOIL Today's strategyThe short-term trend of USOIL hit a new high, reaching around $63.5 before falling back and adjusting. The oil price broke below the moving average system, and the objective short-term trend direction has entered a transformation. In the MACD indicator, the fast and slow lines crossed below the zero axis, and the bearish momentum is quite strong. It is expected that after the oil price in the day falls back in line with the trend, it will obtain support near 60 and then rebound upwards.
USOIL
sell@62-62.5
tp:61-60.5
I am committed to sharing trading signals every day. Among them, real-time signals will be flexibly pushed according to market dynamics. All the signals sent out last week accurately matched the market trends, helping numerous traders achieve substantial profits. Regardless of your previous investment performance, I believe that with the support of my professional strategies and timely signals, I will surely be able to assist you in breaking through investment bottlenecks and achieving new breakthroughs in the trading field.

Crude oil trend todayInternational oil prices continued last week's upward trend. Brent crude oil futures rose 27 cents to $66.06 per barrel; WTI crude oil futures rose 28 cents to $63.5 per barrel. OPEC+ plans to accelerate the pace of production increase from May to June to meet market demand. However, according to market surveys, the production of the organization in April instead saw a slight decline. The expected production increase has, to a certain extent, curbed the room for oil prices to rise. The United States and Iran concluded nuclear negotiations in Oman and plan to continue consultations. If an agreement is reached, the return of Iranian crude oil supply will increase global supply pressure, which may push down oil prices. In addition, data shows that the number of active oil and gas drilling rigs in the United States last week dropped to the lowest level since January this year, reflecting that U.S. energy companies remain cautious about the future market. Crude oil showed a volatile upward trend, and the oil price broke through the previous high, reaching the expected price. The oil price has formed a three-wave structure. If the subsequent adjustment does not break through the channel, there is a high probability of a continuation of the bullish trend.
The increase in crude oil has approached the previous wide-range oscillation pressure level. Whether it can break through still requires some tug-of-war. In terms of operation, it is considered to lay out long positions on the pullback as the main strategy, with short selling at highs as a supplementary strategy. Pay attention to the resistance at the range of $63.5-64.5 per barrel, and the support at the range of $62.2-61.1 per barrel.
you are currently struggling with losses, or are unsure which of the numerous trading strategies to follow, at this moment, you can choose to observe the operations within our channel.
US-Oil will further push upside After Testing TrendlineAt present, the price of crude oil is above the key technical level, and the geopolitical sentiment has also become more favorable, so the short-term outlook for crude oil is bullish. If the upcoming Sino-US meeting leads to a relaxation of trade tensions, the upward momentum is likely to accelerate. Unless OPEC+ unexpectedly increases the supply, the target for the next few trading days may be set at $63 and higher. Crude oil opened lower this week and then rebounded. The weekly candlestick closed as a large positive candlestick, approaching the resistance of the 5-week moving average. On the daily chart, after the second pullback, the price rebounded upwards without breaking the low point. $64.80 is a key watershed. Below this level, there is still a possibility of a bearish trend. In the short term, the trend is bullish. Overall, it is expected to rise first and then fall next week. Pay attention to the resistance at $63.50 and go short, and set the stop-loss with the position of $64.80 for a bearish outlook.
you are currently struggling with losses, or are unsure which of the numerous trading strategies to follow, at this moment, you can choose to observe the operations within our channel.
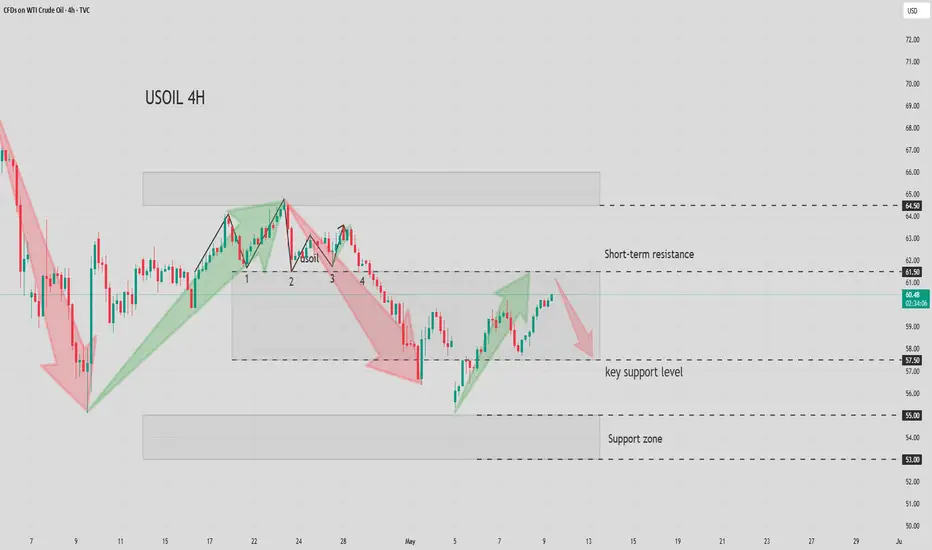
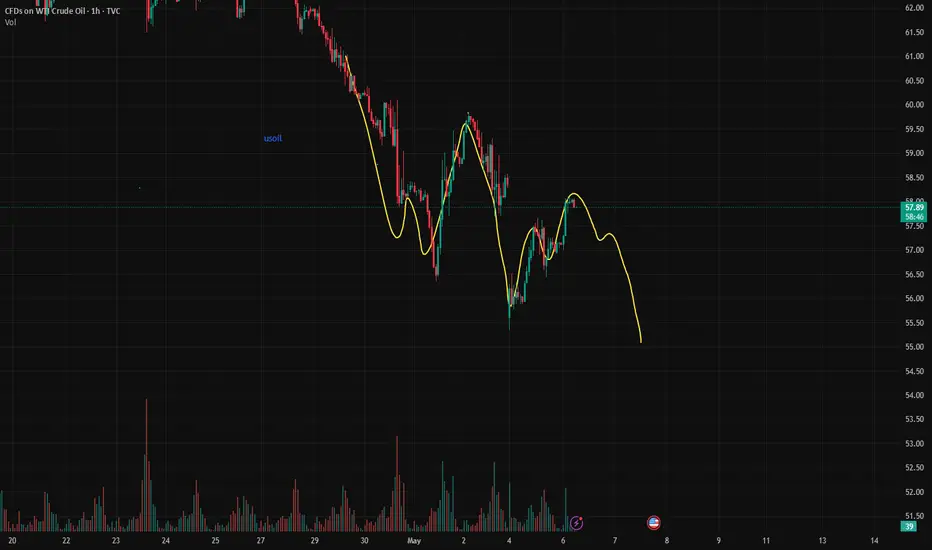
USOIL: Oscillating and Declining within the RangeFor USOIL, its short-term trend has rebounded after hitting the bottom again. The oil price has repeatedly crossed the moving average system, and its objective short-term trend is in a sideways oscillation. Overall, it has formed a wide fluctuating range in its rhythm. In the early trading session, the oil price oscillated above the range, showing signs of insufficient upward momentum. It is expected that the intraday trend of crude oil will mainly fluctuate within the range.
USOIL
sell:60.5-61.5
tp:59.5-58.5
I am committed to sharing trading signals every day. Among them, real-time signals will be flexibly pushed according to market dynamics. All the signals sent out last week accurately matched the market trends, helping numerous traders achieve substantial profits. Regardless of your previous investment performance, I believe that with the support of my professional strategies and timely signals, I will surely be able to assist you in breaking through investment bottlenecks and achieving new breakthroughs in the trading field.
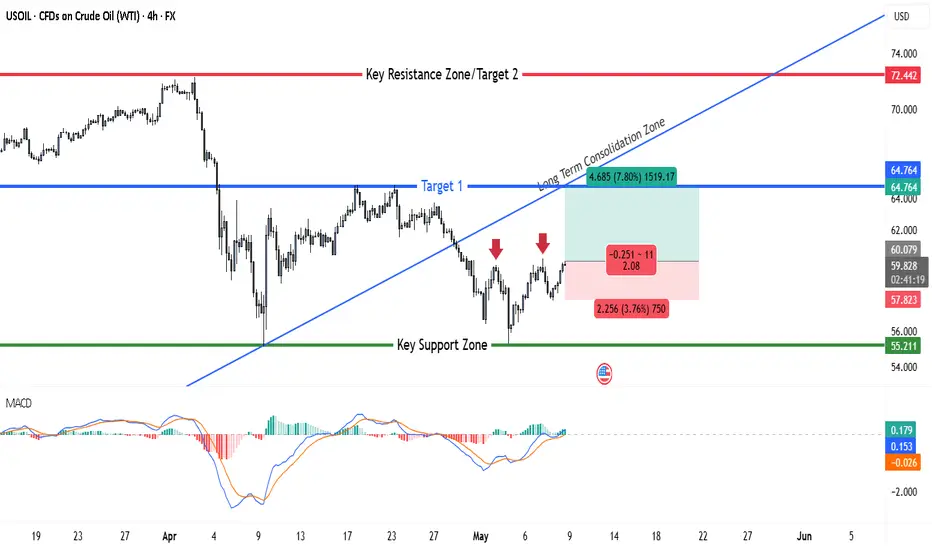
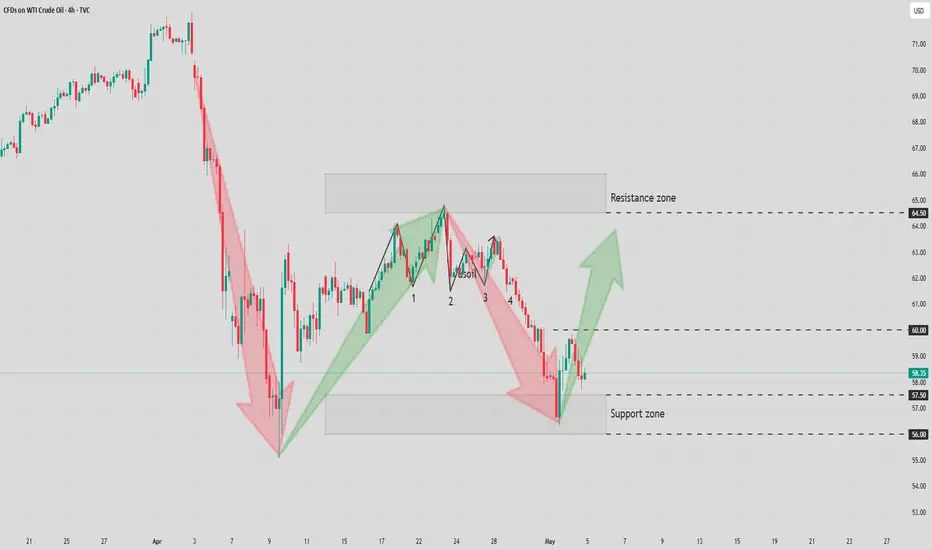
USOIL Bulls Eye Breakout – Can Momentum Carry It to $64The 4-hour chart of USOIL shows a market that has recently experienced a sharp decline, followed by a consolidation phase near a key support level. This key support zone is clearly defined at 55.21 USD, where the price found strong buying interest and bounced back up. From there, the market started to climb, attempting to form a potential short-term bottom.
The price is now approaching a previous trendline, which used to act as support during the uptrend and is now being retested as resistance. This retest area overlaps with horizontal resistance at around 60.00 USD, making it a critical decision zone. The two red arrows in the image mark failed attempts to break higher, indicating sellers are still active at this level.
If the price manages to break through this resistance with strength, the next likely objective is Target 1, set at 64.76 USD. This level coincides with the prior support that was broken during the selloff and could now act as a strong resistance. Beyond that, Target 2 at 72.44 USD marks a major resistance zone from which the last downtrend began.
From a trade setup perspective, the chart suggests a bullish opportunity:
The entry is near 59.98 USD, just above the short-term consolidation area, ideally after a breakout.
The stop loss is placed just below the recent swing low, at around 57.82 USD, providing room for volatility without exposing the trade to unnecessary risk.
The take profit is positioned at 64.76 USD, giving this trade a clear structure with a risk-to-reward ratio of about 1:3.75, which aligns well with strong risk management principles.
Additionally, the MACD indicator at the bottom supports the bullish bias. It shows a recent crossover of the MACD line above the signal line, with a rising histogram—indicating building upward momentum.
In summary, this chart presents a well-structured bullish setup with a favorable risk-to-reward ratio, clear entry and exit levels, and supporting momentum signals. However, the region around the trendline retest remains crucial. A strong close above this zone would confirm the breakout, while another rejection could signal the need for caution or reevaluation.
USOIL:Strategic Analysis on ThursdayThe interest rate decision of the Federal Reserve is in line with market expectations.
Regarding the trend of USOIL, the price of $57.5 serves as the watershed between the bullish and bearish trends, and whether this price level rises or falls will directly affect the subsequent market trend.
At the same time, the conflict between India and Pakistan has recently escalated, with the most severe military confrontation in the past decade, and the civil war in Sudan is also intensifying. These geopolitical conflicts not only pose a serious threat to regional and global peace and stability but will also stimulate the commodity market. The potential threat of war to energy supply may also drive up the prices of energy sources such as crude oil.
USOIL
buy@57.5-58
tp:59-59.5
I am committed to sharing trading signals every day. Among them, real-time signals will be flexibly pushed according to market dynamics. All the signals sent out last week accurately matched the market trends, helping numerous traders achieve substantial profits. Regardless of your previous investment performance, I believe that with the support of my professional strategies and timely signals, I will surely be able to assist you in breaking through investment bottlenecks and achieving new breakthroughs in the trading field.

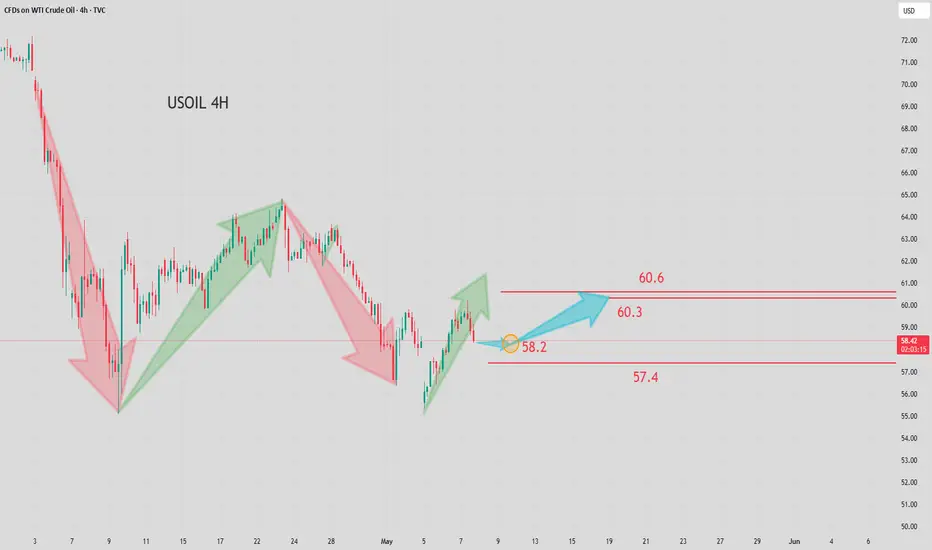
USOIL seems to be in a potential bullish reversalWTI crude oil futures rose slightly. Traders weighed factors such as the optimistic sentiment in Sino - US trade, the decline in US production, and the technical position, while also considering the persistent concerns about supply surplus. The recent decline in oil prices is largely due to the decision of OPEC + to accelerate production increase for the second consecutive month. It is reported that the number of drilling rigs is being reduced, which implies that the future shale oil production may decline, providing support for the bullish view on oil prices. This supply restriction, together with the signs of strong demand from Europe and China, helps to stabilize market sentiment. Crude oil showed a trend of rising first and then falling today. After reaching $60.2, it showed a callback trend. After two consecutive positive days on the daily chart, the oil price adjusted, which may indicate that crude oil will continue to maintain a wide - range oscillation. Overall, the reduction in crude oil inventory is expected to support the rebound of oil prices.
you are currently struggling with losses, or are unsure which of the numerous trading strategies to follow, at this moment, you can choose to observe the operations within our channel.
Trading Strategy:
buy@57.4-58.4
TP:59.4-60.6
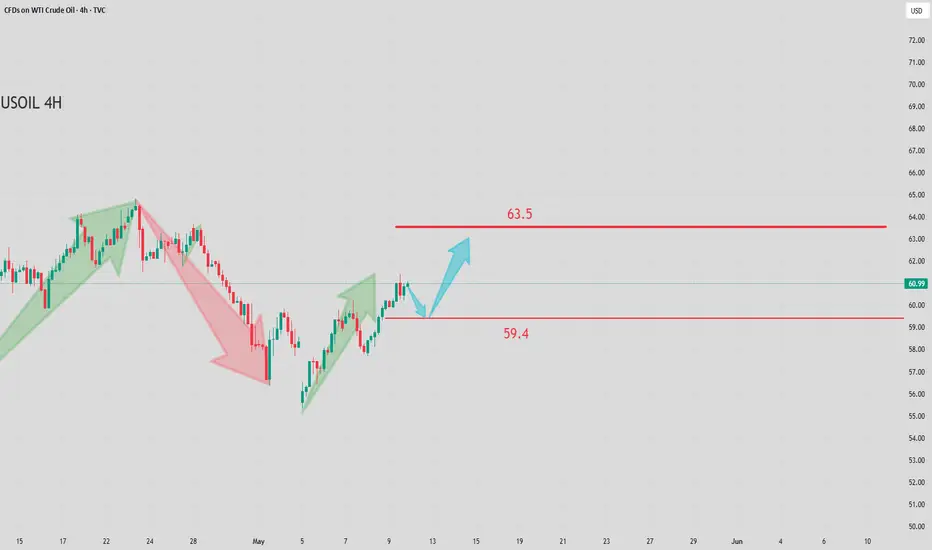
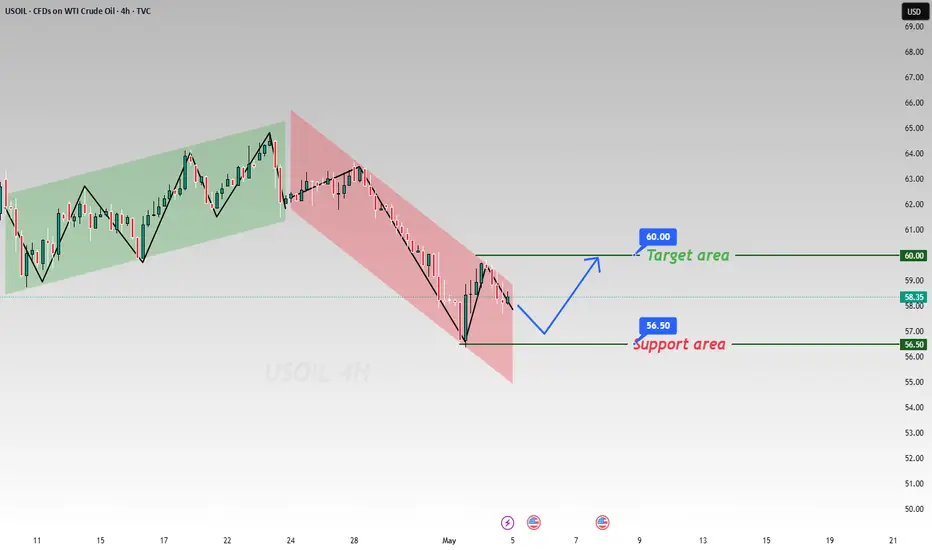
USOIL:Fluctuate upwardsThe trend of USOIL continues to rebound upwards and retests the level of $60 again. The moving average system shows a bullish arrangement, relying on the oil price, and the short-term objective trend direction is upwards. The overall rebound and upward movement follows the law of primary and secondary alternation and has good continuity. In terms of momentum, the fast and slow lines of the MACD indicator are above the zero axis, indicating that the bullish momentum is dominant, but the momentum strength is not strong. It is expected that the crude oil is more likely to continue to move in a volatile upward trend today.
USOIL
buy@59-59.5
tp:60.5-61
I am committed to sharing trading signals every day. Among them, real-time signals will be flexibly pushed according to market dynamics. All the signals sent out last week accurately matched the market trends, helping numerous traders achieve substantial profits. Regardless of your previous investment performance, I believe that with the support of my professional strategies and timely signals, I will surely be able to assist you in breaking through investment bottlenecks and achieving new breakthroughs in the trading field.

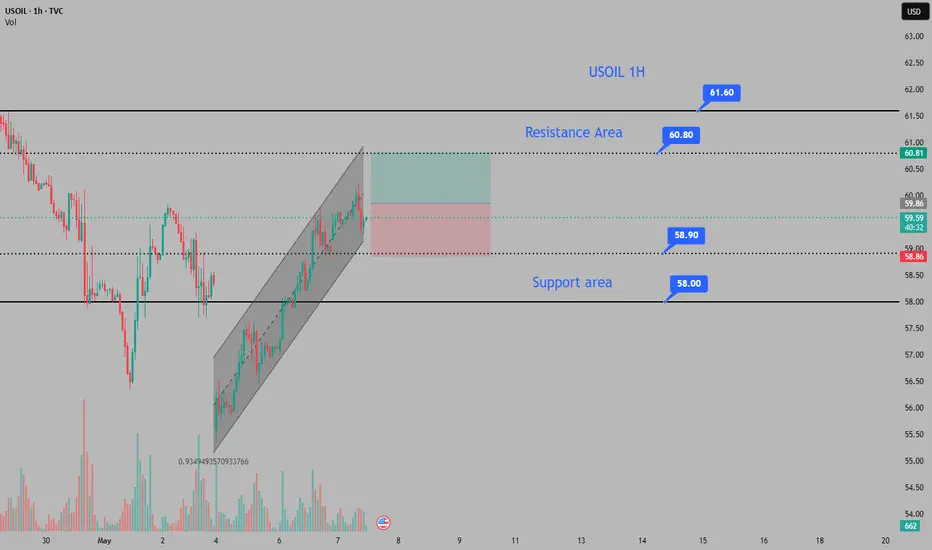
USOIL Trading strategiesOn Tuesday, due to the increase in demand from Asia and Europe, the decline in U.S. production, and the further escalation of the situation in Israel, international oil prices soared. After today's opening, oil prices have remained volatile at a high level, demonstrating strong resilience. The key dividing line between bulls and bears is at the crucial price level of $58.4. As long as this price level is not effectively broken, it will be difficult for the bullish trend of oil prices to change. Currently, oil prices are still within the bullish channel.
In terms of today's trading strategy, it is recommended to mainly place long orders on pullbacks, supplemented by a small number of short positions. Pay close attention to the resistance range of $60.8 - $61.6 above, and closely monitor the support area of $58.9 - $58.0 below.
USOIL
buy@58.80-59.30
tp:60.00-61.00
USOIL:Adapt to the trendTechnical indicators such as moving averages and MACD have a certain degree of lag. The oil price repeatedly crossing the moving average system highlights the current stalemate between bulls and bears and the volatile and oscillating trend. USOIL is influenced by multiple factors, including geopolitical situations, economic data, and OPEC+ policies. Any sudden change may subvert the price trend, causing a certain deviation in technical analysis signals.
At present, with the trend clearly defined, trading in the direction of the trend is the optimal strategy. In the early trading session, we decisively went long at the price of $57. Currently, we are still holding the position, following the trend closely and waiting for the further expansion of the profit margin.
In the future, we will continue to monitor the market changes and update the trading strategies in real time.
I am committed to sharing trading signals every day. Among them, real-time signals will be flexibly pushed according to market dynamics. All the signals sent out last week accurately matched the market trends, helping numerous traders achieve substantial profits. Regardless of your previous investment performance, I believe that with the support of my professional strategies and timely signals, I will surely be able to assist you in breaking through investment bottlenecks and achieving new breakthroughs in the trading field.

Can it hit the bottom and rebound?Fundamental Analysis: Driven by the trade concerns sparked by Trump and the risk aversion sentiment arising from the global economic slowdown, the trajectory of oil prices has been shaped. Additionally, OPEC+ convened an early meeting on Saturday and confirmed an increase in production of 411,000 barrels per day in June. This decision has indubitably intensified the market's apprehensions regarding the oversupply of crude oil 📉.
Technical Analysis: Technically speaking, the price of crude oil has persistently lingered below the midline of the Bollinger Bands, distinctly indicating that the bearish trend is in the ascendancy 📉. Last week, on the weekly chart, it closed with a substantial bearish candlestick, exhibiting a downward tail pattern, and in the short term, the price has been fluctuating within a trading range 📊. As for the upcoming week's trend, whether the support level established by the previous double doji bottoming formation will be broken through effectively will be the focal point of market attention 👀. Nevertheless, once the price reaches the crucial support level, there exists the potential for a technical rebound. Investors should closely monitor the variations in trading volume and the response of the moving average system 📈.
Market Situation: It is crucial to note that due to the holiday factor in the Asian market next Monday, market liquidity is anticipated to decline significantly. Under such circumstances, the oil price is likely to encounter a higher risk of more pronounced volatility, further escalating the uncertainty of the market situation ⚠️.
⚡⚡⚡ USOIL ⚡⚡⚡
🚀 Buy@56.0 - 57.0
🚀 TP 59.0 - 60.0
Accurate signals are updated every day 📈 If you encounter any problems during trading, these signals can serve as your reliable guide 🧭 Feel free to refer to them! I sincerely hope they'll be of great help to you 🌟
USOIL trading opportunities.After the "OPEC+ continued to increase production" on Monday, USOIL continued to fall to a four-year low near 55. However, it rebounded after opening low on Monday. It continued on Tuesday. Is it no longer able to fall?
Ludvig believes that it will continue to fall. Because the decline is caused by the growth of production capacity. The rise is caused by geopolitical strategic reserve materials. One of these two directly affects the trend of OIL, and the other indirectly.
The trend of economic data API/EAI will continue to be released. If the geopolitical weakening situation, the oil price data released is roughly negative, so it will continue to fall. But if the impact of geopolitics intensifies, this is a positive factor.
So the current trading direction that can be determined is to continue to short.
In terms of trading, traders with large funds can sell at the current price, and those with small funds can wait until the market returns to above 59 to sell.
The band trading center continues to update new real-time trading opportunities. If you don’t know how to trade, or don’t want to miss the next real-time trading opportunity, remember to follow me.
What adjustments will be made to oil prices?If traders don’t know how to trade, they can refer to the strategy of the Swing Trading Center. Earlier, it was announced to sell at 57.24. The lowest price reached around 56.3, and now the oil price has returned to 57.24. How to trade? If you are also confused, you can refer to the views of the Swing Trading Center.
At present, the supply of oil prices exceeds the demand, and some oil-producing countries will continue to increase the production of oil prices. The market has never recognized that oil will become a slow-selling product. Oil prices can be allowed to fall. But oil is not allowed to have no production capacity. I like this sentence.
Oil prices are expected to be mainly adjusted in the short term. The clear trading instructions have been announced in the Swing Trading Center. Stay tuned. Prevent missing good trading opportunities.
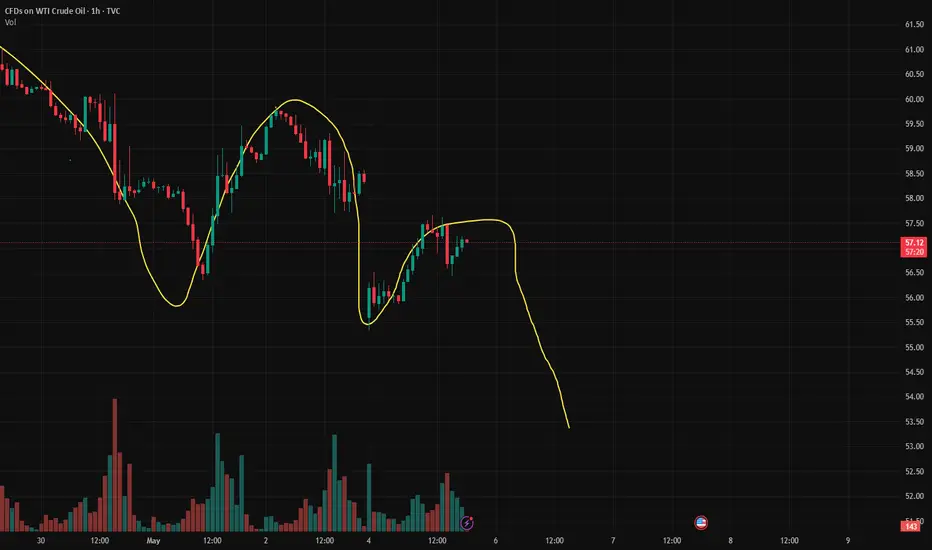
USOIL Today's strategyFrom a technical perspective, if USOIL can take advantage of the weakening of the DXY, stabilize and rebound near the current price, and break through the key resistance level, it may be able to form an upward trend. However, if it fails to effectively withstand the impact of the production increase by OPEC+, and breaks below the key support level, the price is likely to decline further.
Currently, it is necessary to closely monitor the competition around the price level of $55. If this level can be held, the probability of a rebound will increase. Once it is broken, the next support level may be around the $53 area. At the same time, continuously tracking the trend of the DXY and the subsequent policy dynamics of OPEC+ is of vital importance for judging the future trend of USOIL.
USOIL
buy@55-56
tp:57.5-58.5
I am committed to sharing trading signals every day. Among them, real-time signals will be flexibly pushed according to market dynamics. All the signals sent out last week accurately matched the market trends, helping numerous traders achieve substantial profits. Regardless of your previous investment performance, I believe that with the support of my professional strategies and timely signals, I will surely be able to assist you in breaking through investment bottlenecks and achieving new breakthroughs in the trading field.

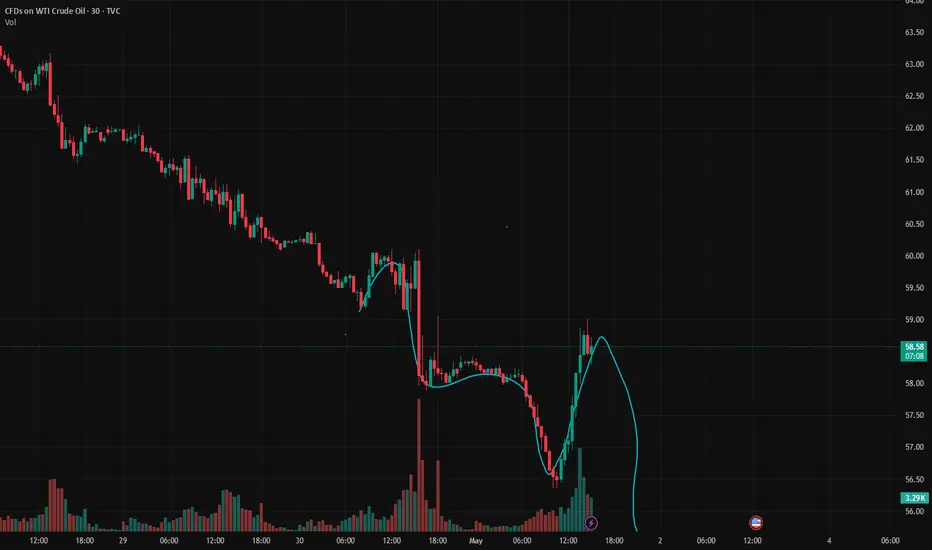
A Preliminary Double Bottom Support Pattern May Be FormingCurrently, factors such as geopolitics, OPEC+ policies, and the trend of the US dollar all have a two-sided impact on USOIL. Only the technical aspect reveals directional signals.
This week, the crude oil price rebounded rapidly after hitting a low of $56. It has formed the embryonic form of a double bottom with the previous low point, and this pattern may become a turning point in the market trend. According to the theory we proposed earlier, "A deep correction breeds a strong rebound," the price of $56 has become a key support level. If the oil price stabilizes at this level next week, the double bottom pattern is expected to be confirmed, which will in turn trigger a technical rebound. Conversely, once this key level is effectively broken, it is likely to trigger a concentrated sell-off of stop-loss orders, intensifying the downward pressure on the price.
I am committed to sharing trading signals every day. Among them, real-time signals will be flexibly pushed according to market dynamics. All the signals sent out last week accurately matched the market trends, helping numerous traders achieve substantial profits. Regardless of your previous investment performance, I believe that with the support of my professional strategies and timely signals, I will surely be able to assist you in breaking through investment bottlenecks and achieving new breakthroughs in the trading field.
The decisive day of major data (USOIL)
Yesterday, it was pointed out in the analysis circle: The support of 58 needs to be tested. Sure enough, buying at low levels continued to expand profits. The current price is 59.6. From the pressure analysis, the market is still affected by data that oversupply, and institutions will not reduce production in a short time. Therefore, oil prices will fall further,
The oil price broke through 59. Due to supply reasons, the market still has a downward range. 60-61 is a good choice to sell in succession.
tp58-57

USOIL trading alerts. Pressure and support.Oil also fell according to instructions. I just forgot to remind you. Sorry, but the profit is quite good. Sell short from 58.7. Then the lowest reached 56.34
But today in the New York market, USOIL rose again above 58. From a fundamental perspective. The market will continue to fall under pressure. But from the trend, we need to pay attention to the support of 58. If it does not fall today, it is likely to continue to fall based on Friday's trend. The pressure level near 59 needs to be paid attention to. In terms of operation, it is still mainly selling at high levels.
Always remind trading risks. So don't ignore this. If you don't know how to trade. Remember to wait and see. Don't trade blindly or gamble.
Many investor friends know that I have led some investors to create good profits for several consecutive days. If you don't know how to trade, remember to leave me a message and try it. Maybe your profit will double.
Can oil prices continue to be shorted? Of courseSaudi Arabia made a major strategic shift, willing to accept low oil prices and unwilling to cut supply.
Oil prices fell sharply as a result.
It is expected that oil prices will hit 55-56 in the short term, so the operation is still mainly shorting oil prices. Overcapacity.

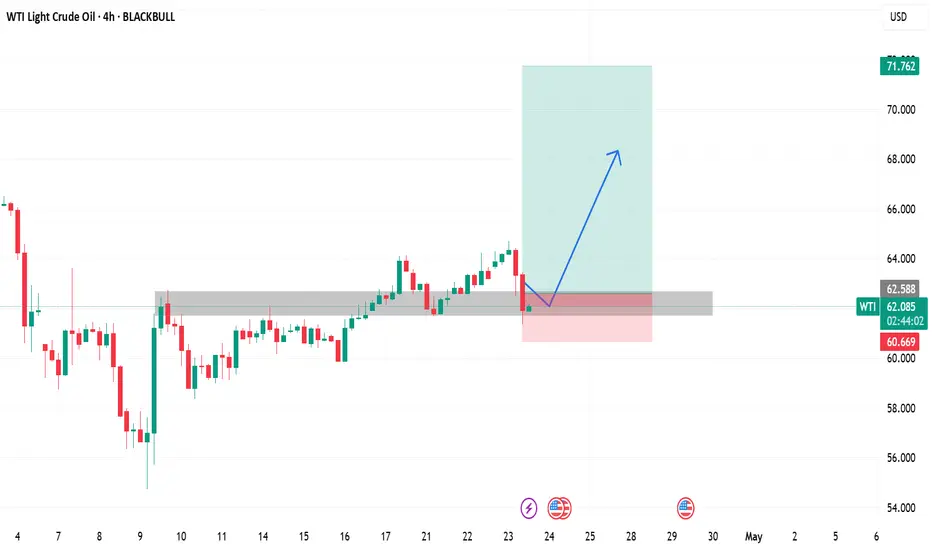
Crude Oil | Support Level 62.700-61.700Crude Oil reached support level.
Take Profit : 71.750
Stop Loss : 60.680
Market Analysis and Trading Strategy of USOILThe USOIL market has witnessed significant fluctuations recently. Yesterday, the price broke below the key support level of $61.5, and then it has been declining all the way. As of today, it has approached the vicinity of $59.5. This downward trend reflects that the bearish force currently dominates the market.
From a technical analysis perspective, once the support level of $61.5 is broken, its nature will transform into a strong resistance level. The rapid decline of the price to $59.5 indicates strong bearish momentum. Currently, the focus of the market is on the $59 mark, which is of crucial importance. If this support level is breached, according to the continuity of the price trend and the technical pattern, USOIL is highly likely to continue to decline further. The next important support level is around $57.5. Conversely, if the price can be effectively supported near $59, based on the technical repair demand after being oversold, the price is expected to rebound.
Based on the above analysis, in terms of trading strategy, investors can consider taking a short position near $60. If the price breaks below $59, the short position can be held, with the target price set at $57.5. If the price stabilizes and rebounds near $59, the stop-loss order should be executed in a timely manner to avoid expanding losses. Given the frequent release of important data recently and the significant impact of these data, market volatility will increase significantly. Investors must trade with caution, strictly control their positions, and set reasonable stop-loss levels to cope with the possible sharp price fluctuations.
I am committed to sharing trading signals every day. Among them, real-time signals will be flexibly pushed according to market dynamics. All the signals sent out last week accurately matched the market trends, helping numerous traders achieve substantial profits. Regardless of your previous investment performance, I believe that with the support of my professional strategies and timely signals, I will surely be able to assist you in breaking through investment bottlenecks and achieving new breakthroughs in the trading field.
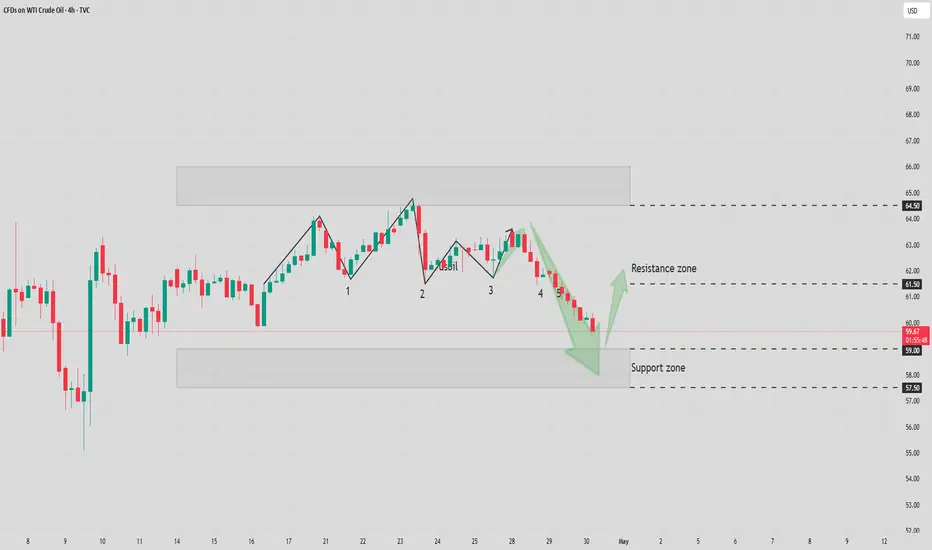
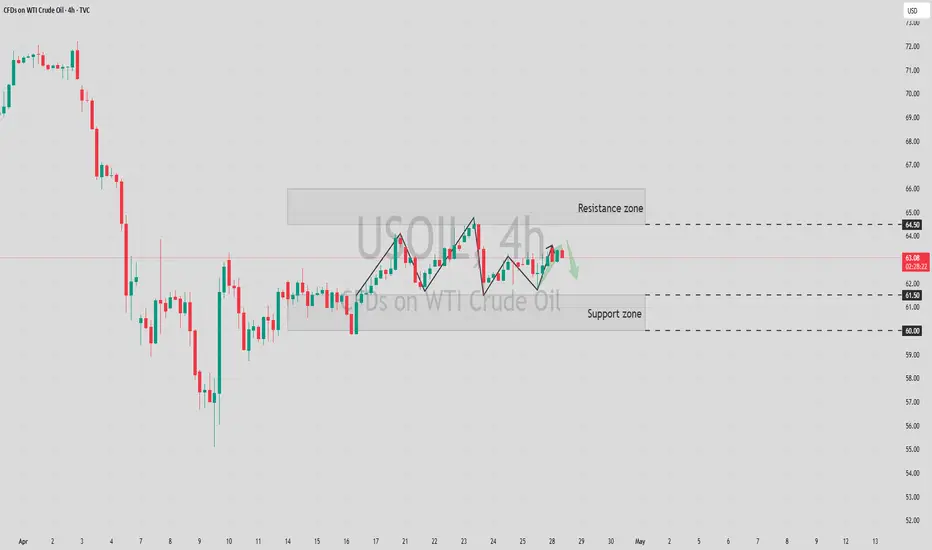
USOIL: Recent Analysis and Trading StrategiesOver the past two weeks, USOIL has been continuously fluctuating and consolidating within the price range of $61.5 - $64.5. The overall trend shows a pattern of rising first and then falling. During the upward phase, the bullish momentum was scarce, making it difficult to achieve an effective breakthrough. Subsequently, it shifted into a downward trend. Yesterday's market situation was particularly typical. It opened higher at $63.5 in the early trading session and then declined all the way. It not only broke below the key support level of $61.5 but also had weak rebound strength. Currently, the price is still hovering around this support level, indicating the market's indecision.
Currently, most investment institutions hold a pessimistic view on the future of USOIL. However, it is worth noting that the price has touched the support level of $61.5 five times in the past two weeks. Although it briefly broke below this level twice, it failed to effectively form a trending breakthrough. The principle that "if a support level can't be broken after repeated attempts, there will be a rebound" has been verified many times in similar situations, suggesting that there may be strong potential buying power at this support level.
Based on the above analysis, today's trading strategy is recommended to maintain a cautiously bearish tone, but it is necessary to closely guard against potential technical rebound risks. During the trading process, it is essential to set stop-loss levels strictly to avoid the expansion of losses due to sudden market movements. At the same time, it is advisable to reduce aggressive trading and mainly adopt a wait-and-see approach. Be patient and wait for clearer trend signals, and then choose the right time to enter the market when the market direction becomes more explicit.
USOIL
sell@62-62.5
tp:61-60.5
sl:62.8
In the future, we will continue to monitor the market changes and update the trading strategies in real time.
I am committed to sharing trading signals every day. Among them, real-time signals will be flexibly pushed according to market dynamics. All the signals sent out last week accurately matched the market trends, helping numerous traders achieve substantial profits. Regardless of your previous investment performance, I believe that with the support of my professional strategies and timely signals, I will surely be able to assist you in breaking through investment bottlenecks and achieving new breakthroughs in the trading field.
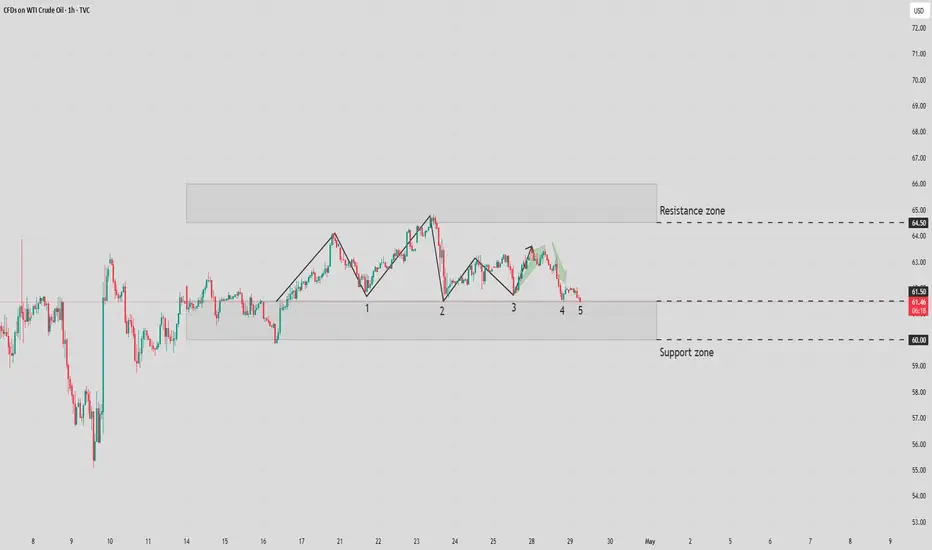
The price fluctuation range of USOIL is quite obvious.In the past two weeks, USOIL has been continuously fluctuating within the price range of $61.5 - $64.5. Its trend shows a pattern of rising first and then falling. During the upward phase, there was a slight lack of momentum, and subsequently, it entered a downward channel. This kind of fluctuation is not isolated but has complex underlying causes.
In terms of trading strategies, given that the current price fluctuation range is relatively clear, a strategy of selling high and buying low within the range of $61.5 - $64.5 can be considered. However, it should be noted that once the price breaks through the above-mentioned range, the strategy should be adjusted in a timely manner to follow the market trend, and one should be on guard against the risks brought about by a one-sided market.
USOIL
sell:63.5-64
tp:62.5-62
I am committed to sharing trading signals every day. Among them, real-time signals will be flexibly pushed according to market dynamics. All the signals sent out last week accurately matched the market trends, helping numerous traders achieve substantial profits. Regardless of your previous investment performance, I believe that with the support of my professional strategies and timely signals, I will surely be able to assist you in breaking through investment bottlenecks and achieving new breakthroughs in the trading field.