Usoiltrend

USOIL warned you about it 2 weeks agoHello everyone, as we all know the market action discounts everything :)
_________________________________Make sure to Like and Follow if you like the idea_________________________________
On August 5th I posted about a reversal in the USOIL market, and I've set different Scenarios on how the market is most likely to move.
Today we see the result of that analysis, everything I said would happen happened where the market went near the support levels and bounced back and then down again to breakout the support level and continue moving down.
Now let us talk about what is going to happen with the USOIL market, In the last 2 weeks the USOIL had a big bearish movement as the price dropped more than 14%,
it dropped from 73.36 and today it's trading around 62.99.
It's a big Bearish movement that we had clear signs that it was gonna happen from divergences, Support & Resistance levels, and Candlestick pattern.
in the next period of time we have 2 scenarios of how the market price could be moving :
Scenario 1 :
The market price is now trending near the Support zone from 62.62 - 61.56 by reaching that area we gonna witness a battle between the Bears and the Bulls over control over the market, If the Bears were able to hold control then the price will breakout that zone and will be now on its way to hit the support line at 60.45.
Scenario 2 :
The market price is trending near the Support zone from 62.62 - 61.56, The Bulls will have the chance to show power over the Bears, they will need to gain control over the market and make the price bounce back up, if the Bulls were able to do that then the price will bounce from that support zone and will be headed near the first resistance line at 64.75 where the bulls will have to test the Bears power for any hope to bring the price back up.
Technical indicators showing :
1) The market price is below the 5 10 20 50 100 MA and EMA but still above the 200 MA & EMA. That means that the Moving Averages are giving a strong sell signal.
2) Stoch reached the oversold zone, with a negative crossover between %K (3.90) and %D (4.88)
3) The MACD is under the zero line showing that the market is still in a Bearish state, with a negative crossover between the MACD line and the Signal line.
Support & Resistance points :
support Resistance
1) 62.62 1) 64.75
2) 61.56 2) 66.10
3) 60.45 3) 69.48
Fundamental point of view :
Oil prices steadied on Friday, clambering away from three-month lows, but they were still on track for a weekly loss of more than 5% as new lockdowns in countries facing surging cases of the COVID-19 Delta variant dampened the outlook for fuel demand.
Broader investor risk aversion also weighed on oil with the U.S. dollar jumping to a nine-month high on signs the U.S. Federal Reserve is considering reducing stimulus this year.
"The spread of the Delta variant amid moderating economic growth and the prospects of tighter monetary policy are creating short-term ripples in the commodity market," ANZ commodity analysts said in a note.
"Increasing restrictions on mobility are raising concerns for oil demand." According to Reuters
This is my personal opinion done with technical analysis of the market price and research online from fundamental analysts for The Fundamental point of view, not financial advice.
If you have any questions please ask and have a great day !!
Thank you for reading.

USOIL Daily analysis, Bearish Reversal possibilityHello everyone, as we all know the market action discounts everything :)
_________________________________Make sure to Like and Follow if you like the idea_________________________________
The WTI/USD is giving a lot of bearish signs for the next few days movement and has dropped from the 73.81 range and reached 68.16 yesterday, the price has crossed the support line at 70.36 and closed below it which turned that support line into a resistance line now, and that the price of the market is looking bearish for the time being.
A trade through 69.19 will signal a resumption of the downtrend. A move through 74.23 will change the main trend to up.
A 3 Black Crow pattern has appeared on the daily chart which usually indicates a bearish reversal.
So we might be seeing 2 Scenarios before this week ends :
Scenario 1 :
The price will drop even more and hit the support line at 66.15, and a battle will happen between the Bears and the Bulls and the Bulls will try to get that control back.
if the Bulls were able to get control over the market then we should be seeing the price bouncing back up to 70.36.
Scenario 2 :
Just like in scenario 1 the price will drop and hit 66.15, but the outcome here will be in favor of the bears and the bulls will not be able to gain control over the market until the price reaches another support line.
If the Bears were able to hold control then we could be seeing the price dropping even more and could be headed for the 61.68 range where the support line will be waiting to be tested.
Technical indicators confirming this bearish movement as we see that :
1) The market price is below the 5 10 20 and 50 MA and EMA (Bullish sign), but still above the 100 and 200 so for the long-term trend we could still see the market Bullish.
2) The MACD crossed the zero line showing the change of the market to a Bullish state, with a negative crossover between the MACD line and the signal line (sell signal)
3) The STOCH is in a Bearish state with a negative crossover between %K and %D, a divergence has been found between the Market price and the Indicator which could indicate a reversal
Support & Resistance points :
support Resistance
1) 69.27 1) 71.99
2) 67.97 2) 73.41
3) 66.55 3) 74.71
Fundamental point of view :
U.S. West Texas Intermediate crude oil futures are trading lower on Wednesday as growing concerns over potential demand destruction in the United States and China, due to the spread of the coronavirus Delta variant, offset potentially bullish geopolitical developments in the Middle East and another draw in domestic oil inventories.
According to the American Petroleum Institute (API), U.S. crude inventories fell by 879,000 barrels for the week ended July 30. Gasoline inventories fell by 5.8 million barrels and distillate stocks fell by 717,000 barrels, the data showed.
Official Energy Information Administration numbers are due later on Wednesday at 14:30 GMT. Traders are looking for a draw of 3.2 million barrels. According to FXEmpire
This is my personal opinion done with technical analysis of the market price and research online from fundamental analysts for The Fundamental point of view, not financial advice.
If you have any questions please ask and have a great day !!
Thank you for reading.

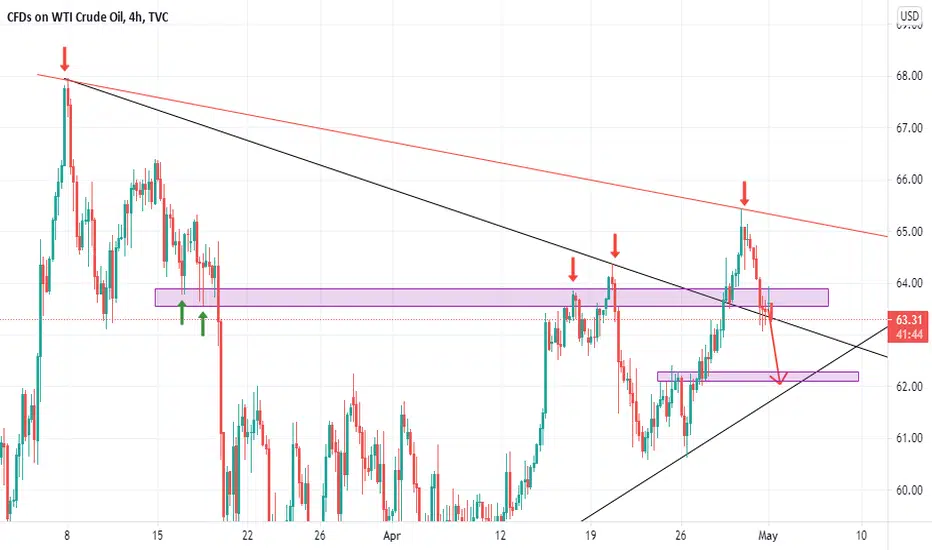
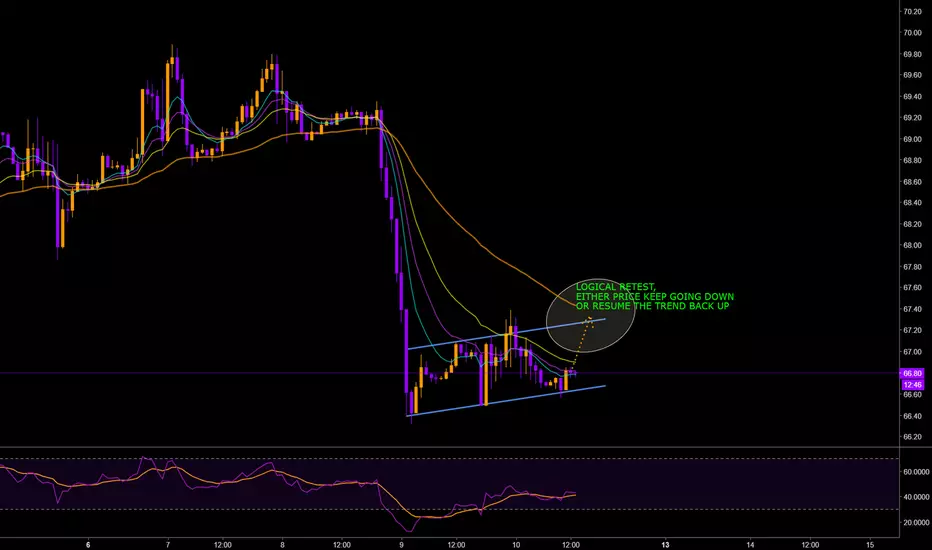
What i'd love to see on USOIL!Price broke my resistance trendline, turned it to a support then bought. Price is back to my trendline after creating successive lower highs and lowers lows. In confluence with that structure where price currently is on, my first bias is to short till otherwise. Probabilities lets see
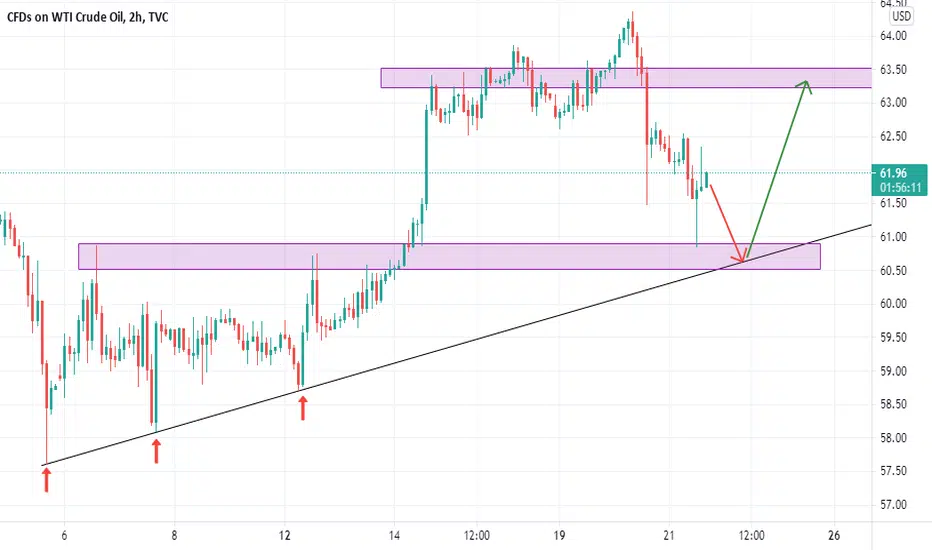
What i'd love to see on USOIL!Price is still a little bit far from my trendline, buh if/when it gets there i would love to first see this if my trendline holds. lets see
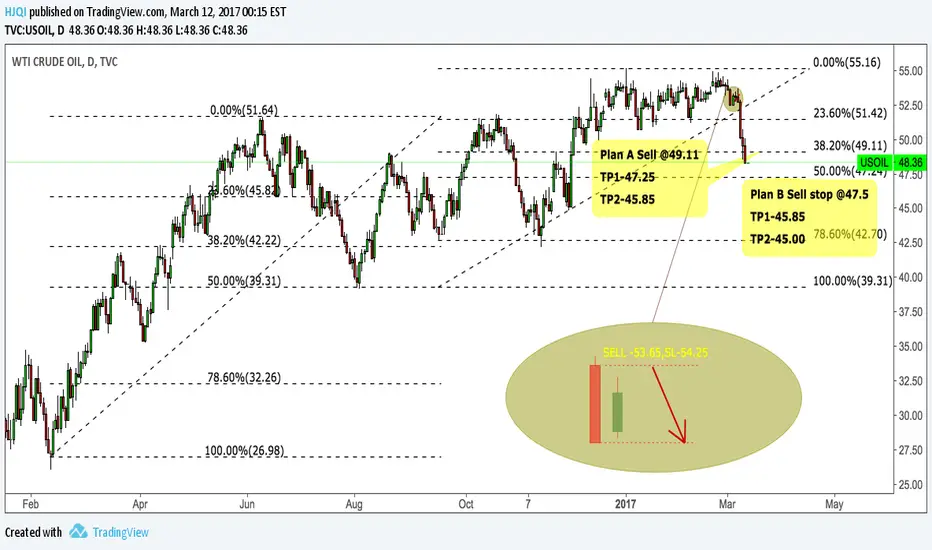
US OIL is now BearishThis has been very steadily grinding downwards and is now entering a Bearish environment again. I think this will reject off the lower trendline that it broke yesterday, it is just below this now. From here I have set 3 targets for TP that can either be held or swing traded. If this does reject the trendline mentioned the SL can be just above this. I do think this could drop even further as indicated by the Fibonacci at 0.382 ($46.19) but it is very risky to hold a short and expect it to reach there.

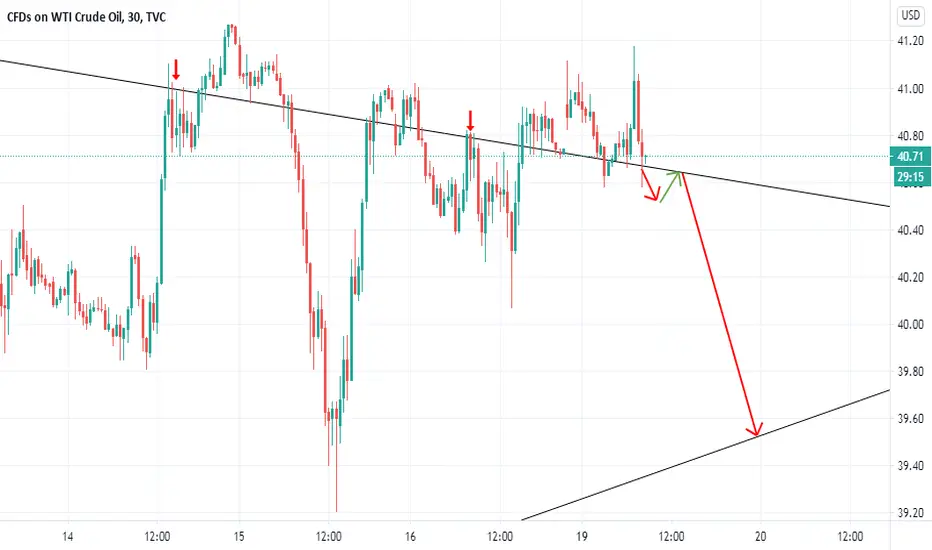
What I'd love to see on USOIL!Price has been failing to turn my broken trend line resistance to support to continue its rally. If price breaks and closes below my trend line, it might be signalling the return of the bears. lets see
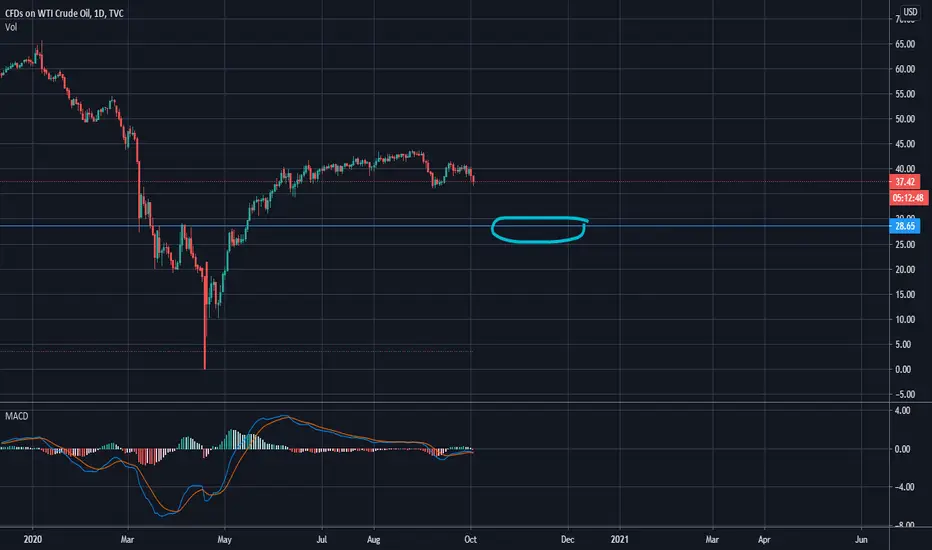
USOILIf countries over the world get a lockdown schools, there will be no bus drivings kids to school so my target area is @28$.
Of course, using risk management is a MUST.
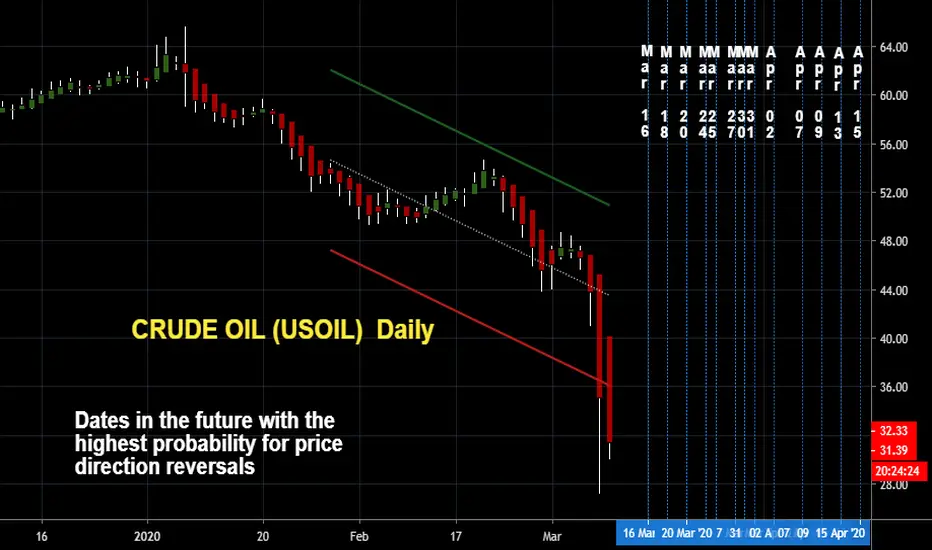
CRUDE OIL (USOIL) DailyDates in the future with the highest probability for price direction reversals
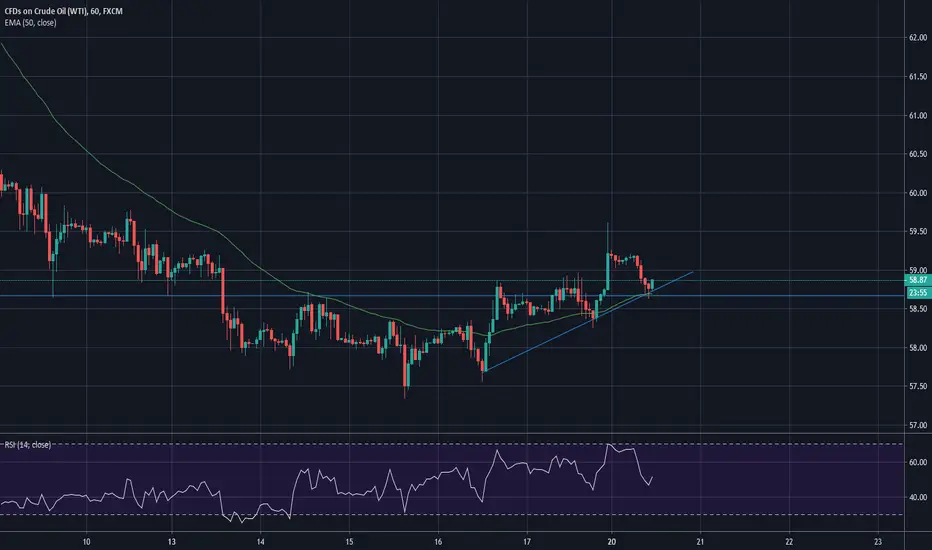
UOSIL ON FIREHi Traders;
Today I'm about to make huge profits from OIL.
On H1 we can see a start of an uptrend. I put my tp to 63.85.
Follow me for profits ;)
Benjamin
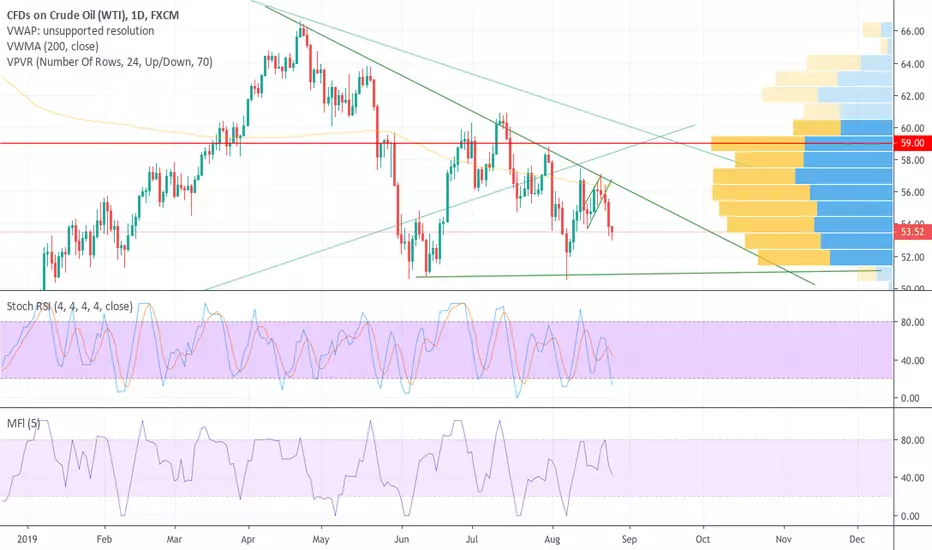
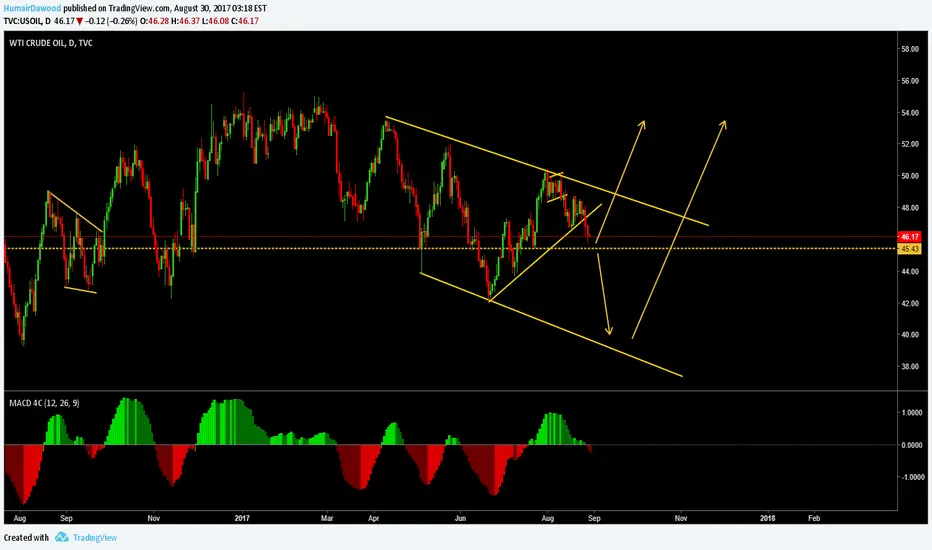
Trading USOIL this week - A look aheadFrom the chart we see that back in June USOIL broke out of the lower boundary on my original consolidation wedge. In mid-July it repeated and created a new bottom boundary which I marked. In early August it retested that boundary. It appears we still have further south to go to probably the mid $51 area and it will more than likely stay within the new wedge for consolidation. I see this pattern continuing into October, possibly November before we get a new directional change. Trade cautiously and always use Stop Losses. Best of luck my fellow oil traders!
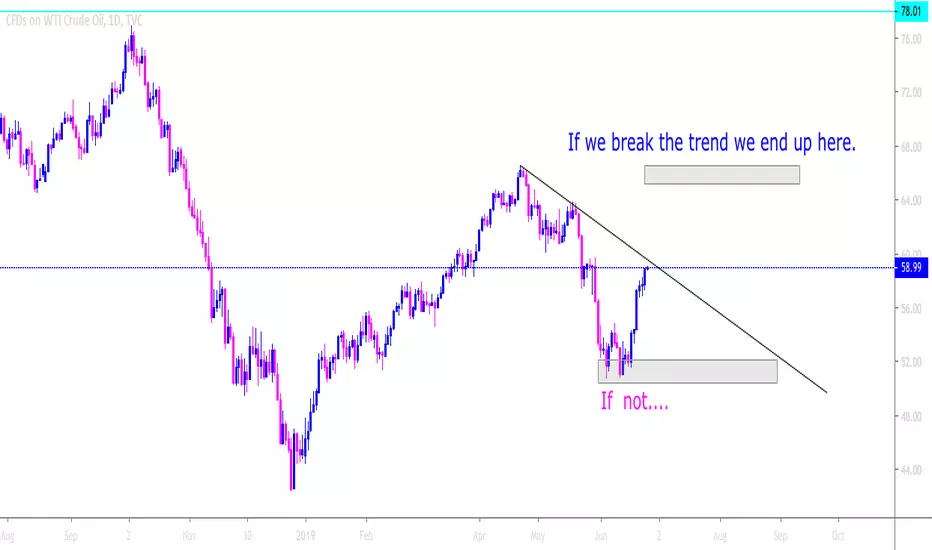
Can US OIL push up past resistance? (DAILY) USOIL has been on a great run, however we have approached a make or break point. Can OIL push past resistance or will we fall back down to our temporary safe zone highlighted?
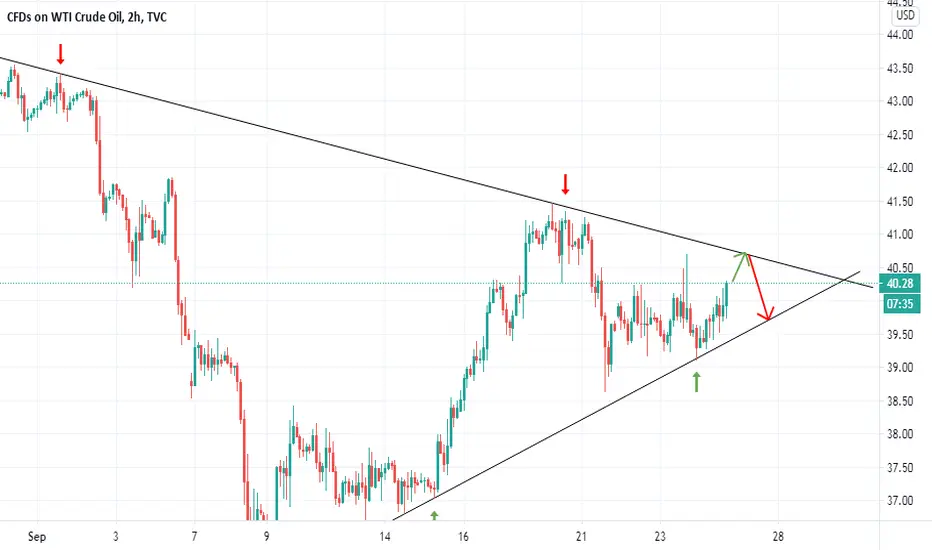
USOIL 4 hr Trend AnalysisWe are targeting the green trend line and looking for price action to break below the yellow support zone for confirmation. The condition to this strategy is that price action does not break above the red resistance zone. TVC:USOIL

Short USOThe chart of USO looks much overbought..
Buy Zone: $13.32 to $13.59
Stop loss: daily clsoe above $14
Target: $12.25 to $12.04
You can Buy DWT , SCO or any others that have Inverse relation with USO or USOIL

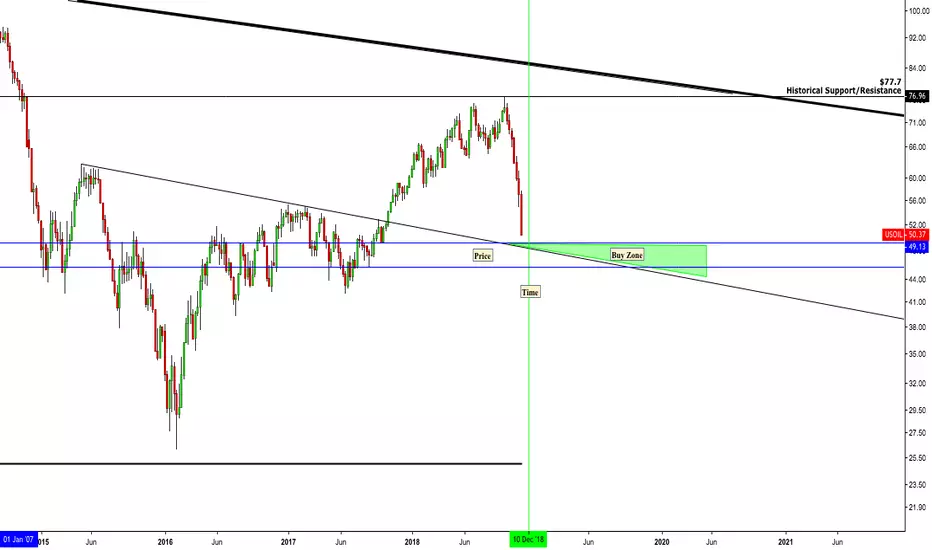
USOIL I Think We're Getting Close - Time & Price AnalysisMy best guess is the green highlighted area shouldn't be viewed as a "Bounce" zone.
Instead, I think this will be the area where accumulation will take place.
It'll take a few weeks and a few failed breakouts, so don't worry about missing the bottom. You'll have a few opportunities.
______________________________________________________________________________________________________________________________________
I've been working on "Time" more than "Price" for the last year. I got tired of pussy-footing around in my analysis; "It should bounce around this level, maybe it will maybe it won't."
Time is much more elusive than price, but I'll give it a go:
______________________________________________________________________________________________________________________________________
Price: Between $49.00 and $46.00 a sideways to slightly lower accumulation zone will form in this range. (Typically don't like to give such a wide range ($3) but we just moved $27 in 7 weeks so giving myself some wiggle room)
Time: From today (Nov 23rd) until Dec 15th, it's likely oil will be in accumulation as it moves sideways to slightly lower. By December 13th we should see some serious signs of a reversal. The reversal should last at a minimum until Jan 11th.
Prior Oil Posts:
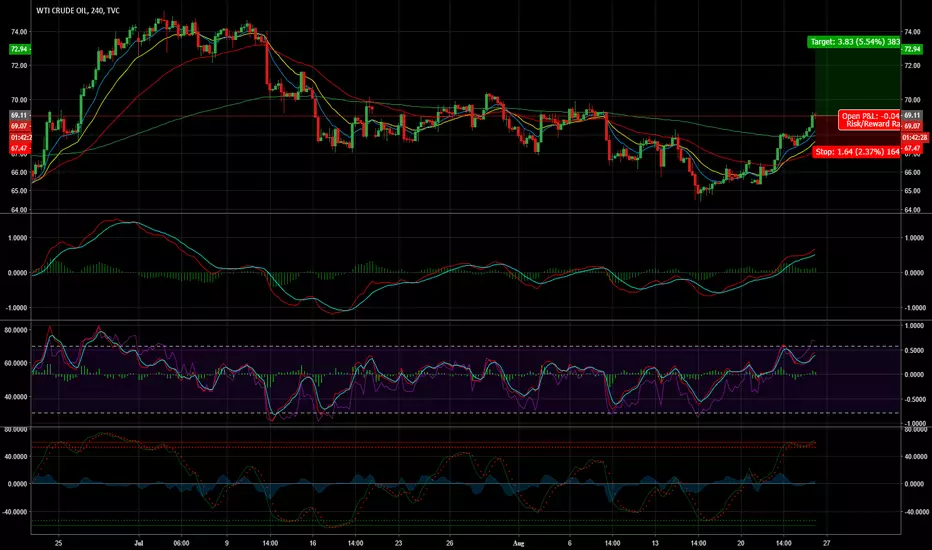
USOIL - 350 Pips + OpportunityUSOil has broken it's 200 ema on the 4 hour chart and prices jumped up.
If it does find support at current levels, we can expect USOil to rise even further anywhere till 73-74.
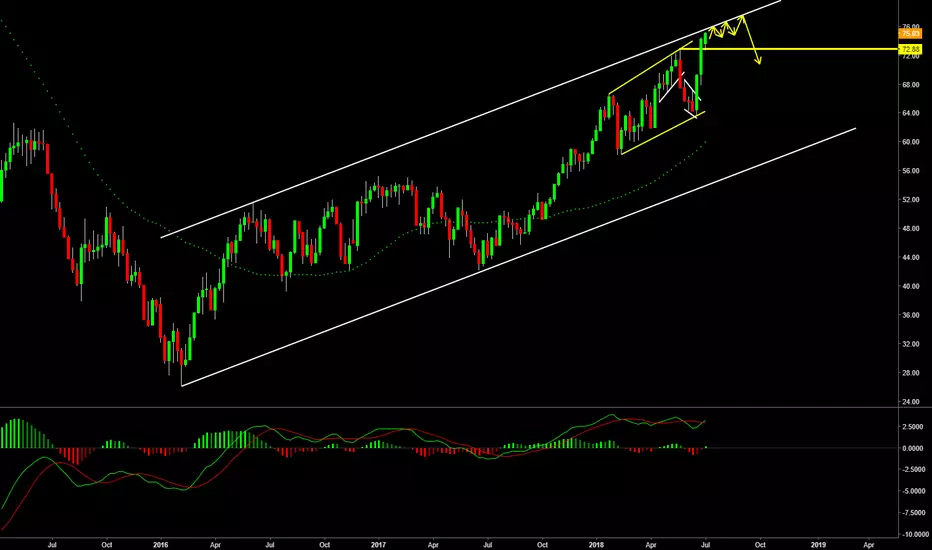
Crude Oil possible correction to setupMy last call on Crude smashed the target well above 1,000 pips, at the moment it is almost testing its multi months channel top, however trend still is very much strong, i am looking for a linear compression to be forming at the top of the channel. Expecting a correction there so I could look for sell setups, keep eyes on this market for a possible sell swing trade.
Happy Trading.
USOIL - Forecast-45.45 level is very important level.
-US-H.Harvey sliding it even lower.
Good luck!
USOil - Watchout for the break - 200 pips+ OpportunityUSOil is currently in a consolidation zone. Keep and eye on it for when it breaks out.
I am still neutral to whether it can go up or down. However, I do know that once it breaks out it will have a big move.
Always trade after your own analysis as well as money manage properly.
Happy trading!

USOIL Good to short againPair Direction Time frame Entry Price Reason Stop Loss TP-1 TP-2
USOIL Sell Limit 4H 53.3 Fibo-0.768,Pressure Level 53.80 51.80 50.10
USOIL Sell Limit 4H 53.8 Fibo-0.768,Pressure Level 54.40 51.80 50.10
USOIL Sell Stop 4H 52.7 Break Support Level 53.30 51.80 50.00

USOIL Still bearishHi traders!I hold a point:Good charts does not need more words to explain! Good luck!