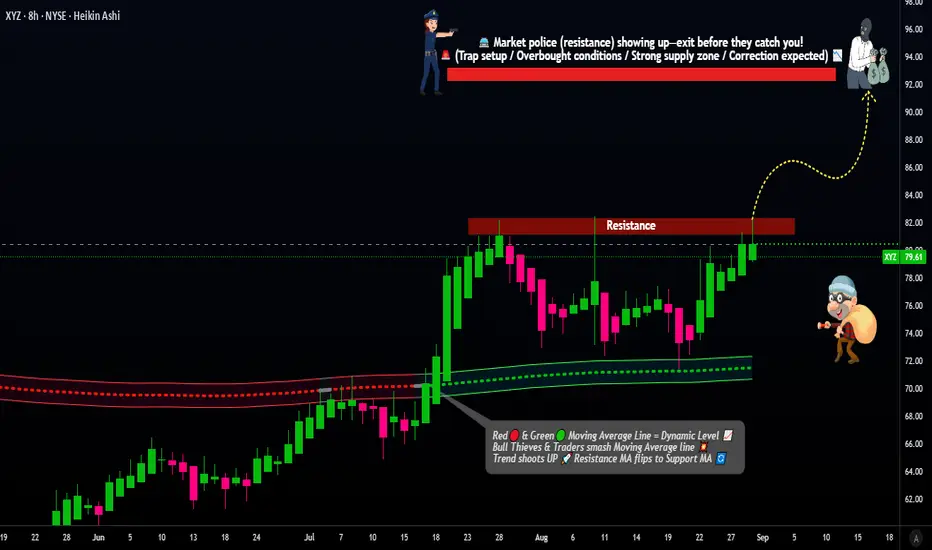
XYZ Bullish Setup: Pending Entry & Target Strategy!📌 Asset & Plan
XYZ (Block, Inc.) NYSE | Swing/Day Trade
Plan: Bullish 💹 (Pending Order Setup)
Breakout Entry: Near $83.00 ⚡ (Set alerts to catch the breakout!)
🧩 Thief-Style Layer Strategy
Multiple limit layer entries after breakout: $82.00 / $80.00 / $78.00
Scale your positions according to your risk appetite and strategy 📈
Stop Loss: $74.00 (adjust as per your risk) ⚠️
Target: $92.00 🏁
📊 Real-Time Market Snapshot (Sep 1, 2025)
Current Price: $79.64
52-Week Range: $46.53 - $98.92
🧠 Investor Sentiment
Retail: Moderately Bullish (60% Greed) 🟢
Institutional: Cautiously Optimistic (55% Greed) 🟡
Fear & Greed Index: Neutral → Greed (58/100) 📊
💹 Fundamental & Macro Highlights
Fundamentals (6.5/10) ✅
Undervalued by ~29% (Intrinsic Value: $111.64)
EPS Growth (2026 Est.): +39.49% YoY
Revenue Growth (2025 Est.): +2.92% YoY
Strong solvency & healthy gross margins
Macro Environment (6/10) 🌍
Market Volatility: Low
Safe Haven Demand: Moderate
Interest Rates: Stable (Fed rate cuts expected late 2025)
🐂 Overall Market Outlook
Bullish Score: 65% 🟢 (S&P 500 inclusion & strong analyst targets)
Bearish Risks: 35% 🔴 (slowing revenue growth & competition pressures)
💡 Bottom Line
XYZ is undervalued with moderate bullish sentiment. Use layered entries to optimize risk/reward, set alerts for breakout, and monitor macro factors. 🚀
#NYSE #StockTrading #SwingTrade #DayTrade #BullishSetup #BreakoutAlert #LayerStrategy #XYZStock #TechnicalAnalysis #MarketInsights #TradingIdeas
Usstockmarket
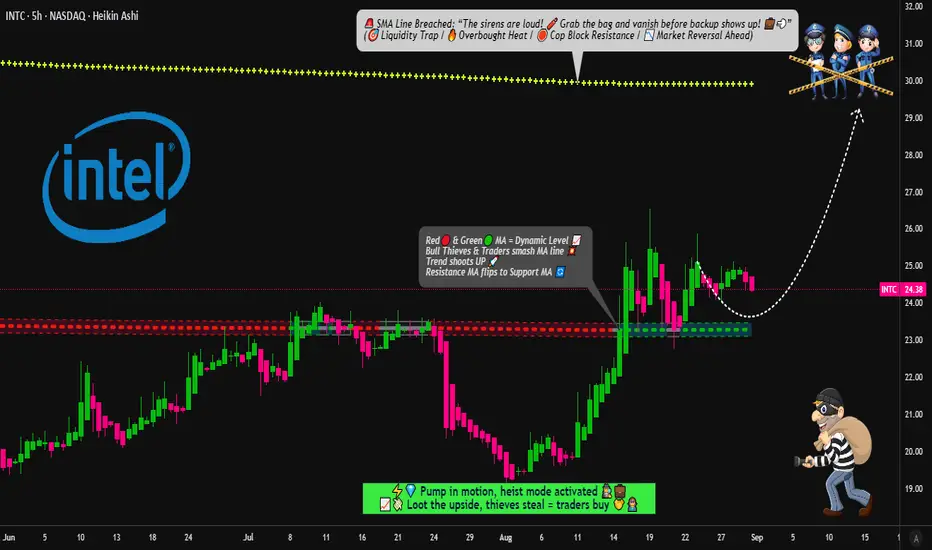
INTEL Heist Playbook: Buy the Dips, Escape Before the Sirens🔓💻 INTEL CORPORATION "Chip Heist" Stock Raid 💻🔓
🎯 Plan: Bullish Robbery | Targeting $30.00 | Stop Loss: $21.00
💰 Layered Limit Entries | Silicon Valley Loot | Calculated Takedown
🚨⚠️ Attention TRADERS, Tech Pirates & Market Mercenaries! ⚠️🚨
The INTC data vault is cracked, and the Thief Trader squad is executing a multi-layer LIMIT ENTRY HEIST – stacking shares like we're loading the getaway van. 🚐💾⚡
👀 We ain't chasing price – we're ambushing it with precision. Every discount? A planned acquisition.
💥 ENTRY: Any Price Level is a Gift 💥
"Bullish on Silicon" – we're collecting shares on any dip into value town!
Deploy buy limits at key psychological support layers: $25.00, $24.00, $23.00 (Add more layers based on your own capital).
Thief-style: We don't buy the hype; we steal the undervalued chips.
🛑 STOP LOSS: This is a Thief SL @ $21.00 🔐
Dear Ladies & Gentleman (Thief OG's), this is set at the breakdown panic zone – where the weak hands get shaken out.
Adjust your final SL based on your own risk appetite and strategy. Size wisely.
🎯 TARGET: $30.00 💸
The police barricade is there, so kindly escape with your stolen money before arrival.
We're targeting the next major resistance vault. Take profits and live to trade another day.
🧠 Swing Traders? Load the boat. Day Traders? Snatch the quick flips. Investors? Stack and hold. 💵☕
Use a trailing stop loss to protect your capital as the trend accelerates.
🕵️♂️ THIEF TRADER INSIGHTS:
📊 Backed by tech sector momentum, oversold bounces, and order block analysis.
🗞️ Earnings? Chip news? = increased volatility = adjust your layers accordingly.
⚠️ HEIST PROTOCOL:
✅ Avoid over-leveraging – this is a layering strategy, not a casino bet. 📉
✅ Use risk-adjusted position sizing on every limit order.
✅ Discipline is key. The market will deliver the discounts; you just need to be patient.
❤️🔥 Hit that 💥 LIKE & FOLLOW 💥 if you're riding with the Thief Squad!
Support the strategy. Respect the plan. Stack your gains like a true Market Outlaw.
🔔 Follow for the next HEIST. Big bags only. 💼🚀📈
“The market is a river of money—flowing from the impatient to the patient.” – Thief Trader
#INTC #Intel #StocksToWatch #TradingPlan #SwingTrading #StockMarket #Investing #LayeredEntries #ThiefTrader #ChipHeist
Invest in STRL: Ride the Coming US Digital Infrastructure Surge◉ Abstract
Sterling Infrastructure (NASDAQ: STRL) is a top pick to benefit from America's digital infrastructure boom, with the sector expected to grow 26% annually through 2034. The company specializes in data centers, 5G networks, and smart city projects, supported by a $1 billion backlog and improving profit margins. While risks like regional market shifts and housing demand exist, STRL's fundamentals are strong—revenue grew 7% in 2024, debt is manageable, and its P/E ratio (17.9x) looks cheap compared to peers (70.5x).
Technically, the stock shows bullish patterns after pulling back 35% from highs. With government infrastructure spending rising and strategic acquisitions likely, STRL could deliver 35-40% returns in the next 12-14 months. A good option for long term investing!
Read full analysis here...
◉ Introduction
The U.S. digital infrastructure market, valued at approximately USD 140 billion in 2024, is expanding rapidly, with a projected CAGR of 26.4% through 2034. This growth is driven by factors like the expansion of 5G networks, increased demand for data centers, rising cloud services adoption, AI automation, and investments in smart cities and edge computing. The 5G infrastructure segment alone is expected to grow at a CAGR of 20.2%, reaching USD 17.26 billion by 2030. North America holds a 42.8% share of the global market.
◉ Key Trends and Opportunities
1. Data Centers: Demand continues to rise, driven by cloud computing, AI, and data-intensive applications. Power availability and location are becoming critical, with providers moving to secondary markets to secure reliable energy sources.
2. Fiber Networks: Expansion is underway to support new data centers and remote connectivity needs. Middle-mile and long-haul fiber, as well as fiber-to-the-home (FTTH), are key areas of investment and consolidation.
3. 5G and Wireless: Ongoing rollout of 5G networks is fueling growth in hardware and network densification, with increased activity expected in wireless infrastructure and tower markets.
4. Edge Computing and Smart Cities: The proliferation of IoT devices and smart city initiatives is driving demand for edge data centers and low-latency networks.
5. Mergers and Acquisitions: The market is seeing consolidation, especially in fiber and data center segments, as major players acquire smaller firms to expand their footprint and capabilities.
Today, we’ll focus on Sterling Infrastructure (STRL), a key player navigating the U.S. infrastructure market.
This report provides a detailed look at STRL's technical and fundamental performance.
◉ Company Overview
Sterling Infrastructure Inc. NASDAQ:STRL is a U.S.-based company specializing in e-infrastructure, transportation, and building solutions. It operates through three key segments: E-Infrastructure Solutions, which focuses on site development for data centers, e-commerce warehouses, and industrial facilities; Transportation Solutions, handling infrastructure projects such as highways, bridges, airports, and rail systems for government agencies; and Building Solutions, providing concrete foundations and construction services for residential and commercial projects. Originally founded in 1955 as Sterling Construction Company, the firm rebranded to its current name in June 2022. Headquartered in The Woodlands, Texas, the company serves a wide range of sectors, including logistics, manufacturing, and public infrastructure.
◉ Investment Advice
💡 Buy Sterling Infrastructure NASDAQ:STRL
● Buy Range - 148 - 150
● Sell Target - 200 - 205
● Potential Return - 35% - 40%
● Approx Holding Period - 12-14 months
◉ SWOT Analysis
● Strengths
1. Strong E-Infrastructure Backlog – With over $1 billion in backlog, Sterling has a robust pipeline of future projects, ensuring sustained revenue growth.
2. Higher-Margin Services Shift – The company’s strategic focus on higher-margin work (21% gross profit margin in Q4) improves profitability without relying solely on volume.
3. E-Infrastructure Growth Potential – Expected 10%+ revenue growth and 25%+ operating profit growth in 2025 position Sterling for strong earnings expansion.
4. Strategic M&A Opportunities – Strong liquidity allows for accretive acquisitions, enhancing market share and service offerings.
5. Share Repurchase Program – Active buybacks reduce outstanding shares, potentially boosting EPS and shareholder value.
● Weaknesses
1. Texas Market Transition Risks – Moving away from low-bid work in Texas may slow revenue growth in the Transportation segment if not managed well.
2. Revenue Loss from RHB Deconsolidation – Excluding $236 million in RHB revenue could distort growth metrics and reduce reported earnings.
3. Residential Market Pressures – A 14% decline in residential slab revenue (due to DFW affordability issues) could persist if housing demand weakens further.
4. Geographic Expansion Challenges – High costs and logistical hurdles in expanding data center projects outside core regions may limit growth opportunities.
5. Competitive Bidding & Acquisition Risks – Difficulty in securing profitable acquisitions or winning competitive bids could hinder margin and revenue growth.
● Opportunities
1. Data Center & E-Commerce Boom – Rising demand for data centers and distribution facilities presents long-term growth potential for E-Infrastructure.
2. Government Infrastructure Spending – Federal and state investments in highways, bridges, and airports could boost Transportation Solutions revenue.
3. Strategic Acquisitions – Pursuing complementary M&A deals could expand capabilities and market reach.
4. Diversification into New Regions – Expanding into underserved markets could reduce dependency on Texas and mitigate regional risks.
5. Operational Efficiency Improvements – Further margin expansion through cost optimization and technology adoption.
● Threats
1. Economic Slowdown Impact – A recession could reduce demand for residential and commercial construction, affecting Building Solutions.
2. Rising Interest Rates – Higher borrowing costs may pressure profitability and delay large-scale projects.
3. Labor & Material Cost Inflation – Increasing wages and supply chain disruptions could squeeze margins.
4. Intense Competition – Rival firms competing for the same infrastructure projects may drive down pricing and profitability.
5. Regulatory & Permitting Delays – Government approvals and environmental regulations could slow project execution.
◉ Revenue & Profit Analysis
● Year-on-Year
➖ FY24 sales reached $2,116 million, reflecting a 7.28% increase compared to $1,972 million in FY23.
➖ EBITDA rose to $334 million, up from $264 million in FY23.
➖ EBITDA margin improved to 15.8%, up from 13.4% in the same period last year.
● Quarter-on-Quarter
➖ Q4 sales decreased to $499 million, down from $593 million in Q3, but showed a slight increase from $486 million in Q4 of the previous year.
➖ Q4 EBITDA was $80.3 million, down from $105 million in Q3.
➖ Q4 diluted EPS saw a notable rise, reaching $8.27 (LTM), up from $5.89 (LTM) in Q3 2024.
◉ Valuation
1. P/E Ratio (Price-to-Earnings)
● Current vs. Peer Average
➖ STRL’s P/E ratio is 17.9x, much lower than the peer average of 70.5x, suggesting the stock is undervalued compared to peers.
● Current vs. Industry Average
➖ Compared to the broader industry average of 22.9x, STRL again looks relatively inexpensive at 17.9x.
2. P/B Ratio (Price-to-Book)
● Current vs. Peer Average
➖ STRL’s P/B ratio stands at 5.7x, slightly higher than the peer average of 5x, indicating overvaluation.
● Current vs. Industry Average
➖ Against the industry average of 3.6x, STRL’s 5.7x P/B ratio suggests a noticeable overvaluation.
3. PEG Ratio (Price/Earnings to Growth)
➖ STRL’s PEG ratio is 0.21, which means the stock appears undervalued relative to its strong expected earnings growth.
◉ Cash Flow Analysis
➖ Sterling Infrastructure's operating cash flow grew to $497 million in FY24, up from $479 million in FY23, showing steady financial strength.
◉ Debt Analysis
➖ The company's debt-to-equity ratio is 0.38, indicating a healthy balance sheet with manageable debt levels.
◉ Top Shareholders
➖ The Vanguard Group has significantly increased its investment in this stock, now owning an impressive 8.3% stake, which marks a 30% rise since the end of the September quarter.
➖ Meanwhile, Blackrock holds a stake of around 8% in the company.
◉ Technical Aspects
➖ On the monthly chart, the stock remains in a strong uptrend.
➖ On the daily chart, an Inverted Head & Shoulders pattern has formed, signaling a potential breakout soon.
➖ The stock is currently trading at about 35% below its all-time high, making it an attractive investment opportunity.
◉ Conclusion
Sterling Infrastructure (STRL) stands out as a strong investment candidate, backed by solid financial performance, a growing E-Infrastructure backlog, and a strategic focus on higher-margin projects. Its attractive valuation, healthy cash flow, and low debt levels provide further confidence in its growth potential. While there are challenges—such as market competition, geographic expansion hurdles, and economic uncertainties—Sterling’s strengths, including a robust project pipeline, strategic acquisitions, and exposure to high-growth sectors like data centers and 5G infrastructure, offer a favorable risk-reward balance. Overall, Sterling is well-positioned to benefit from the ongoing U.S. e-infrastructure boom, making it an attractive long-term investment opportunity.

Atour: The Smart Way to Invest in China's Hospitality Market◉ Abstract
Atour Lifestyle Holdings Limited is taking advantage of China's fast-growing hotel industry. The hospitality sector of China is expected to reach $157.46 billion by 2032, growing at a rate of 8.23% each year. This growth comes from a strong economy, more people moving to cities, and an increase in travel. Atour uses a smart business model that allows for quick expansion while keeping costs low. They offer a variety of hotel brands and even sell sleep-related products.
In FY23, Atour's sales jumped to $657.4 million, a 106% increase from the previous year, along with strong earnings growth. With over 83 million members in its loyalty program and a focus on great customer experiences, Atour is set for continued success in China's hospitality market.
Overview of the Hotel Service Industry in China.
Continue reading full article here:
◉ Overview of the Hotel Service Industry in China
China's hotel service industry is on the cusp of a remarkable growth spurt, fueled by the country's soaring economy, rapid urbanization, and an unprecedented surge in domestic and foreign travel.
● Projected Market Value: $157.46 billion by 2032
● Growth Rate: 8.23% Compound Annual Growth Rate (CAGR) from 2024 to 2032
◉ What's Driving this Growth?
● Economic Growth: China's economy continues to expand, boosting disposable incomes and travel budgets.
● Urbanization: As more Chinese citizens move to cities, they're seeking better travel experiences and accommodations.
● Increased Travel: Both domestic and foreign travel are on the rise, driving demand for hotels and travel services.
As China's hotel service industry experiences rapid growth, Atour Lifestyle Holdings NASDAQ:ATAT Company has established itself as a prominent force in the market. By delivering a unique blend of comfort, style, and local charm, Atour is redefining the hospitality landscape in China.
Atour's strategic focus on mid-to-upscale hotels enables the company to provide immersive local experiences, innovative design, and exceptional service. This distinctive approach has fostered a loyal customer base and positioned Atour for continued success in China's burgeoning hotel market.
◉ Investment Advice
💡 Buy Atour Lifestyle Holdings NASDAQ:ATAT
● Buy Range - 27 - 27.5
● Sell Target - 36 - 37
● Potential Return - 30% - 35%
● Approx Holding Period - 12-14 months
◉ Business Model
Atour Lifestyle Holdings Limited utilizes an asset-light, franchise-oriented business model that enables rapid expansion and operational efficiency in China's hotel industry. Here are the key components:
● Manachised Model: Atour primarily operates through a "manachised" model, where franchisees handle capital expenditures and hotel leases while Atour provides management and training. This approach minimizes operational costs and maximizes revenue from franchise royalties.
● Diverse Brand Portfolio: The company offers various hotel brands, including Atour, Atour S, Atour X, and ZHOTEL, catering to different market segments and customer preferences.
● Retail Integration: Atour has expanded into retail by selling sleep-related products, generating significant revenue and enhancing the guest experience.
● Customer Loyalty Programs: The A-CARD loyalty program boasts over 63 million members, driving customer retention and engagement through various benefits.
● Digital Capabilities: Atour leverages technology for a seamless customer experience, allowing easy online bookings and efficient communication during stays.
● Focus on Experience: The company emphasizes delivering unique lifestyle experiences through thematic hotels and tailored offerings.
◉ Key Competitors
1. Huazhu Group (H World Group): A leading competitor with over 10,150 hotels, Huazhu operates a similar manachised model and has been expanding rapidly, making it one of the largest players in the market.
2. Jin Jiang International: With a vast portfolio exceeding 12,000 hotels, Jin Jiang is another major competitor that employs a mix of franchising and management strategies.
3. GreenTree Hospitality Group: Focused on midscale accommodations, GreenTree operates around 3,000 hotels and utilizes a franchise-based model with manachised elements.
4. BTG Homeinns Hotels: Known for its budget offerings, BTG Homeinns has a significant presence with thousands of hotels primarily targeting domestic travelers.
5. Plateno Group (7 Days Inn): Operating primarily in the budget segment, Plateno utilizes a manachised approach to grow its network of over 3,000 hotels.
These companies dominate the domestic market, while international brands like InterContinental Hotels Group (IHG) and Shangri-La Hotels & Resorts lead the high-end segment.
◉ Strategic Initiatives Powering Atour's Growth Trajectory
● Expanded Hotel Network: 140 new hotels added in Q3 and 732 under development, increasing capacity and driving revenue growth.
● Upscale Brand Introduction: SAVHE Hotel launch in core business districts, enhancing occupancy and average daily rate (ADR).
● Retail Segment Growth: 107.7% year-over-year GMV growth in 'deep sleep' products, boosting revenue and net margins.
● Membership Base Expansion: Over 83 million members, increasing revenue potential through customer loyalty and repeated business.
◉ Revenue & Profit Analysis
● Year-on-year
➖ FY23 sales reached $657.4 million, a remarkable 106% increase from $328 million in FY22.
➖ EBITDA surged to $142 million, up from $36 million in FY22.
➖ The EBITDA margin widened to 21.6% from 11.15% in the same period.
● Quarter-on-quarter
➖ Q3 sales reached $270 million, a 9% increase from $247 million in Q2 and a 52% jump from $177 million in Q3 2023.
➖ Q3 EBITDA climbed to $72.6 million, up from $56.2 million in Q2.
➖ Q3 diluted EPS rose to $0.39 (LTM) from $0.30 (LTM) in Q2 2024.
◉ Valuation
● P/E Ratio
ATAT has a P/E ratio of 24x, which is fairly valued when compared to the peer average of 23.7x.
● PEG Ratio
With a PEG ratio of just 0.15, ATAT appears to be undervalued based on its anticipated earnings growth.
◉ Profitability Analysis
With a 30.7% ROCE, ATAT demonstrates its expertise in generating substantial profits through efficient capital allocation.
◉ Cash Flow Analysis
ATAT achieves remarkable growth in operational cash flow, rising 582% to $280 million in FY23 from $41 million in FY22.
◉ Debt Analysis
ATAT's debt-to-equity ratio stands at 0.67, signaling that debt is not a significant concern for the company.
◉ Top Shareholders
➖ Mr. Haijun Wang, CEO of Atour Lifestyle Holdings, holds a significant 19.2% stake.
➖ Trip.com Group Limited holds approximately 13.6% stake.
◉ Technical Aspects
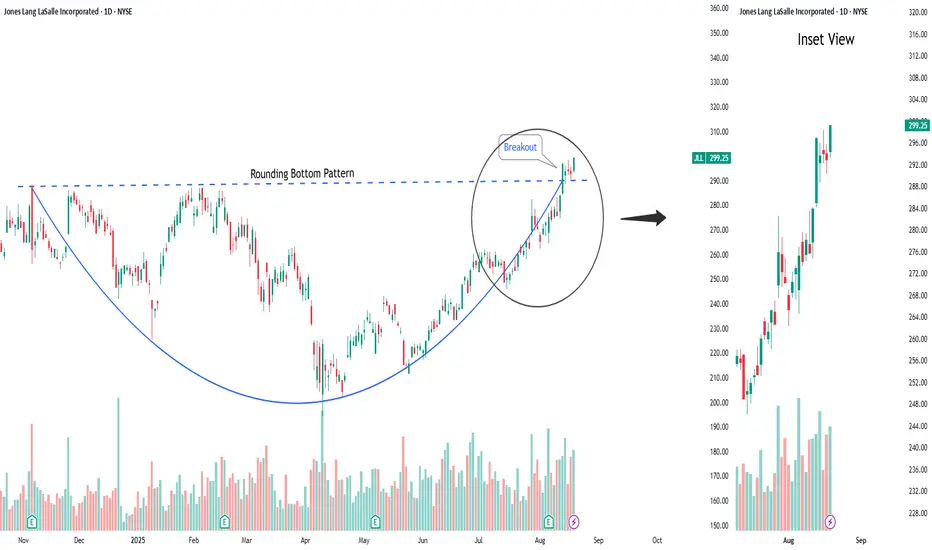
➖ The weekly chart indicates that after a long period of consolidation, the stock price has formed a Rounding Bottom Pattern and is likely to break through its strong resistance zone soon.
➖ A Pole & Flag pattern has formed on the daily chart, with the stock price targeting higher levels following a successful breakout.
◉ Conclusion
Following a thorough analysis, we believe Atour presents a lucrative investment opportunity. With its appealing valuation, impressive financial track record, and strategic growth initiatives, Atour is well-positioned to capitalize on the growing tourism sector. The company's commitment to delivering exceptional customer experiences further strengthens its potential for long-term growth and value creation for shareholders.

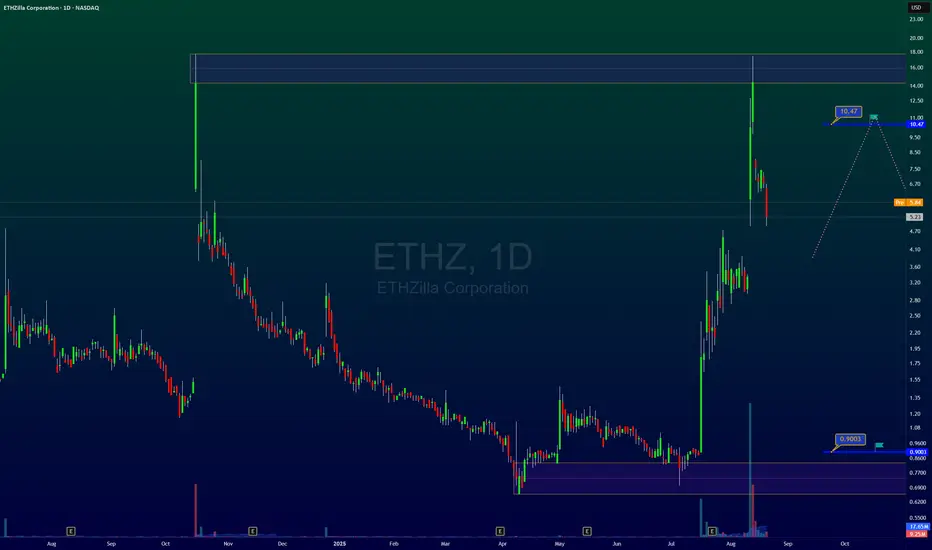
ETHZ and time to save 1900% profitAfter the excellent 19-fold growth in the company's shares and the correction, if you do not exit, it will return to the specified ceiling range, and this time you will have a very good opportunity to save profits and exit, or enter a short position and re-enter at the bottom range and this time buy 19 times more shares.
Stay with me and be profitable
Do you have any questions? Ask me in the comments
Don't forget to introduce me to your friends so that we can all profit together?
What do you have in mind that I should analyze for you? Comment for me.
Buy EcolabShort Term Trading Advice by Naranj Capital
Buy Ecolab
● Buy Range- 282 - 285
● Target- 295 - 300
● StopLoss- Below 276
● Potential Return- 4-5%
● Duration- 12-14 Trading Days

Buy Jones Lang LaSalleShort Term Trading Advice by Naranj Capital
Buy Jones Lang LaSalle
● Buy Range- 297 - 300
● Target- 312 - 316
● StopLoss- Below 285
● Potential Return- 4-5%
● Duration- 14-15 Trading Days
Potential inverse head and shoulders on NASDAQ (CASH100) - 15minI’m watching the Cash100 for a potential long setup.
On the 15min chart, an inverse head and shoulders pattern appears to be forming — potentially a continuation pattern following this week’s strong upward move.
I’m still waiting for confirmation of key variables, which will be assessed at 11:30am (GMT+1).
Trade Details:
📊 Risk/Reward: 2.4
🎯 Entry: 23 845
🛑 Stop Loss: 23 825
💰 Take Profit 1 (50%): 23 891
💰 Take Profit 2 (50%): 23 912
#GTradingMethod Tip: Lower volume on the right shoulder vs. the left shoulder strengthens the setup.
Please note: This is not financial advice. This content is to track my trading journey and for educational purposes only.

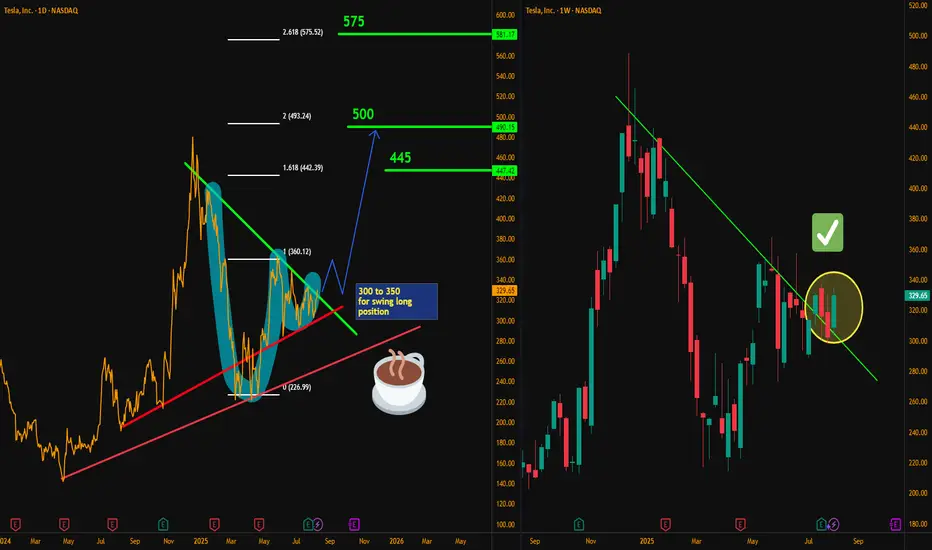
Tesla Roadmap: From $300 Zone to $575Hello traders, here’s my latest analysis on Tesla (TSLA) based on the weekly and daily timeframes. On the weekly chart, I have drawn a downtrend line starting from December 2024, and the recent price action shows a breakout above this line on a weekly close. This breakout is a promising sign that an uptrend may be developing in the medium term.
On the daily chart, we can see a cup & handle pattern forming, which is a bullish continuation structure. However, the daily downtrend drawn from the December 2024 highs remains unbroken, so I will need to see a weekly close above the $332 resistance level to confirm a swing long setup.
My preferred positioning zone for longs is between $300 and $350, using a multi-entry approach to average into the trade. My upside targets are $366, $445, $500, and finally $575. These levels align with inverse Fibonacci projections, with “safety 1” at $360 and “0” at $227, pointing toward the 161, 200, and 261 extensions as key objectives.
For stop-loss placement, patient traders who are willing to hold through volatility may consider a weekly close below $265 as their invalidation point. For faster or more short-term oriented traders, a weekly close below $300 could be used as a tighter stop level. Although I believe it is unlikely for price to drop this far, even if it does, I expect strong buying interest and a potential rebound from the $265 support zone.
Risk management remains crucial for this setup. I recommend not risking more than 10% of your capital, scaling in over multiple entries, and always confirming with your own strategy before committing to the trade. Position sizing and discipline will be key to managing volatility and protecting capital.
NASDAQ:TSLA
Market Mood Sours as Inflation Surprises AgainU.S. stock markets were under pressure on Tuesday after new inflation data came in higher than expected. This has made investors rethink how soon the Federal Reserve might cut interest rates.
What Happened?
● The Consumer Price Index (CPI) recorded its biggest monthly rise in 5 months.
● Core inflation (which excludes food and energy) jumped by 2.9% compared to last year — more than the Fed's 2% target.
What It Means
● Investors had expected the Fed to cut interest rates multiple times in 2025.
● After the inflation report, they now think the Fed will cut less than expected.
● The chances of a rate cut in September also dropped sharply.
Market Impact
● Bond yields went up — the 10-year U.S. government bond yield rose to 4.49%, making borrowing more expensive.
● Stock futures fell (Dow, S&P 500, Nasdaq), as higher yields tend to hurt company profits and stock prices.
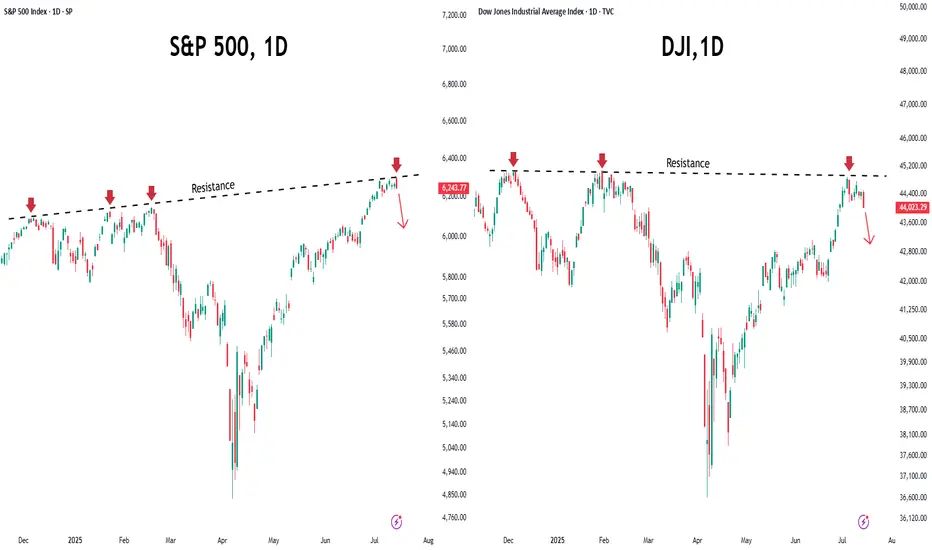
S&P 500 and Dow Struggle at Resistance
● Both the S&P 500 and Dow Jones faced resistance near all-time highs.
● This rejection suggests potential for further short-term pullback, especially if macro pressures like inflation and rate uncertainty persist.
Near-Term Outlook
With inflation running hotter than expected, hopes for early Fed rate cuts have cooled. Traders and investors should remain cautious, manage risk actively, and prepare for continued volatility in the coming weeks.
SPX 500 to 17,000 in 7 years.This chart represents the S&P 500, showcasing its performance over time, including quarterly data.
It captures everything.
Every recession.
Every war.
Every president.
Every variation of the monetary base as superpowers rise and fall.
Whenever I hear a bear in the stock market declare that THE TOP has been reached, and we are about to CRASH -50% to -90%
I find myself drawn to these comprehensive long term charts.
If the bulls are genuinely in control and we have merely undergone an intermediate-term correction, then the long-term bull market that commenced at the 2009 low remains robust, with many more years ahead.
The chart also illustrates that the three significant bull market phases typically last around 18-20 years following a major breakout.
And they yield a comparable number of X's.
It's all quite fascinating, if you ask me.
See you in the future!

US2000 Indices Heist: Steal the Market’s Hidden Profits! **🚨 Attention, market bandits & profit thieves!** 🏴☠️💸
The **US2000 Indices** are ripe for the taking—here’s your **Thief Trading Plan** to loot the charts like a pro! 🕵️♂️📉📈
This strategy blends **killer technicals** with **smart fundamentals** to lock in gains. Ride the bullish wave 🚀 but stay alert—the **Red Zone** is where overbought traps lurk, and bears might ambush! 🐻 Secure your profits before the market turns!
---
**🔑 Entry Signals: Strike Like a Thief!**
- **Bullish Ambush (Long)**: Enter on pullbacks near **Pullback Zone 1 (2060.00)** or **Pullback Zone 2 (1980.00)**. 🎯
- **Bearish Blitz (Short)**: Jump in if price breaks **below 2040.00**—ride the drop! 📉
- **Set an alert!** 🔔 Catch breakouts in real-time.
---
**🛑 Stop Loss Tricks: Protect Your Loot!**
- **Buy Stops**: Confirm breakout first! Place stops at **1980.00 (Zone 1)** or **1910.00 (Zone 2)**.
- **Adjust based on risk & lot size—stay sharp, not reckless!** ⚡
---
**🎯 Profit Targets: Cash Out & Celebrate!**
- **Bullish Thieves**: Aim for **2200.00** or exit early if momentum fades.
- **Bearish Raiders**: Target **1980.00** for quick steals.
- **Scalpers**: Stick to **long-side scalps**—big players swing, small traders trail stops!
---
**📜 Market Intel: Why This Heist Works!**
The **US2000** is surging bullish! 🐂 Fueled by **COT data, macro trends, sentiment shifts & intermarket flows**—check the links for deep dives! 🔍📊
---
**🚨 Trading Alert: News Can Wreck the Heist!**
- **Avoid new trades during news!** 📰
- **Use trailing stops** to lock profits on open trades. 🔐
---
**🔥 Support the Heist—Hit Boost & Join the Profit Gang!**
With **Thief Trading**, every day’s a new robbery opportunity. Stay alert for the next big steal! 🤑💨
**See you in the markets, bandits!** 🤝🎭

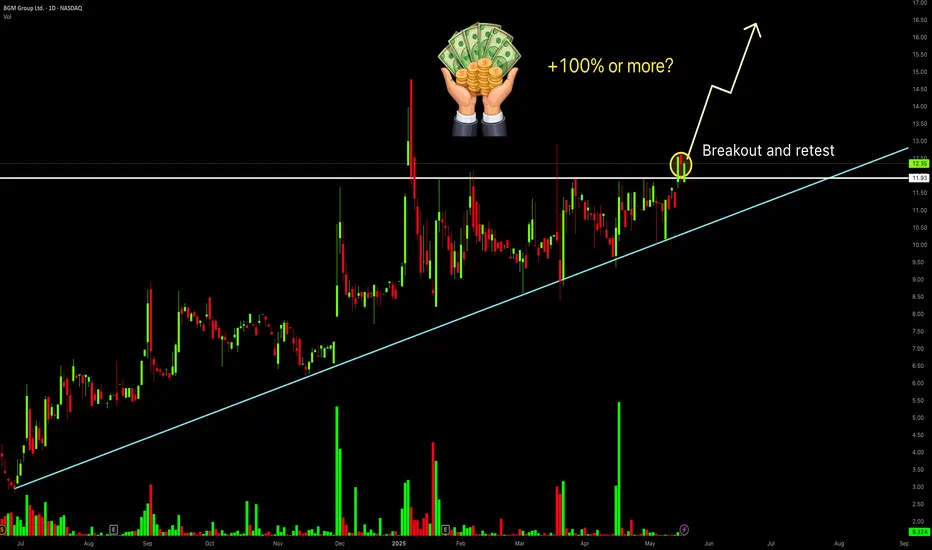
Breaking key resistance — could $BGM repeat $RGC’s 100x rally?Let me introduce a stock that has already generated a profit of nearly 40% and I have no intention of selling it yet. Because both the chart and fundamentals suggest the stock seems to be approaching the point of potential explosion, and it is even possible to increase several times.
This stock is NASDAQ:BGM , a traditional Chinese pharmaceutical chemical company but now it has transformed into an AI productivty platform. More on that later—let’s first take a look at the technicals, which I always pay close attention to.
Firstly,the uptrend remains intact.
Since last year’s stock split, the price has been climbing steadily within a clear uptrend. After breaking above $8.50, it has consistently held above that level for months, showing strong momentum. (I bought in when it dipped back to $8.50 earlier this year and have held since.)
In the recent days, the stock price has successfully broken through the upper limit of the consolidation range that has persisted for nearly 3 months, and has stabilized above $12.
This is a significant breakthrough, and it may indicate that the stock price could potentially start a significant upward rally at any time.
Secondly,the stock is almost fully controlled by the market maker.
There’s a saying in trading: “Volume precedes price.” Since December 2024, BGM’s trading volume has clearly increased, with each spike in volume followed by a small price uptick—money was buying.
Interestingly, each rise is followed by a pullback, but on much lower volume. This volume pattern—rising on gains and shrinking on pullbacks—suggests that the maket maker have accumulated most of the shares and now have strong control. The dips are likely just shakeouts to flush weak hands before a bigger breakout.
Thirdly, low short interest means minimal resistance to a price surge.
According to Nasdaq's data, BGM’s short position was 34,466 shares by 31th March, but dropping to 18,889 shares by April 30,the number of short positions has significantly decreased.
This was showing that as the stock price rose, short sellers mostly exited or turned bullish—clearing major obstacles for further gains.
Technically, everything is set—just waiting for the trigger. Pull the trigger could spark a massive rally, and that trigger may come anytime as the company nears to complete a key transformation.
Yes, the company is transforming from a traditional pharmaceutical firm into a leading AI tech ecosystem. Since last year, it has been actively acquiring companies to enter AI-driven healthcare, insurance, and wellness sectors, aiming to become an industry leader.
①In December 2024, BGM acquired RONS Tech and Xinbao Investment, integrating the AI insurance platform “Duxiaobao” (powered by Baidu’s NASDAQ:BIDU technology). Leveraging 704 million monthly active users, they aim to disrupt traditional insurance sales and drive exponential customer growth.
②In April 2025, BGM acquired YX Management to boost AI applications in insurance and transportation, accelerating the “pharma-insurance-health” ecosystem.
③In May 2025, BGM acquired HM Management and its two subsidiaries—SHUDA Technology and New Media Star—strengthening its algorithm optimization、data modeling and traffic-driven customer acquisition capabilities
After several acquisitions, the company has initially completed its transformation plan. So the "trigger" we are pursuing might emerge during the next major acquisition by the company to complete the final transformation.This is an important milestone. According to reliable sources, the company's next acquisition is likely to take place in the coming June. Let's wait and see.
Another "trigger" may be the company’s next earnings report, which will include the “Duxiaobao” AI insurance business for the first time, expected to add over $5 million in revenue, might to confirm the initial success of the company's transformation. And this is potentially spark a strong stock rally.
These two potential "triggers" are both approaching soon.
If all goes well, how far could this rally go? Let’s refer to the recent strong gains of Chinese stocks like $RGC.
Technically, RGC saw a clear volume increase and price rise around July-August 2024. Then it had a six-month shakeout with low volume pullback (similar to BGM’s current pattern). In March 2025, it launched a major rally, rising over tenfold.
In May, RGC surged again, supported by fundamental news: the company announced FDA approval for its new neurostimulation chip and a Parkinson’s study with Mayo Clinic. From the start to the peak, RGC gained over 100 times in a short period!
Looking at BGM again: after the breakout, the stock will likely first test resistance near $15, which may not be a big hurdle. The real test could be at $24—the pre-split high and the upper boundary of the current “megaphone” consolidation.
Even if the price only reaches around $24 , current investors could nearly double their money. After the company’s fundamental transformation, its revenue and profits potential could grow beyond RGC. So, how high can BGM’s stock go? Let’s wait and see.
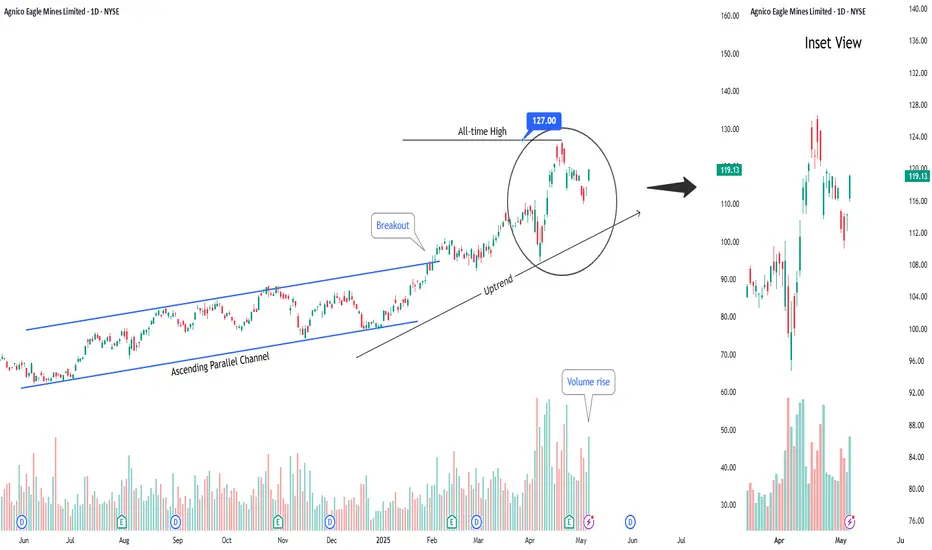
Buy Agnico Eagle Mines LimitedShort Term Trading Advice by Naranj Capital
Buy Agnico Eagle Mines Limited
● Buy Range- 108.5 - 112
● Target- 116 - 118
● StopLoss- 104.5
● Potential Return- 4-5%
● Duration- 14-15 Trading Days

Merck & Company Potential Post Tariff Resolution Bullish RallyWith potential developments towards the resolution of global tariffs and pharma being defensive in general, MRK price action seems to exhibit signs of a potential Bullish reversal breakout as the price action may form a prominent Higher High with multiple confluences through key Fibonacci and Support levels which presents us with a potential Non-Leverage hold opportunity.
Entry: (Buy 1 CMP 76.2 & Buy 2 87.6)
Stop Loss: 45 or 0 (depends on trading style as Non-Leverage Buy & Hold is recommended)
Potential Range for Targets: 130 - 170

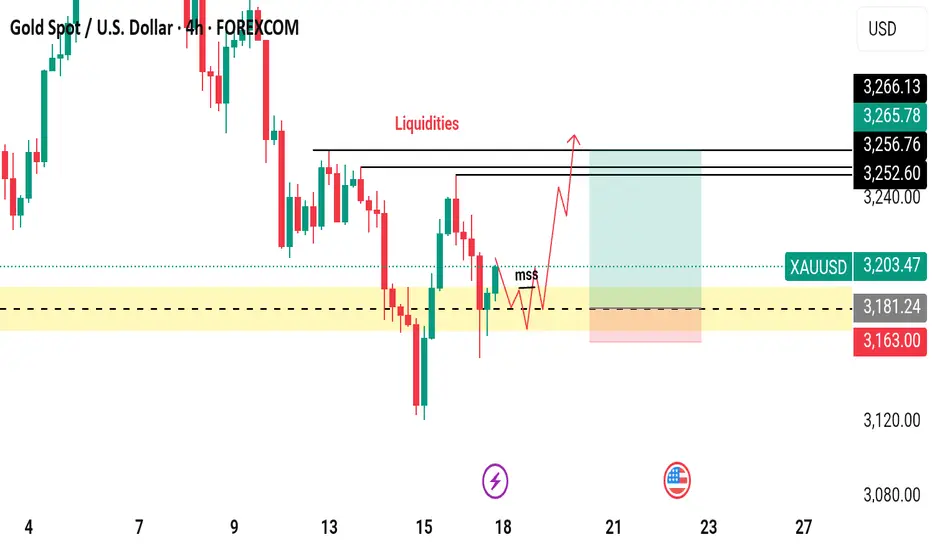
GOLD Has Shown A Significant Bullish Move!!Gold Market Analysis
Over the past week, gold has shown a significant bullish move by touching its weekly bullish Fair Value Gap (FVG) and closing a candle above it. This price action serves as a strong indication that the market is currently exhibiting bullish momentum. However, it is important to note that the sustainability of this bullish trend will be confirmed only through future market developments and price behavior.
As of now, our analysis suggests that gold, after revisiting and respecting the weekly bullish FVG, is trending upward. Looking ahead, we anticipate a minor retracement in the short term. This pullback could provide a healthy opportunity for the market to gather momentum before making another move upward. Ideally, we expect the price to retrace slightly and re-enter the highlighted yellow zone. Within this zone, we will be watching for a Market Structure Shift (MSS), which would act as our confirmation signal to consider entering a long position.
Once confirmation is received through MSS or similar price action cues, our strategy would be to target the liquidity zones situated above the current price level. It is also worth mentioning that the market has already cleared liquidity on the sell-side, which further strengthens the bullish case. Based on current technical indications and liquidity structure, there is a high probability that gold could reach as high as $3,250 in the upcoming sessions.
That said, market conditions can evolve rapidly, and it is essential to monitor price action closely. Traders and investors are strongly advised to conduct their own research (DYOR) and await clear confirmations before making any trading decisions. Staying vigilant and informed will be key to capitalizing on potential bullish movements in the gold market.
Primoris Services: A Long-Term Pick in US Energy Infrastructure◉ Abstract
Our latest analysis focuses on the booming U.S. utility and energy sector, set to hit a massive $1.1 trillion! Learn about the key drivers fueling this growth, from our increasing electricity needs and the electric vehicle revolution to the exciting rise of clean energy.
We have also given a “Buy” rating on Primoris Services Corporation NYSE:PRIM , a major player in building this energy infrastructure. Our analysis reveals their strong financial performance, attractive valuation compared to its peers, and promising technical indicators. While acknowledging potential headwinds like regulatory shifts, we believe Primoris presents a compelling long-term investment opportunity with significant upside potential. Read detailed analysis here and invest smartly.
Read full analysis here...
◉ Introduction
Imagine the companies that bring electricity to your home, the gas for your stove, and are building the future of clean energy. That's the U.S. utility and energy sector! It's a massive part of the American economy, and it's getting even bigger. By 2025, experts predict it will be worth a whopping $1.1 trillion! This includes everything from generating electricity to delivering it through power lines and pipelines, as well as distributing natural gas across the country.
This sector has been steadily growing at about 2.7% each year between 2020 and 2025, and it looks like this growth is going to continue. This article will give you a snapshot of the major reasons behind this growth, top players in this sector, and investment opportunities.
◉ Major Factors Behind the Growth of US Energy Sector
1. Electricity Use is Climbing: Americans are using more power than ever. The EIA expects electricity consumption to hit 4,205 Billion kWh in 2025, up from 4,097 Billion kWh in 2024. This surge is fuelled by increased usage in residential, commercial, and industrial sectors.
2. Everything’s Going Electric: Think about electric cars, heat pumps that heat and cool homes, and even cleaner machines in factories. More and more things are switching to electricity, which means we need even more power! This big shift towards using electricity is called electrification, and it's a major driver for the energy sector.
3. Clean Energy on the Rise: Solar panels and wind turbines are becoming a bigger part of how we get our electricity. These renewable energy sources are growing fast. By 2026, it's expected that they will provide about 27% of all the electricity in the U.S., up from around 25% in 2024. This move towards cleaner energy is really important for the future.
4. Massive Investments Ahead: To keep up with this growing demand and the shift to new technologies, utility companies are investing a lot of money. They are upgrading power grids (the network of lines that deliver electricity), building charging stations for electric vehicles (EVs), and using smart technologies to manage energy better. Experts at S&P Global predict that total spending on these things could be over $790 Billion between 2025 and 2030!
◉ Big Players in Building the US Energy Infrastructure
1. Quanta Services, Inc. NYSE:PWR : A premier provider of specialized infrastructure solutions for the electric power and oil & gas sectors. They are also heavily involved in renewable energy projects like solar and wind farms. You can learn more about them on their official website .
2. Primoris Services Corporation NYSE:PRIM : They provide construction and engineering services for the energy, utility, and infrastructure markets. They are increasingly focusing on building projects related to renewable energy. You can explore their details on their official website .
3. MasTec, Inc. NYSE:MTZ : This is a top infrastructure company in North America, working on energy, utility, and communication projects. This includes building renewable energy facilities, telecom networks, and oil & gas pipelines. You can find more information on their official website .
This report offers an in-depth analysis of Primoris Services Corporation , a prominent player in the U.S. energy infrastructure space.
Our long term recommendation is backed by Primoris Services Corporation ’s technical analysis and fundamental performance.
◉ Investment Advice
💡 Buy Primoris Services Corporation NYSE:PRIM
● Buy Range - 67 - 68
● Sell Target - 88 - 90
● Potential Return - 30% - 45%
● Approx Holding Period - 12-14 months
◉ Revenue and Profit Analysis
● Year-on-Year
- In FY24, Primoris reported revenue of $6,367 Million, marking an 11% increase from $5,715 Million in FY23.
- EBITDA grew to $415 Million, up from $366 Million the previous year, with the EBITDA margin slightly improving to 6.5% from 6.4%.
● Quarter-on-Quarter
- Q4 FY24 revenue reached a record $1,741 Million, up from $1,649 Million in Q3 and 14.9% higher than $1,515 Million in Q4 FY23.
- Despite the revenue growth, Q4 EBITDA declined to $110.6 Million from $123 Million in Q3.
- Diluted EPS (LTM) rose to $3.30 in Q4, up from $3.00 in Q3 FY24, indicating solid earnings momentum.
◉ Valuation
1. P/E Ratio (Price-to-Earnings)
● Compared to Peers:
- PRIM’s P/E is 17.9x, much lower than the peer average of 32.7x. This means the stock is cheaper than most competitors based on earnings.
● Compared to Industry:
- With a P/E ratio of 17.9x, PRIM trades below the industry average of 26.4x, suggesting it offers strong value within the sector.
2. P/B Ratio (Price-to-Book)
● Compared to Peers:
- PRIM’s P/B is 2.6x, while peers average 4.5x—again showing the stock may be undervalued.
● Compared to Industry:
- Compared to the industry average of 4.4x, PRIM still appears to be a bargain.
3. PEG Ratio (Price/Earnings to Growth)
PRIM’s PEG ratio is 0.43, which suggests the stock is not only cheap but also expected to grow earnings strongly—an attractive combination for investors.
◉ Cash Flow Analysis
- Primoris saw a strong improvement in operating cash flow, which jumped to $508 Million in FY24 from $196.8 Million in FY23—a sign of better cash generation from its core business.
◉ Debt Analysis
- With a debt-to-equity ratio of 0.42, the company maintains a solid financial position, suggesting its debt levels are well under control and not overly risky.
◉ Top Shareholders
- The Vanguard Group holds a substantial 11.6% stake in Primoris, reflecting strong confidence in the company.
- BlackRock also increased its investment by 9.65% from Q3 FY24 and now owns approximately 11.3% of the company.
◉ Technical Aspects
- On the monthly chart, the price is in an overall uptrend and has bounced off the trendline support, indicating continued upward momentum.
- On the daily chart, the price has broken through a rounding bottom pattern and is holding above the breakout zone, suggesting a potential for further upside movement.
◉ Potential Risks & Challenges
1. Regulatory Uncertainty: Ongoing concerns about global trade policies, tariffs, and regulatory changes, especially in the solar and battery storage markets, could impact future project economics and timing.
2. SG&A Expenses: Increased by $10.9 Million year-over-year, driven by higher personnel costs and $3.2 Million in severance expenses.
3. Energy Segment Backlog: Experienced a decrease due to the timing of new solar awards, potentially affecting future revenue visibility.
◉ Conclusion
Primoris Services Corporation NYSE:PRIM stands out as a promising investment, backed by consistent growth, strong financials, and a strategic focus on renewable energy and infrastructure. Despite facing risks like regulatory changes and backlog fluctuations, its solid position in the U.S. energy sector—especially with increased demand for clean energy solutions—gives it a clear path forward. With a competitive valuation and support from major investors like Vanguard and BlackRock, Primoris is poised for sustainable growth, making it an attractive long-term opportunity for investors.

Buy Agnico Eagle Mines LimitedShort Term Trading Advice by Naranj Capital
Buy Agnico Eagle Mines Limited
● Buy Range- 116 - 119
● Target- 125 - 126
● StopLoss- 112
● Potential Return- 5-6%
● Duration- 14-15 Trading Days
Long-Term Trend Still Intact for S&P 500The S&P 500 is falling, but despite the sharp negative moves in recent weeks, the longer-term trend remains positive.
The uptrend that began with the 2020 dip is still intact, and it appears the market has used this trend as an opportunity to buy the dips in the last two weeks.
If you zoom out from the current economic turmoil, the broader positive outlook for the U.S. market remains. U.S. stocks have become slightly more affordable following the recent selloff. If the U.S. manages to avoid a deep recession, this market pullback could create a huge opportunity for those who missed out on the 2023–2024 rally.
However, risks are notably higher now, especially with the introduction of new tariffs that are likely to weigh on growth.
As long as the long-term trend holds, downward moves into the 4600–4800 zone could offer compelling long-term buying opportunities.

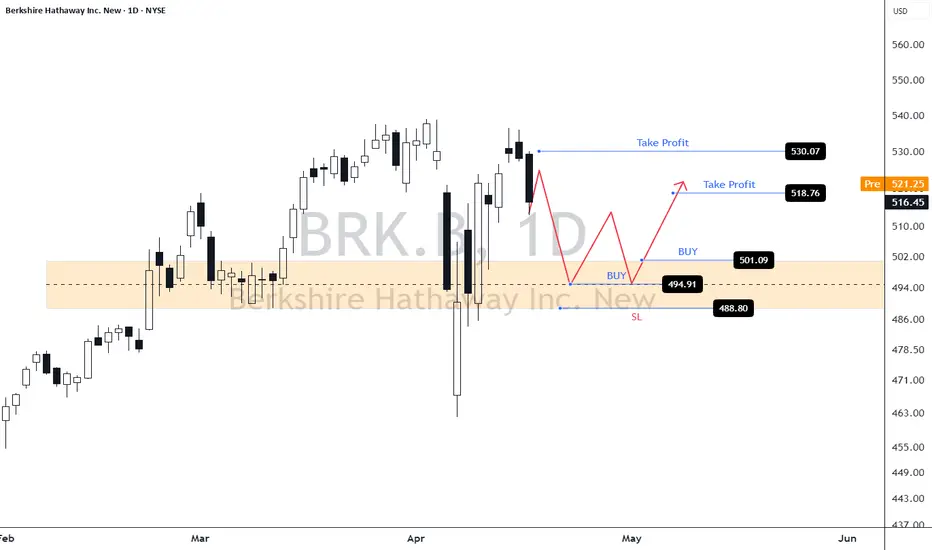
U.S. Stock Swing TradeBRK.B
This stock remains one of the few in the U.S. market that continues to exhibit technical strength, maintaining a well-defined uptrend.
Current price action suggests a potential buy-on-dip opportunity near key support levels.
Entry Zone: 494 – 501
Take-Profit Target: 518 – 530
Stop Loss: 488
That said, it remains essential to closely monitor the S&P 500 index, along with prevailing macroeconomic developments, which continue to exert significant influence on market sentiment.
$S&P500 macro analysis , market approaching correction °•° $SPXHi 👋🏻 check out my previous analysis ⏰ on SP:SPX macro bullish analysis ⏰
As provided it went up up 🚀 completed my target's 🎯 💯💪🏻 ✅ ✔️
Click on it 👆🏻 just check out each and every time updates ☝🏻 ☺️
•••••••••••••••••••••••••••••••••••••••••••••••••••••••••••••••••••••••••••••••••••••••••
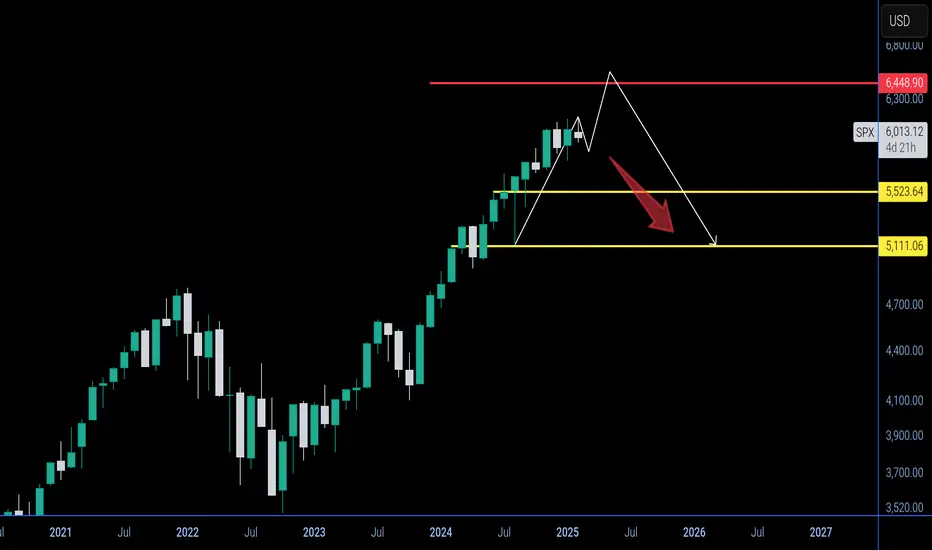
NOW I was completely 🐻 BEARISH on the market with in upcoming months SP:SPX
📌 Expecting liquidation pump $6500 - $6700
Invalid 🛑 when complete month close above $6700
¹support - $5500 ( 🎯 ¹ )
²support - $5130 ( 🎯 ² )
🎯 3 ... Will be updated based on market conditions by that time ☺️
📍 A wise 🦉 man said - always having patience " is " always gaining only /-
NASDAQ:TSLA ( i accumulate slowly until it cross above $400 )
rest of stocks i will follow index ☝🏻 i will invest based on market conditions ..... ✔️
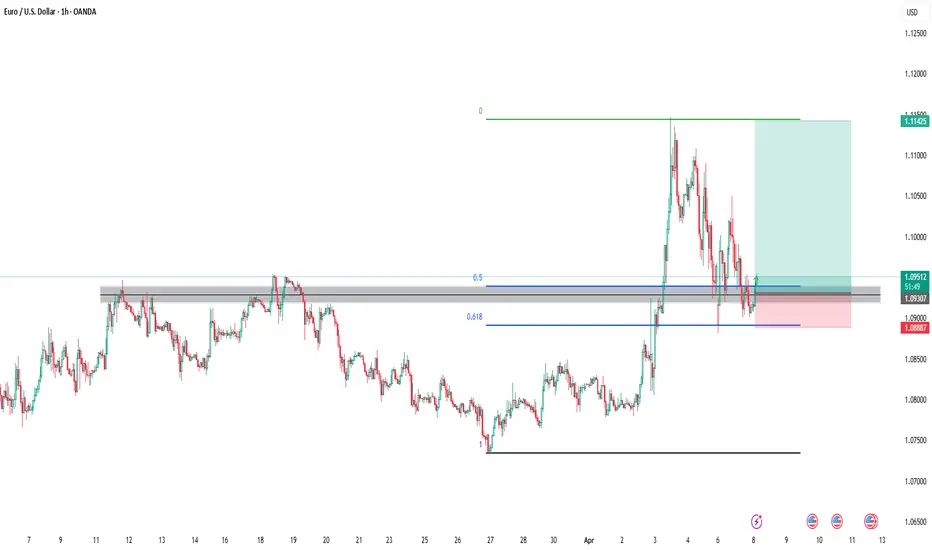
EUR USD BUY Entry Setup 1 hour timeframe EUR USD has formed a bullish break and retest pattern on the 1 hour timeframe, following the bullish trend from last week.
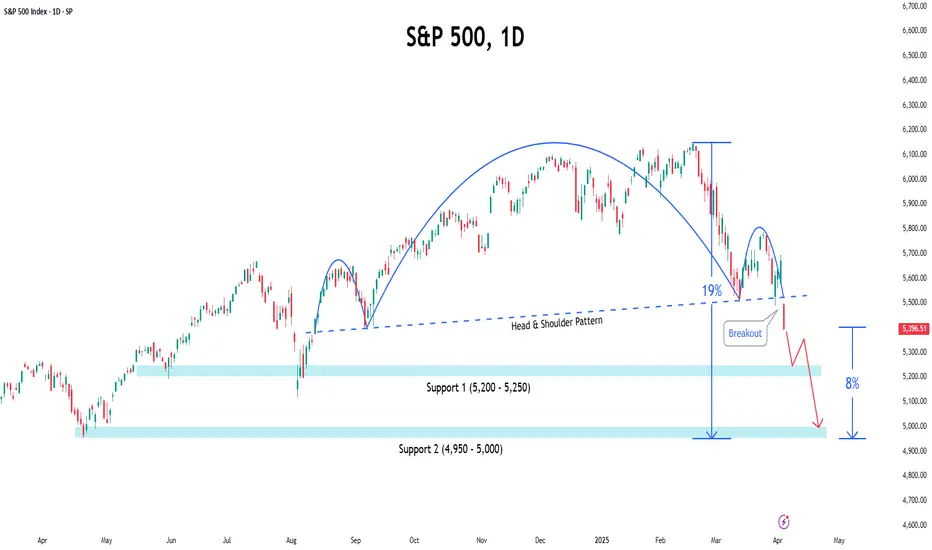
Head & Shoulder Breakdown: Will S&P 500 Drop Another 10%?● The S&P 500 has experienced significant volatility recently, mainly due to President Donald Trump's announcement of new tariffs.
● On April 3, 2025, the index saw a nearly 5% drop, its worst single-day loss in five years.
● The recent price action suggests that the index has broken below the neckline of the Head and Shoulder pattern, indicating a potential continuation of the downward trend.
◉ Key support levels to watch
● 1st Support - 5,200 - 5,250
● 2nd Support - 4,950 - 5,000