Dow Jones: Is this the beginning of a 2nd SELL-OFF? Cont'd2nd wave of coronavirus has become a factor in Europe.
Central banks are selling gold for the first time in more than a decade to keep their economy afloat.
Dow Jones had the biggest weekly drop in 7-months after multiple breakouts such as 1) the 5-month rising trendline, 2) the neckline of a double top and 3) created a lower low in 7-month.
With all the above factors, we have a case to expect the 2nd wave of the selloff in the stock market which probably has begun.
The strategy to sell is simple:
1. Don't be a fortune teller and try to time the market and trade with tight stop loss.
2. Make sure your trade does survive before the price pulls all the way back to the double top at 29200.
Usstockmarket

Bank of America in the next few months There are few strong signs that suggests BAC goes down to test its previous supports. However, the result of the presidential election could affect the severity of this correction.

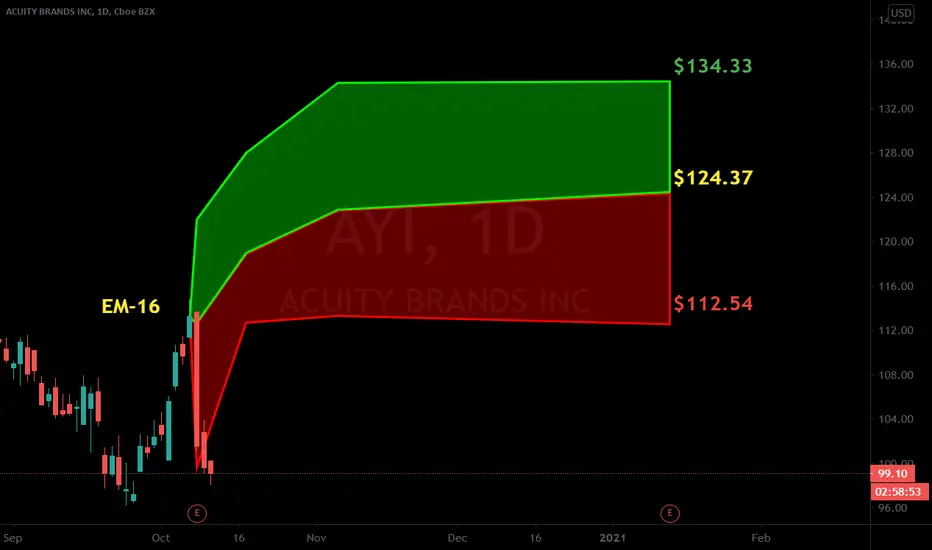
AYI Acuity Brands Inc pushing beyond the lower boundary$AYI is trading lower pushing beyond the lower projected boundary of the PEAD cone, with good room for a bullish move following the projection back towards the median line.
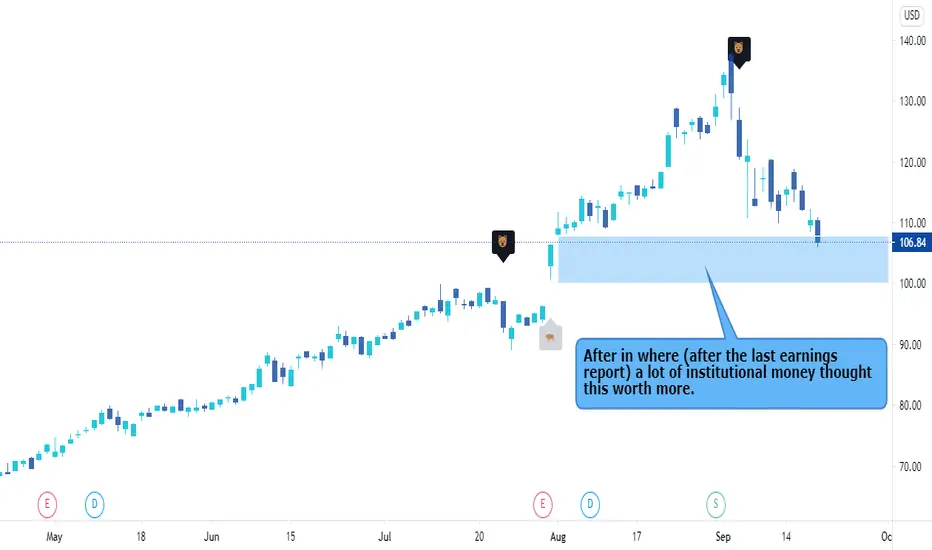
AAPL - Interesting areaHi Traders
Next week it could get really interesting for Apple. On friday we fell back into the area where we saw a big reaction after the last earnings report. A lot of institutional money thought this stock would be worth more.
How do they think now, after the stock split and the latest US-China trade war capter around bannishment from Tik Tok etc?
Depending on the reaction of the price in this area it could become interesting to buy into AAPL for a shorter period of time.
Live Intraday Trading-Look how I earn when a TSLA car crashes!!Points to be noticed :
1.Point at which I shorted the stock
2.Point at which I covered my profits
Watch my stream to understand the logic behind this trade on trading view......

Live Trading video - Shorting TSLA after rejecting from high's!!Thank GOD !!!
Things you can learn from this live trading video :
1.How to control your emotion.
2.Stick to your plan.
3.Trust your strategy
4.Look when I shorted the stock
5.Look when I added to shorts with low quantity
6.Look how I covered my profit's i.e, partials
7.How I shift my stop losses while trading
8.How I set my profit target
9.I have tried showing all this thing with graphical representation

Live Trading - TSLA long after taking support at pre supportPoints to be noticed :
1.Entry
2.Exit
3.How I stop my trade after getting profit cushion at stop loss
4.Partial taken

Travelling towards MARS with TSLA stock !!!Awesome trade in TSLA . Look at the exact entry point and partials taken by me .

Live Trading in TSLA with audio explanation for more than $30KWatch my video of live trading with audio recording ....

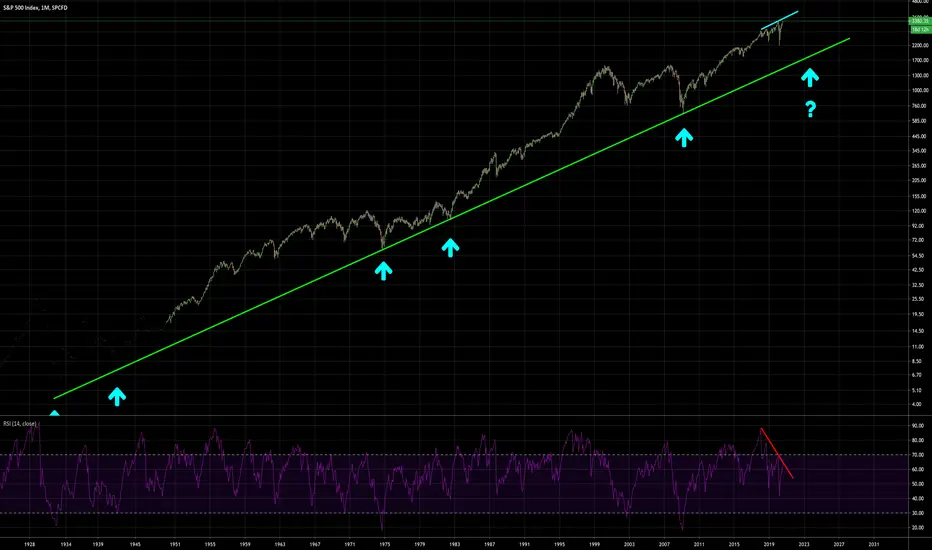
S&P500 Monthly- Long term chart. Bearish RSI divergence, 1600??S&P500 Monthly- Long term chart. Bearish RSI divergence. 1600 worse case target.
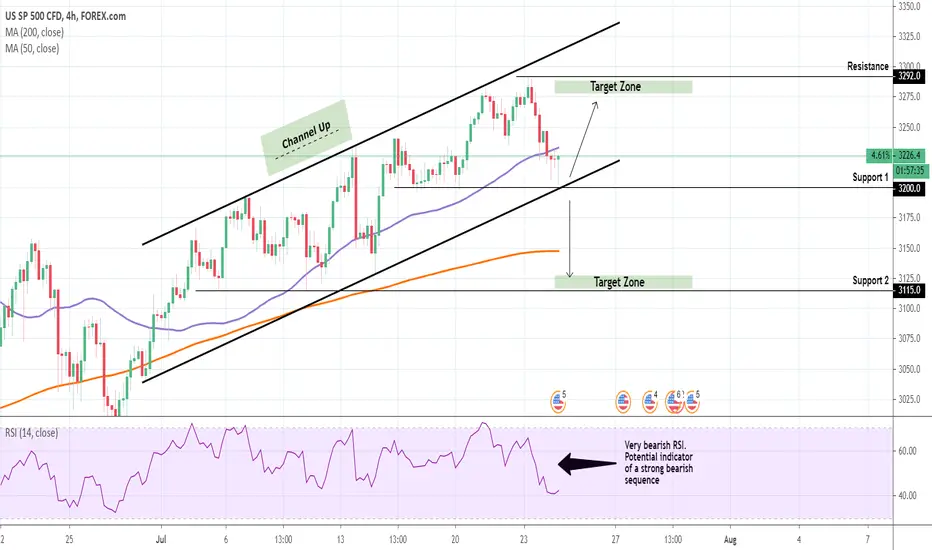
S&P500: Testing the Support. Action plan.S&P is trading within a Channel Up on the 4H chart (RSI = 43.121, MACD = 1.310, ADX = 35.999) and is right now testing not only the 3,200 Support but also the Higher Low trend-line of the Channel Up.
This is a bullish signal which we are taking and will close within 3,275 - 3,292, which is practically the Resistance Zone. If however the 3,200 Support breaks, we will switch to selling towards the 3,115 Support.
** If you like our free content follow our profile to get more daily ideas. **
Comments and likes are greatly appreciated.
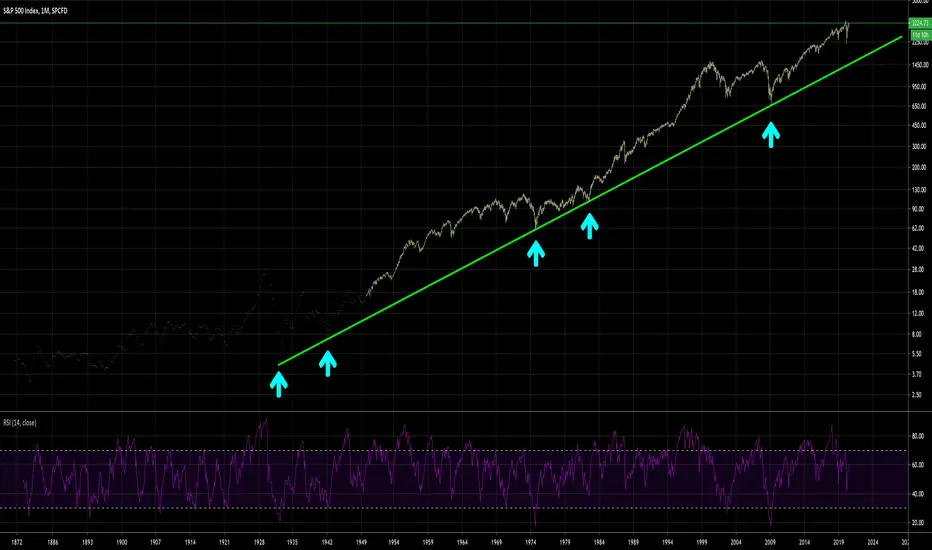
S&P500 index back to the late 1800sNice uptrend over time plotted on Log chart. If index is to retest long term support, levels will need to retest around 1500.
COVID-19 2nd bear wave? (DJI wave analysis)Fundamentals:
If we consider permanent damage to the economy caused by COVID-19, we should expect a decline in corporate profits, therefore a fundamental devaluation of stocks and a great deal of uncertainty
Now the market optimistically bets on fast recovery. Nobody wants to be overboard a rising stock market.
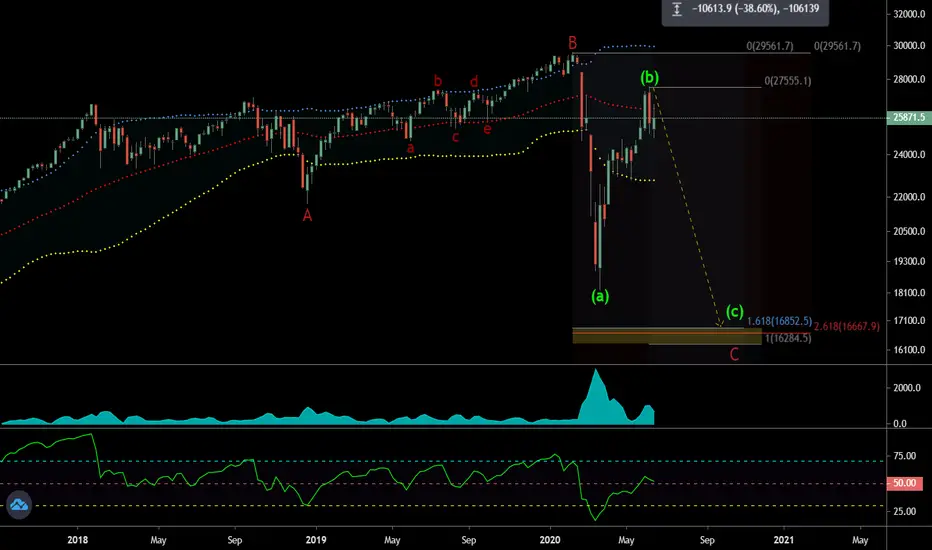
This conditions remind me an Elliott Wave B definition. When the markets swiftly recovers from initial big sell off, and everyone is confident that the worst storm is left behind. Price drifts close to previous top or even slightly exceeds it, but then a dramatic sell off occurs.
Technical analysis:
Wave B (red) looks pretty sluggish. Rather a 3-wave pattern than an active impulse wave. It has driven stock market (DJI) only 10.7% above the top which was set in January 2018. I've discovered that wave (B) is equal to 161.8% of wave (A).
A green wave (b) is an assumed result of investors being overoptimistic.
Although the recent volumes and STDEV confirm the downward bias/momentum, it's not certain that an assumed wave (b) is finished and soon decline in stocks is inevitable.
Forecast:
If assumption is right, we should expect a strong decline in stock prices sooner or later.
DJI is anticipated to reach 16225-16679 area.
PS:
I've duplicated the publication so that more investors can see it in the "markets - indices - major world indices - dow30" pass.
COVID-19 2nd bear wave? (DJI wave analysis)Fundamentals:
If we consider permanent damage to the economy caused by COVID-19, we should expect a decline in corporate profits, therefore a fundamental devaluation of stocks and a great deal of uncertainty
Now the market optimistically bets on fast recovery. Nobody wants to be overboard a rising stock market.
This conditions remind me an Elliott Wave B definition. When the markets swiftly recovers from initial big sell off, and everyone is confident that the worst storm is left behind. Price drifts close to previous top or even slightly exceeds it, but then a dramatic sell off occurs.
Technical analysis:
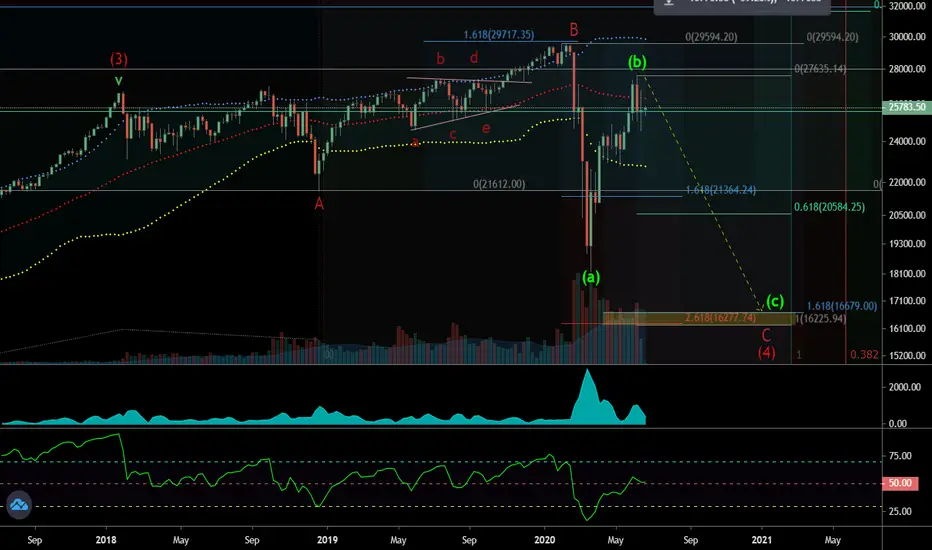
Wave B (red) looks pretty sluggish. Rather a 3-wave pattern than an active impulse wave. It has driven stock market (DJI) only 10.7% above the top which was set in January 2018. I've discovered that wave (B) is equal to 161.8% of wave (A).
A green wave (b) is an assumed result of investors being overoptimistic.
Although recent volumes and STDEV confirm the downward bias/momentum, it's not certain that an assumed wave (b) is finished and soon decline in stocks is inevitable.
Forecast:
If assumption is right, we should expect a strong decline in stock prices sooner or later.
DJI is anticipated to reach 16225-16679 area.
My bearish long term playbookThis is the bearish scenario on the US stock market which yet needs to be confirmed and might be invalid soon, but if the stock market starts to tank in the upcoming weeks It might be very usefull to anticipate fast.
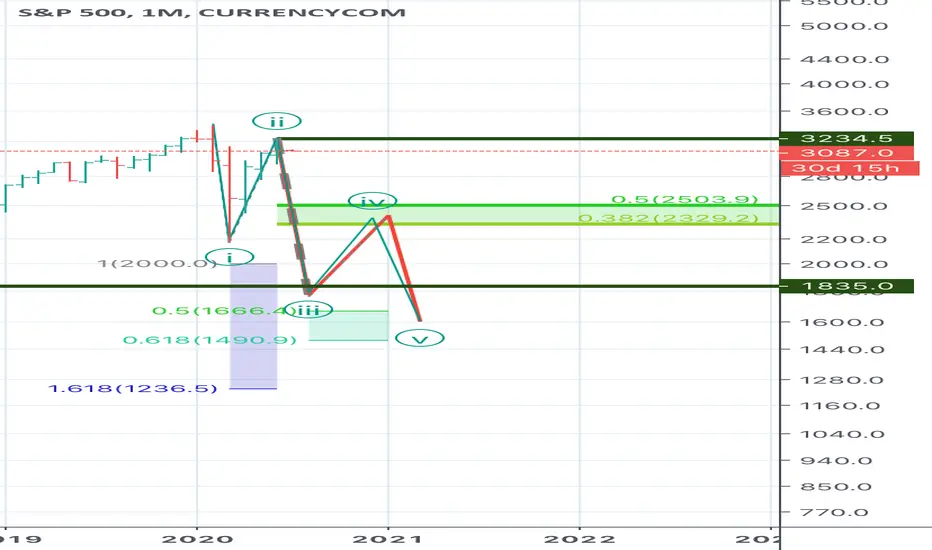
☆ SPX / USD SP500 — US Stocks Reversal ☆Price of SPX is turning down after completing 5-wave cycle, this can lead us to corrective phase inside (1)-(2).
Possible retracing to the 2800-2700 as previous (IV) wave bottom.
For next week I can expect some rebound to upside to complete (B) wave

Could the FIS share continue to rise? If So, Lets "Buy"US technology services shares rose strongly despite the demonstrations and protests in The United States of America.
FIDELITY NATL INFORMATION SERVICE, known as FIS, stands for a strong bullish rally based on the bottom side of the ascending channel And it was able to form a wide triangle that it broke through.
Any return to price at 140, which represents the upper side of the expanding triangle, is a strong opportunity to buy towards the upper side of the ascending channel at price 150

NASDAQ TECH FLEXNDAQ is having a bit of an electric surge and could push ATH (all time highs) amid the pandemic playing out. Tech for the win it seems during times of uncertainty to save the day.
Bears are getting a bit of a slaughtering here as many are turning to and being more reliant on technology than ever before.
A forethought is that smart money in other US markets will leave these stagnate companies to flow into high tech tech firms, due to FOMO thus NASDAQ will hit ALL TIME HIGHS.
Keep in mind that this also makes the economy look stronger yet soo many more are staggery than ever before since the start of 2020 due to the flow on effects of covid and the recession that no one is clearly speaking about that’s been teeter totting since mid last year. (You can’t polish a turd)

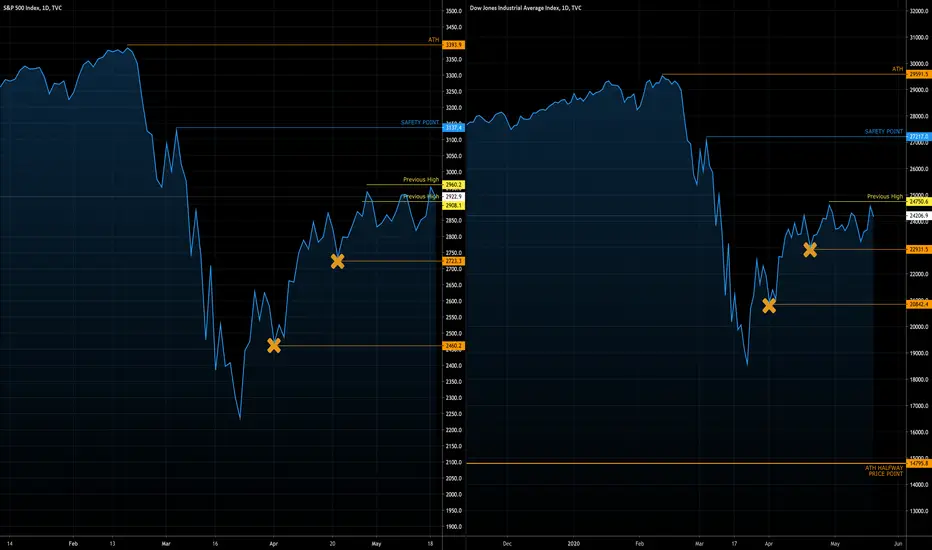
US Markets Testing Previous Highs Normal Economic Sentiment:The following below remains, however S&P and DJI are testing the previous high. If these markets break this I’ve added a safety point on which I will deem these market have revered from the cover turmoil and it’s ‘business at usual’, the FED will most probably still have that money printer going Brrrrrrrrrrrrrrrrrrrrr though…
VERY BEARISH if the following transpires before breaking the above safety points:
S&P: If P action closes below the orange line at 2723.3 attention will turn more bearish and watch for market to fall to 2460.2. In this instance will reassess market dynamics as it may bounce in this range or continue to fall
Dow: The same flows for Dow Jones with P action closes below the orange line at 22931.5 attention will turn more bearish and watch for market to fall to 20842.4. In this instance will reassess market dynamics as it may bounce in this range or continue to fall
If markets stay above these initial levels for the next 3 months (i’ll be surprised) however this will look like economies are back in order from COVID-19 and running ‘normal economics’
SHOPIFY INC| One of The Most Top Dog Stock| 27th Apr 2020"When movement control order period extended, any related online is boosted.."
-Zezu Zaza Webinar 22nd April 2020
The best part in online business is you can do your business worldwide without any restraint.
One of my most profitable stock trading. People highlighted to you about this stock. Why?
Because it is not popular compare to biotech stock or trending pharma stock right now.
People still using online business and e-commerce to make income or selling product online.
This is why when MCO extended, this stock skyrocketing. Just because all people in the world
using their service and pumped up with volume.
If you love this stock, please also look to other e-commerce stock as well. Most of e-com
out there are right now skyrocketing. Watch the Amazon right now and JD.com. I am sure
you will love to trade this stock as e-commerce stock is one of my favourite stock to trade
after biotech and others.
Our MCO has been extended until 12th May 2020. Trump not yet to re-open the economy.
Just ride the bandwagon. Btw, this stock earning report will come on 6th May 2020.
So standby. Most of spike will occurred as soon as the earning report release to public.
Thanks.
Regards,
Zezu Zaza
2048

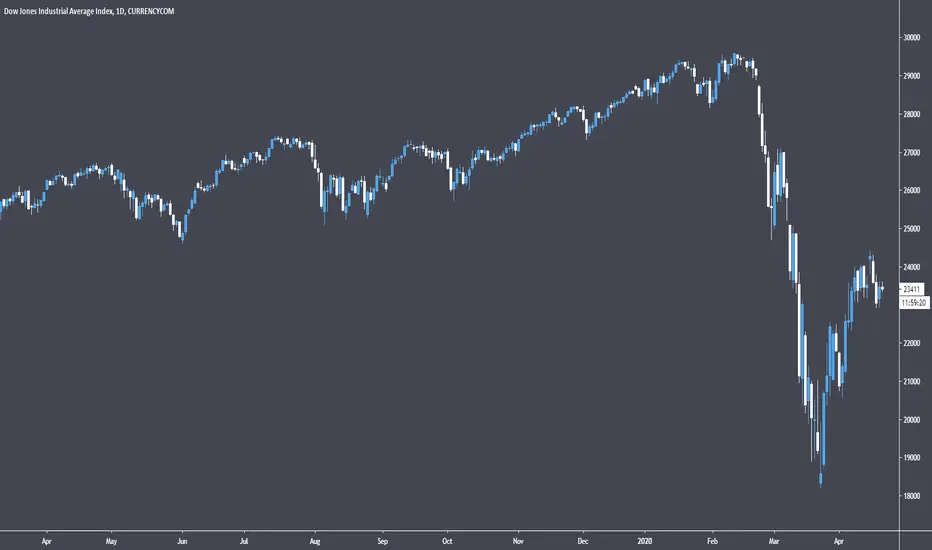
Wall Street Stays FlatUS stocks have not seen any major changes this week, staying uncharacteristically calm despite headlines such as the oil price crash. The Dow Jones gained 457 points on its Wednesday session, a jump of 2%. It is now trading at 23,400 points on the hourly chart. Likewise, the S&P 500 and NASDAQ indices saw similar gains, climbing 2.3% and 2,8%, respectively.
However, this is most likely as investors are also still awaiting news such as this week’s jobless claims data. Latest predictions expect around 4.2 million new unemployment claims to be filed, bringing the total up to 26 million claims in just 5 weeks.
Likewise, the US Senate just passed another bill to aid in the fight against the coronavirus in the State. After weeks of negotiations, the Senate passed a $500 billion bill in order to help small businesses, and it is expected to go to the House of Representatives later this week. This news did give some relief to the stock markets, as they now look to extend their gains for the second session in a row.
But there are reasons to continue being bearish about the stock market. Investors are vying for stocks to gain momentum again, with news such President Trump pushing state governors to ease their lockdowns and begin reopening their state borders again.
However, reopening so early, before the virus is under control, poses the risk of a wave of new infections flooding in. This poses the risk of causing more damage to the economy in the long term. Despite Trump’s eagerness to reopen the economy and start recovering the damage that virus has caused the stock market, the opposite could end up happening if he pulls the trigger too soon.
US Stocks Market — Corona Bulls In Charge?Hello! Dear dear friends, brothers, sisters, hodlers, scalpers, swingers, bulls and bears!
I want to share with you idea about US stock market before it opens in Monday In less than 20 hours.
Fist of all, I am looking at technical points, and price action.
But can we spend few mins to think about next:
Who going survive after this crisis? (I mean companies)
First of all the price of SP500 is based on top US stocks, so means by that, most of these companies will survive as they are basically giants...
Even if some of them in "frozen" or limp mode, after get used to quarantine and new order, they will run in full power.
Jobless claims exceed 20 million in four weeks, inflicting a toll on the labor force not seen since the Great Depression.
Okay that is what it is, many people are out of their jobs, for many reasons for sure, and after some period of time I believe we going to find the way-out, and everyone will get it’s place in new order.
Let's step away from corona bullshit and start think what is going on with chart and price.
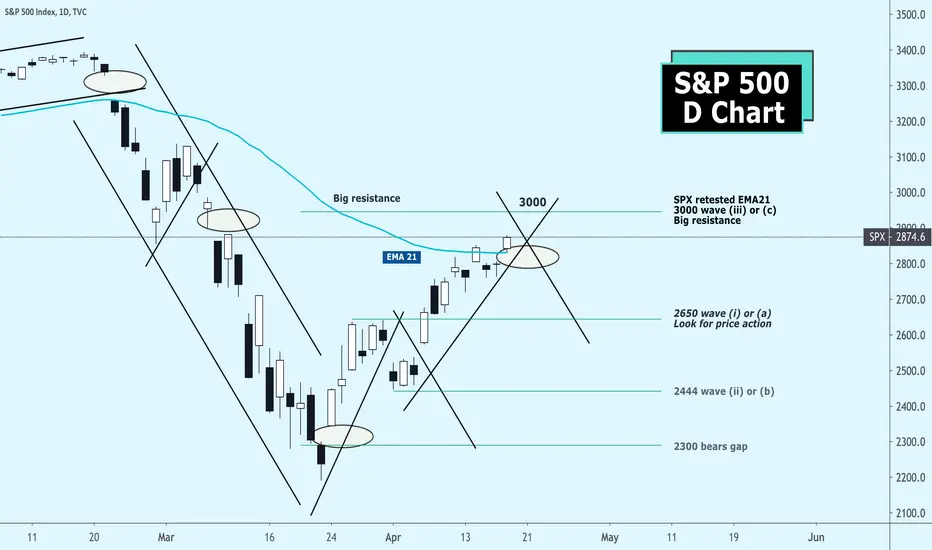
Few important notices I put on chart:
3000 basic and strong resistance for big period of time.
Now we going to challenge it. Monday opening will show what force bulls and bears have.
2650 is another important level for bulls as it Is possible invalidator of impulse wave setup.
2300 is bears gap — if we going to revisit this zone, I will start to worry for real ;)
DISCLAIMER: If you following somebody with good Risk/Reward and Win Ratio.
Without risk management and allowing yourself to lose some trades, you won’t be good trader/investor.
Please don’t follow any analyst blindly on this website.
Always use stop loss to prevent yourself from losses.
Make sure you understand and afford the risk. Please.
ATTENTION: Dear followers please consider to appreciate my ideas on tradingview with your likes, this will help bring more quality content in next trading ideas. And if new to my work, and you like it, you can Follow my page to receive ideas in your Ideas Stream. Thanks 🤝😊
Stay tuned to Artem Crypto
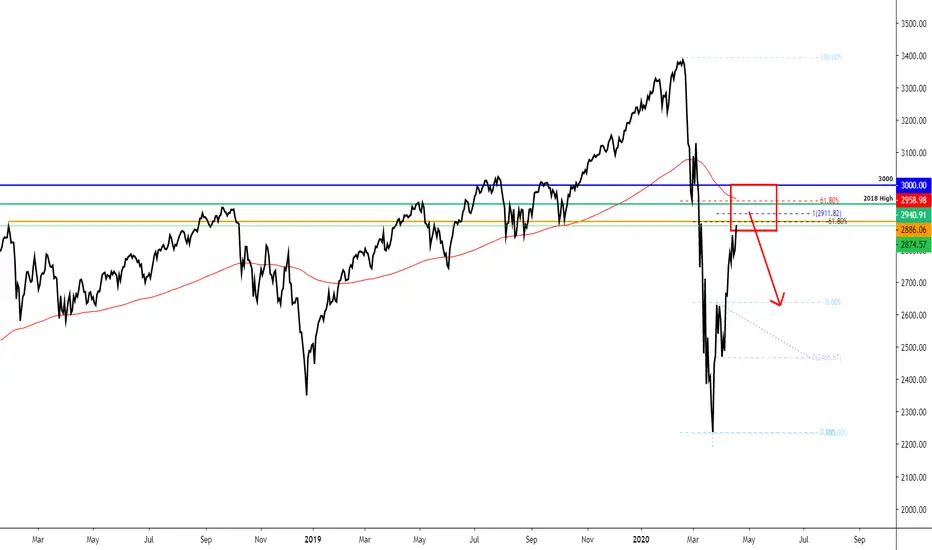
S&P 500 | The Current Pump Might Be Over?Hi,
After dropping around 2200, the price of the S&P 500 got a pretty decent pump upwards.
The pump has been pretty strong but technically, it looks like it might find an end because the current resistance is quite heavy for those kinds of market situations.
I will say that in the next weeks the S&P 500 price may start to correct back downwards. A lot of unemployees, a lot of questions and etc.
The fundamental research is your decision but for me, as technical analysts, it looks like the current price area can start a correction back to the lower levels. From the current price action I cannot say how low it can go but for those who are looking entries for stocks - you can wait, you will get those needed stocks with a better price than they are right now.
Technical criteria for the correction downwards are:
1) AB=CD equal waves from this year's bottom and the D point is inside the red box.
2) Fibonacci retracement 62%, known as a Golden Ratio and it is also a pretty strong resistance indication inside the red box.
3) Fibonacci Extension 162% lands into the marked rejection area.
4) The 2018 high can play an important role inside of it, to add strength to the mentioned resistance zone.
5) Simply, the strong price level marked as an orange horizontal line. It has been a clean resistance, it has been clean support and definitely it shows that investors might be interested in this level.
6) Daily EMA 100&200 are playing an important role inside of the strong resistance zone which stays between 2850-3000
7) Weekly EMA 50&100 acts as resistance levels.
8) Just in case the round number 3000. It is the final level of this box which can act as resistance but at the moment I don't think it might reach there for a while - obviously never know ;)
So, a lot of signs from the recent price action are pointed to the marked red box which can produce a short-, mid-term retracement downwards.
As said, for those who like to jump into a current "Bull run", do not
Do your own research and please, take a second and support my effort by hitting the "LIKE" button, it is my only FEE from You!
Regards,
Vaido