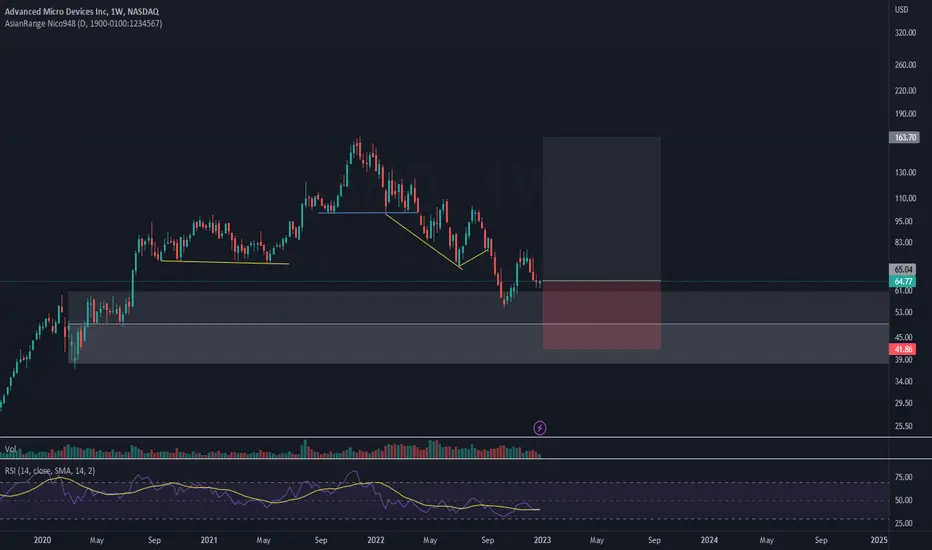
US STOCK- AMD = BUY LONGTERM ---(AB7)Advanced Micro Devices Inc. (Nasdaq)
Looks Long on WEEKLY Time Frame...
One can Grab it for Risk of 36 % and Reward 150 %
(details are on chart)
** This Post is Educational Purposes Only, Please Concern your Advisor before investing in market related instruments.**
Usstockmarket
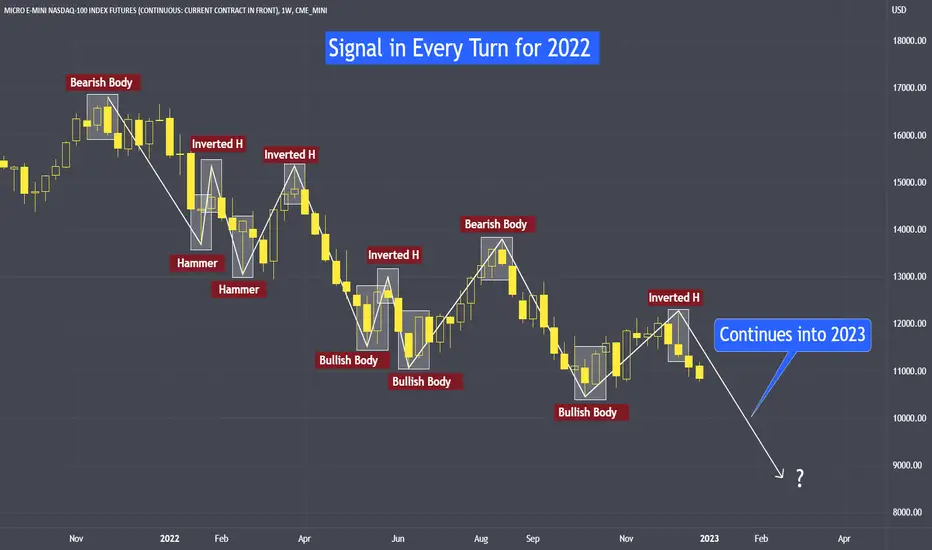
"Biting Point" Signal in Every Turn for 2022Stay-tune for the video version shortly, we will do more in-depth study.
Micro E-Mini Nasdaq Futures
Minimum fluctuation
0.25 point = $0.5
1 point = $2
10 points = $20
100 points = $200
Disclaimer:
• What presented here is not a recommendation, please consult your licensed broker.
• Our mission is to create lateral thinking skills for every investor and trader, knowing when to take a calculated risk with market uncertainty and a bolder risk when opportunity arises.
CME Real-time Market Data help identify trading set-ups in real-time and express my market views. If you have futures in your trading portfolio, you can check out on CME Group data plans available that suit your trading needs tradingview.sweetlogin.com
I hope this tutorial will be helpful, in enabling you to read into the market with greater clarity.
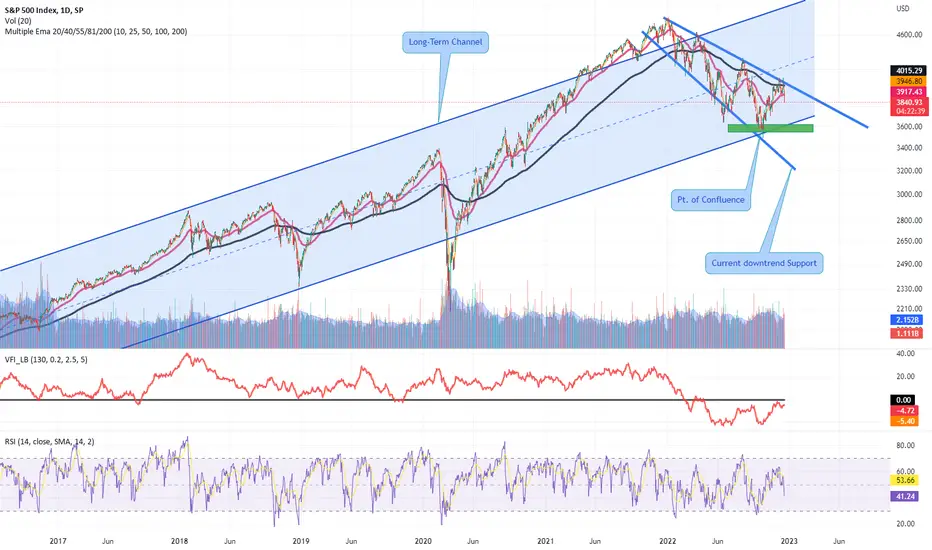
SPX500: When is the right time to buy?SPX will soon touch the buy zone near 3500-3700.
Marked by green rectangle in the chart, this is very crucial zone for the following reasons:
1. This zone is supported by long-term, uptrend channel.
2. It is also supported by short-term, downtrend channel.
3. Market has already recovered from this zone once.
Here are also fundamental reasons to believe why this is an important zone.
1. US Inflation, which peaked at 9.1% in Jun-22, is now reversing. It dropped to 7.1% on Nov-22 and is expected to continue downtrend. However, caution is advised that the figure of 7.1% is still alarming.
2. Oil is witnessing a downtrend. It is almost halfway ($75 a barrel) from the peak of $130 a barrel.
I don't see the market flying high from the buy point, but profit is possible for swing traders and accumulation for investors.
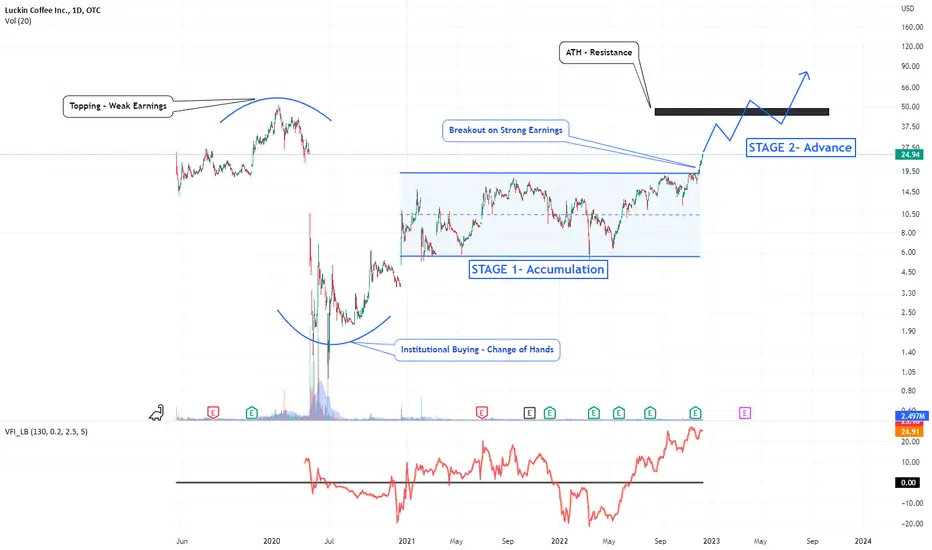
LKNCY - Breakout Entered Advance StageLKNCY has made a powerful breakout from its accumulation zone. This breakthrough came on the back of strong quarterly earnings, positive net income, and growing revenue.
INTRODUCTION:
LKNCY is a strong rival of Starbucks in China. It is rapidly adding new stores, reaching the nationwide number of nearly 8,000. In contrast, Starbucks has 6,000 stores in China despite its decades-long presence.
BREAKOUT & ADVANCE STAGE:
When a stock enters Advance Stage (called as Stage-2), its movement gets fast particularly when it is supported by strong earnings. LKNCY stayed in Accumulation Zone (Stage-1) rangebound for almost 2 years while the company did not post positive earnings for many years. But now, it has broken the resistance of accumulation stage, and entered advance stage on the back of impressive quarterly earnings.
EARNINGS GROWTH
Luckin's post-quarter revenue is up 18% while post-quarter earning has expanded a whopping 561%. Its earning trend and footprint growth in China shows it to be a truly growth stock. It has had negative margin for the past few years which kept its price growth lurking and slow. However, its revenue growth has never slowed down because of its rapid expansion and widening customer base.
FUTURE PROSPECTS
Although not enough data is available about the future growth of LKNCY, its current growth trend reveal good prospects for the future. Its technicals are sound and financials are rapidly improving.
SPX500 - Points You Must Know You may already be aware what I am going to tell. But I suggest learn these points again!
Stock Market is in a Downtrend
US Stock Market is in a strong downtrend. This downtrend began in January-2022 when soaring inflation straddled the market. There is high volatility as evident by wide swings between down-trending channel. These wide swings show uncertainty, chaos and confusion - you'd know it more when you compare it with smooth long-term uptrend which followed post-Covid situation.
Stock Market is also Following a Long-term Up-trending Channel
Kick-Start since 2009 when financial crisis faded, US stock market has been lead and guided by a long-term up-trending channel. This channel has often provided support as well as resistance to the market except when Covid-19 occurred which caused a down-spike for a brief period. It is highly probable that the same channel will continue to guide the market.
There is a Point of Confluence
Past Long-term up-trending channel & current down-trending channel have a point of confluence shown by light red circle. At this point of confluence, SPX500 has a already taken support once. If the market comes down, it is possible that it again takes support somewhere near to the point of confluence.
PRECAUTIONS TO TAKE
1. Avoid high-debt stock unless a company shows drastically increasing profit-margin
2. Avoid a stock below 200 MA unless it takes a reversal
3. Keep cash in hand to add when dust is settled
4. Better to spend this time in learning rather than in trading

Trading Series – The Buy StrategyI am starting a new Trading Series, the whole idea is to create longevity in our trading career, meaning trading should not be a short-live adventure, but we should trade till right into our retirement age.
We all may have read that many build-up their fortunes through business, investing or even trading and suddenly most of their net worth reduced substantially overnight, and this is what I mean they are running it without longevity.
Trading is a very fulfilling job and can be non-stressful when we understanding there is a framework to recognise opportunity and risk from the markets. Our role in this job is to eyeball both that trading opportunities and risks and then make decisions from there whenever we identify either one of them.
I am going to share with you my experience on how to do that in this whole series – Today we will discuss The Buy Strategy, in the next part, we will discuss the sell strategy. And the subsequent parts on the different strategies and how to manage our trades and trading fund into longevity.
Content:
The buy strategy – it can be applied to both:
· Long-term
· Short-term
Minimum fluctuation
1 index point = $5
10 = $50
100 = $500
There is the micro as well. It is one tenth the size of the E-mini. Very manageable especially for those aspiring traders.
Disclaimer:
• What presented here is not a recommendation, please consult your licensed broker.
• Our mission is to create lateral thinking skills for every investor and trader, knowing when to take a calculated risk with market uncertainty and a bolder risk when opportunity arises.
CME Real-time Market Data help identify trading set-ups in real-time and express my market views. If you have futures in your trading portfolio, you can check out on CME Group data plans available that suit your trading needs tradingview.sweetlogin.com

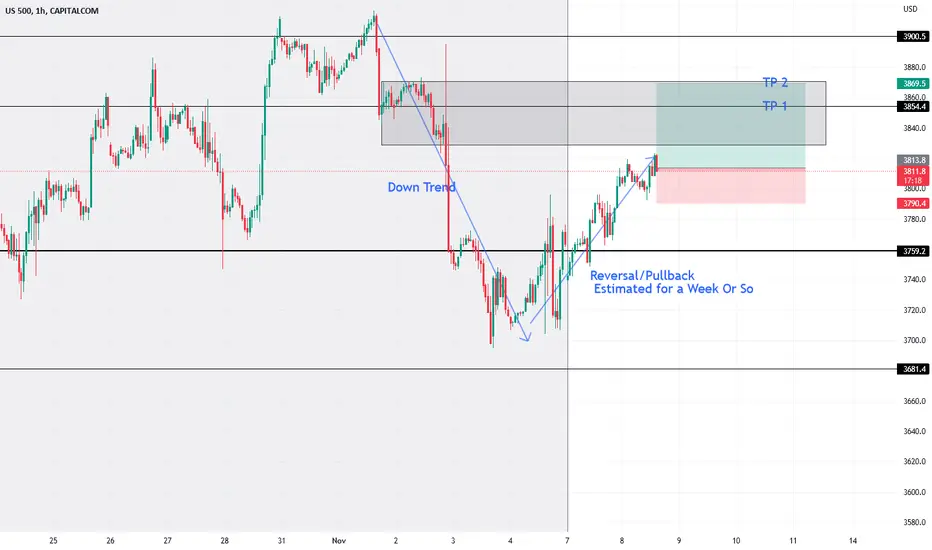
Observation of Recent Trends & A Likely Reversal; SPX500Good Day All,
By looking at the first four days of November,
it clearly shows a downtrend which resulted in more than 5% reduction in SPX500 levels.
But slowly and steadily Prices are recovering and heading for the consolidation zone that is from 3830 - 3870, The 40 point range and the price's behavior will determine whether it'll be bullish/bearish, but judging from the key levels marked in black, though some may call it outdated, I have observed prices in many unique pairs almost always respecting levels of old.
To conclude, I hope prices will continue its bullish trend past the consolidation zone for reasoning which may not sound logical but then again, I'm still new to this.
If indeed by rare occurrence someone decides to use this prediction, please do your own analysis first and foremost, while i don't mind my idea helping others, I wouldn't like to see others fail alongside me due to my own.
Take Profit 1 : 3855
Take Profit 2 : 3870
Stop Loss : 3790
Possible Prediction Expiry Date & Rules: If Price Breaks Out of Bounds & A Week Or So.
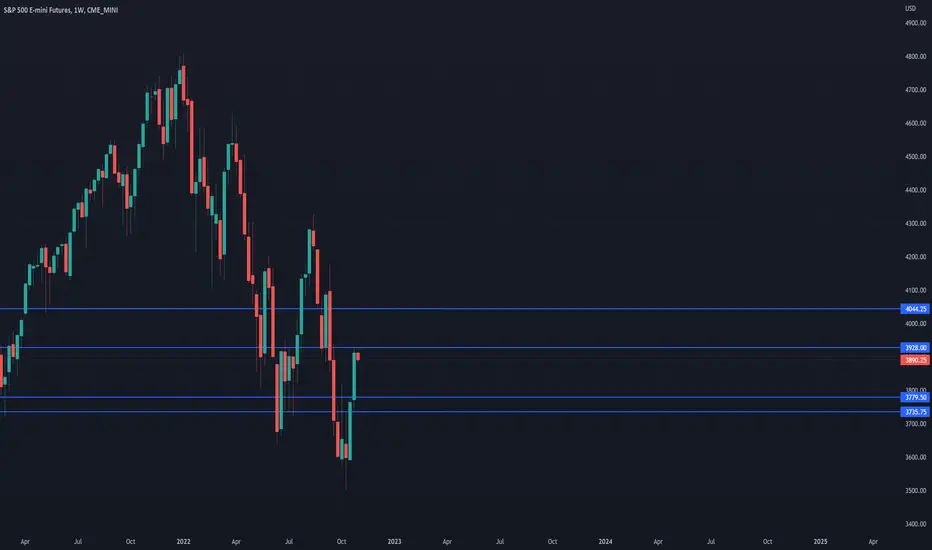
SPX Weekly Volatility Forecast 31/10 - 04/11 2022 SPX Weekly Volatility Forecast 31/10 - 04/11 2022
Currently the volatility for this week is around 3.57% , up from expected 3.4% last week.
According to ATR calculation, currently the volatility is located around 72th percentile.
Under this circumstances the expected movement of the candle is :
BEAR : 2.6% from the opening point of the weekly candle
BULL : 2.8% from the opening point of the weekly candle
At the same time, currently there is 10.8% that the movement within this weekly candle is going to
break and close either above or below the next channel:
TOP: 4044
BOT: 3778
Lastly, taking into account the previous weekly high and low there is a :
79% chance that we are going to touch the previous week high
27% chance that we are going to touch the previous week low
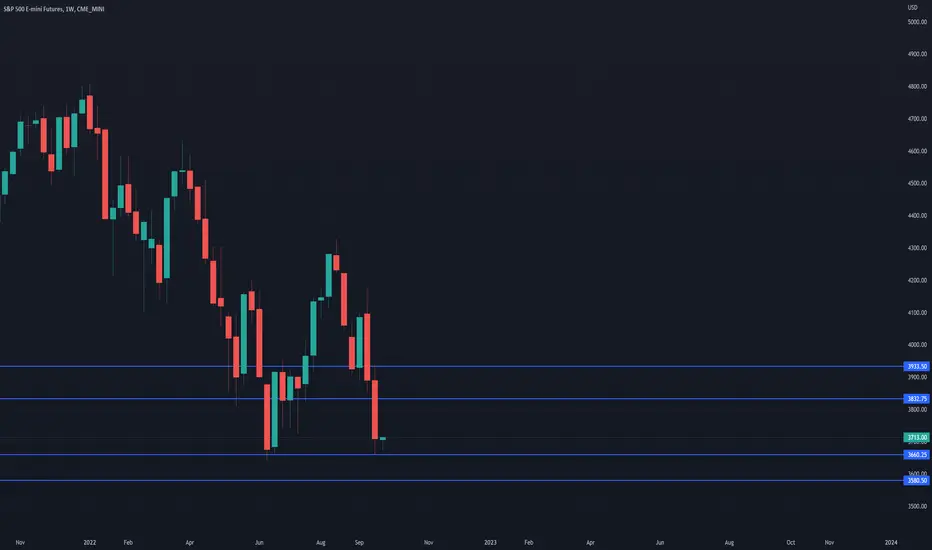
SP500 Weekly Volatility Forecast 26-30 September SP500 Weekly Volatility Forecast 26-30 September
Currently our volatility coming from volatility token for SPX is at 4.15%, increasing from 3.41% last week, located on 80th percentile, placing us in a high volatility environment
Based on the previous calculations, there is currently a 10% chance that the asset is going to break the channel(the weekly candle it will close above/below)
TOP 3831
BOT 3578
At the same time, based on the previous calculations:
- There is a 35% chance that the previous high from last week of 3933is going to be touched
- There is a 65%chance that the previous low from last week of 3660 is going to be touched
We can deduct that we have a much higher probability to have a continuation of bearish candle than bullish.
On average the weekly candle when the asset was located around this percentile are 2.51% for bull candles and 2.76% for the bear candles from the opening price.
From the fundamental point of view, news that can affect this asset price this week:
- Core Durable release, CB Consumer confidence and Powell Speech for Tuesday 27 Sep
- Powell Speech for Wednesday 28 Sep
- US GDP and Jobless Claims coming on Thursday 29 Sep
- Core PCE on Friday 29 Sep
Overall I believe for this week there is higher chance due to the overall global activity to have another bearish weekly candle.
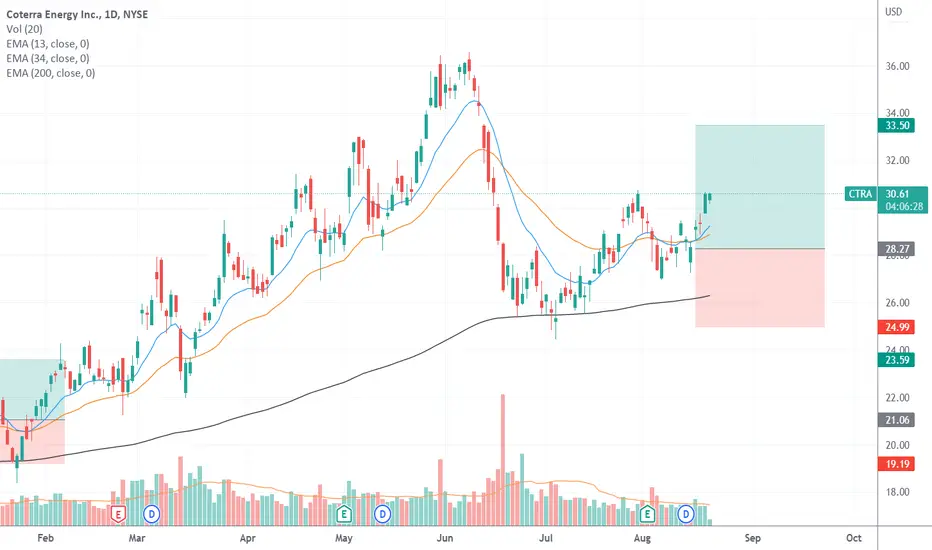
The deal closed CTRA in US stock market with profitAlhamdulillah , The deal was closed on CTRA in US stock market with a profit of 8.2 % in a 1 week . I wish good luck to everybody.
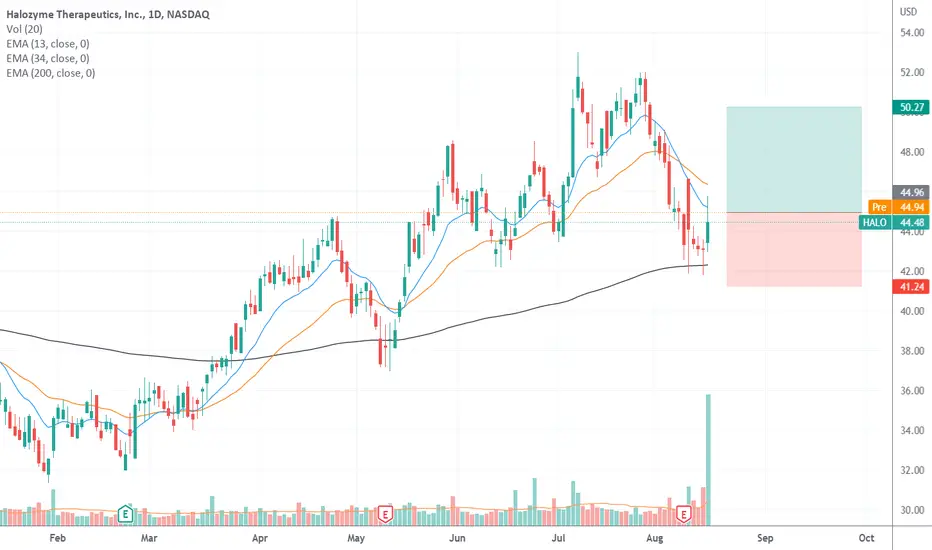
Buy HALO in US stock market 17/8/2022You can buy it Target 50.27 stop loss 41.24 money management is your responsibility . good luck
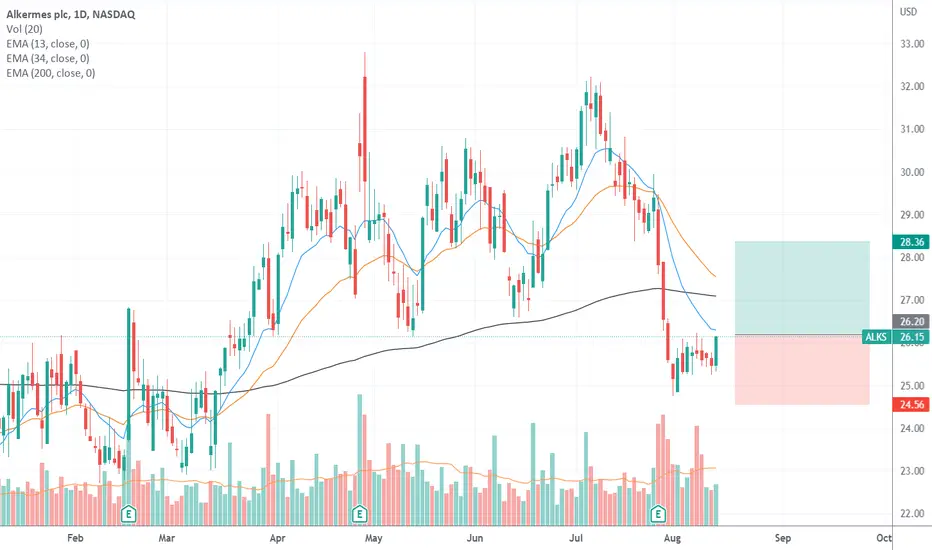
Buy ALKS in US stock market 15/8/2022You can buy it Target 28.36 stop loss 24.56 money management is your responsibility . good luck
The deal closed CALM in US stock market with profitAlhamdulillah , The deal was closed on CALM in US stock market with a profit of 5.94 % in a 1 week . I wish good luck to everybody.

The deal closed WRB in US stock market with profitAlhamdulillah , The deal was closed on WRB in US stock market with a profit of 6.1 % in a 1 week . I wish good luck to everybody.

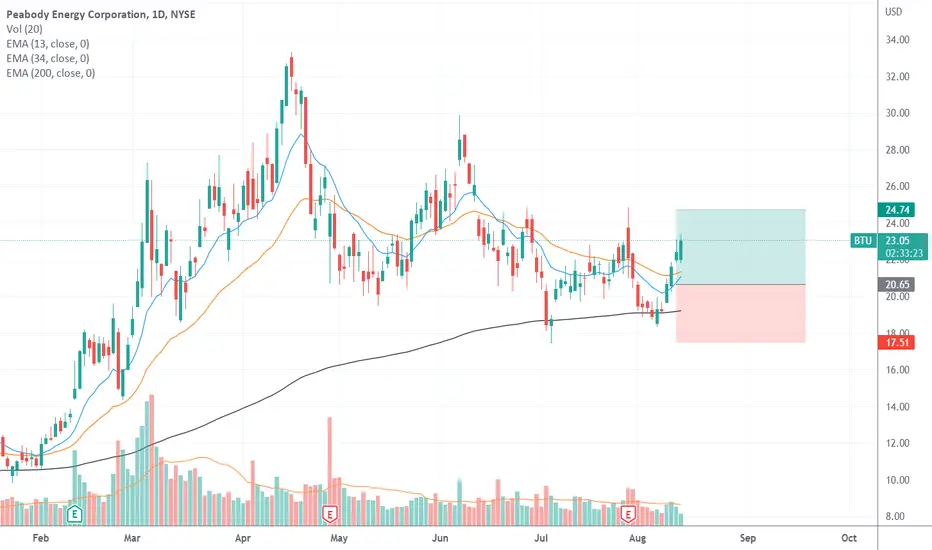
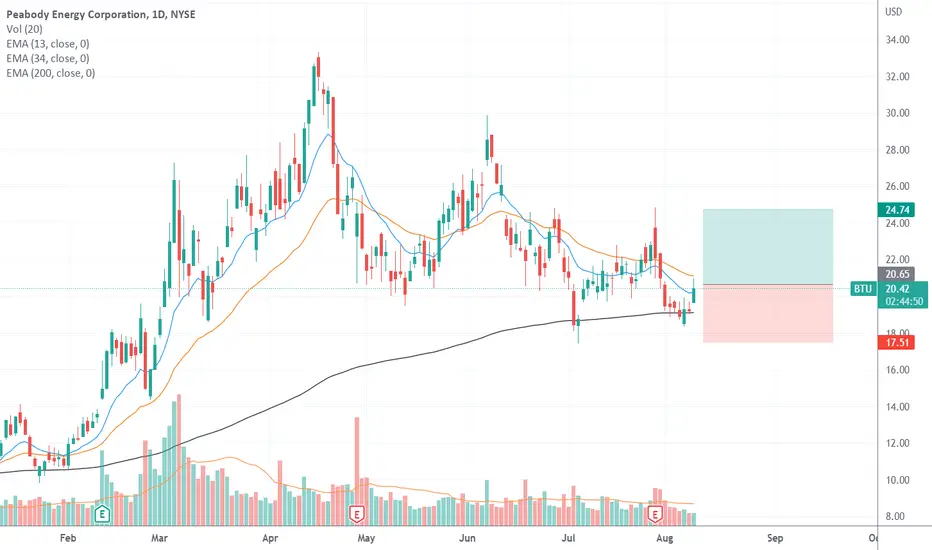
The deal closed BTU in US stock market with profitAlhamdulillah , The deal was closed on BTU in US stock market with a profit of 13.14 % in a 4 days . I wish good luck to everybody.
Buy CTRA in US stock market 10/8/2022You can buy it Target 30.85 and 33.5 stop loss 24.99 money management is your responsibility . good luck

Buy BTU in US stock market 9/8/2022You can buy it Target 22 and 24.74 stop loss 17.5 money management is your responsibility . good luck
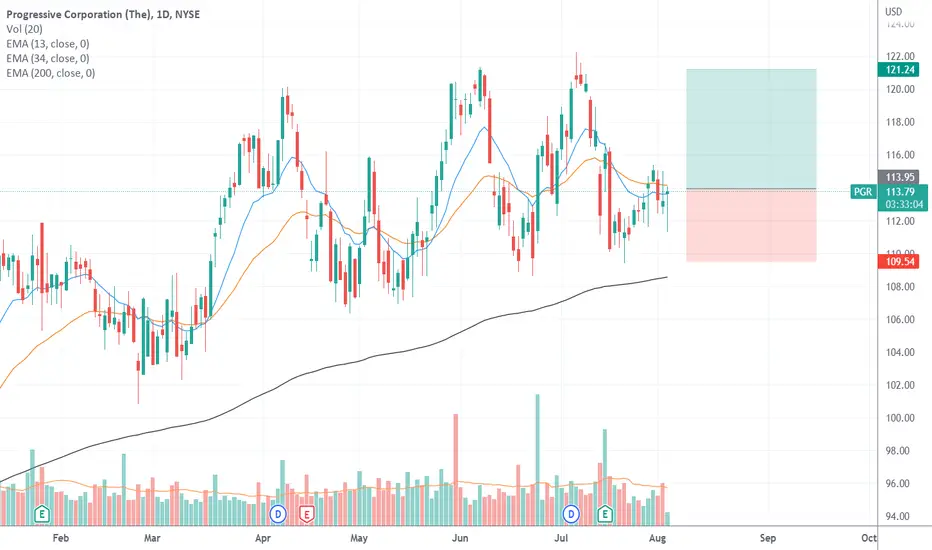
The deal closed PGR in US stock market with profitAlhamdulillah , The deal was closed on PGR in US stock market with a profit of 4.69 % in a 4 days . I wish good luck to everybody.
Buy CALM in US stock market 4/8/2022You can buy it Target 56.39 stop loss 49.49 money management is your responsibility . good luck

The deal closed ELA in US stock market with profitAlhamdulillah , The deal was closed on ELA in US stock market with a profit of 13.45 % in a 2 days . I wish good luck to everybody.

Buy WRB in US stock market 4/8/2022You can buy it Target 64.79 and 68.36 stop loss 59.8 money management is your responsibility I recommend entering a maximum of 10% of the portfolio. good luck

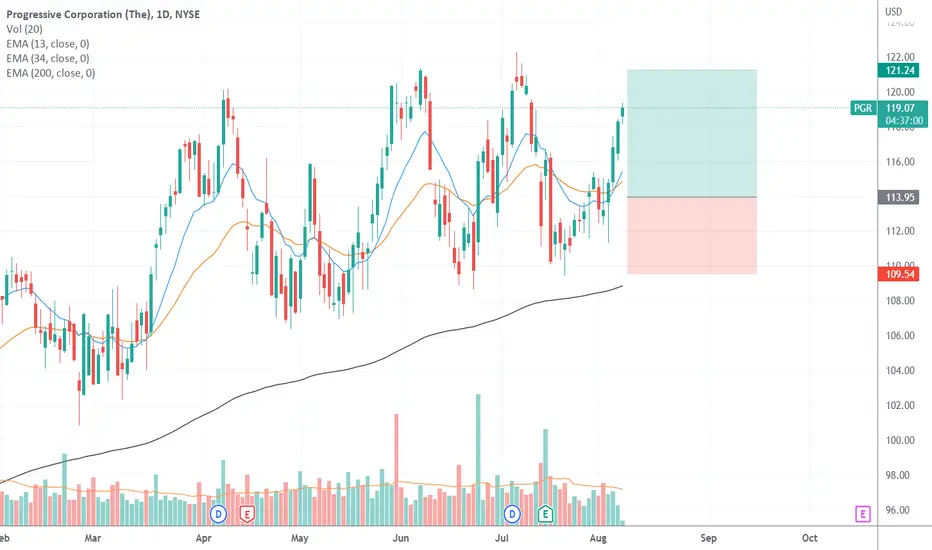
Buy PGR in US stock market 3/8/2022You can buy it Target 121.24 stop loss 109.54 money management is your responsibility I recommend entering a maximum of 10% of the portfolio. good luck
Buy ELA in US stock market 3/8/2022You can buy it Target 7.83 stop loss 6.5 money management is your responsibility I recommend entering a maximum of 10% of the portfolio. . good luck
