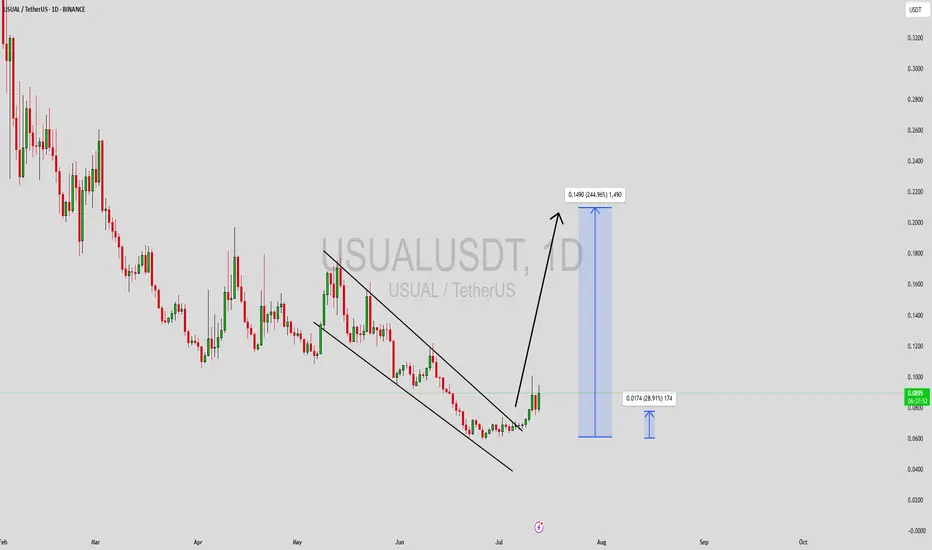
USUALUSDT Forming Falling WedgeUSUALUSDT is starting to capture the attention of crypto traders as it forms a well-defined falling wedge pattern on the charts — a classic signal for a potential bullish reversal. This technical setup is often sought after because it combines a declining trend with contracting price action, suggesting that selling pressure is losing steam and that a significant breakout could be on the horizon. The volume profile for USUALUSDT is also showing healthy signs, with increasing accumulation, reinforcing the case for a strong move upwards once the wedge’s resistance is broken.
A falling wedge breakout is a powerful indicator that buyers are regaining control and that the market sentiment is shifting. For USUALUSDT, the projected gain of 220% to 230% makes this an incredibly attractive play for traders who look for high-risk, high-reward setups. This type of pattern, when combined with a supportive volume surge, can deliver rapid and sustained price action, especially in the volatile crypto markets where sentiment can flip quickly.
Beyond the technicals, investors are increasingly taking interest in the USUAL project’s fundamentals and future potential. The team’s consistent development progress and growing community support are creating a solid foundation for long-term growth. As the market eyes this pair, a confirmed breakout from the wedge could attract even more traders and institutional investors seeking to capitalize on its upside potential.
✅ Show your support by hitting the like button and
✅ Leaving a comment below! (What is You opinion about this Coin)
Your feedback and engagement keep me inspired to share more insightful market analysis with you!
Usualbtc
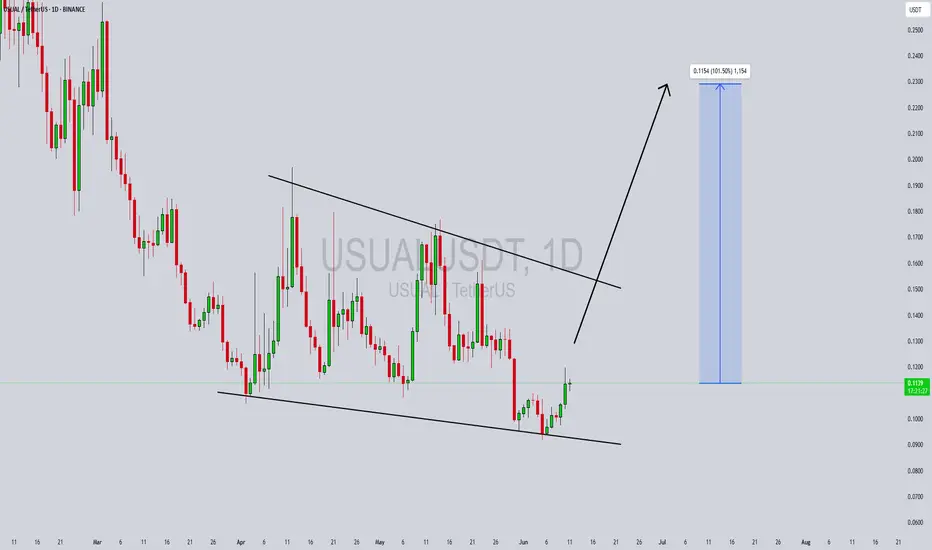
USUALUSDT Forming Falling WedgeUSUALUSDT is currently displaying a falling wedge pattern, a powerful bullish reversal signal in technical analysis. This formation typically precedes a breakout to the upside, particularly when accompanied by increasing volume, which is present here. The compression of price within the wedge signals diminishing selling pressure and a buildup of momentum, potentially setting the stage for a strong rally. The expected upside for this setup is projected between 90% to 100%+, making this an attractive opportunity for traders seeking mid to long-term gains.
Investor interest in the USUAL project is steadily growing, likely due to its unique positioning and use-case within the broader crypto and DeFi ecosystem. As awareness around smaller-cap tokens with strong fundamentals and appealing chart structures increases, USUAL is becoming a notable mention. This trend of renewed interest often acts as a catalyst, pushing price action significantly once technical confirmation is met.
The falling wedge is nearing its apex, indicating a possible breakout is imminent. Traders should closely monitor key resistance levels for a decisive breakout candle supported by high volume. Once this occurs, rapid movement toward key resistance zones and Fibonacci targets can be expected. Historically, similar setups on altcoins have yielded quick and sizable returns post-breakout.
With market sentiment improving and technical indicators aligning, USUALUSDT may be poised for a major bullish breakout. It’s a pair worth watching for traders who focus on breakout patterns, trend reversals, and volume-based confirmations.
✅ Show your support by hitting the like button and
✅ Leaving a comment below! (What is You opinion about this Coin)
Your feedback and engagement keep me inspired to share more insightful market analysis with you!
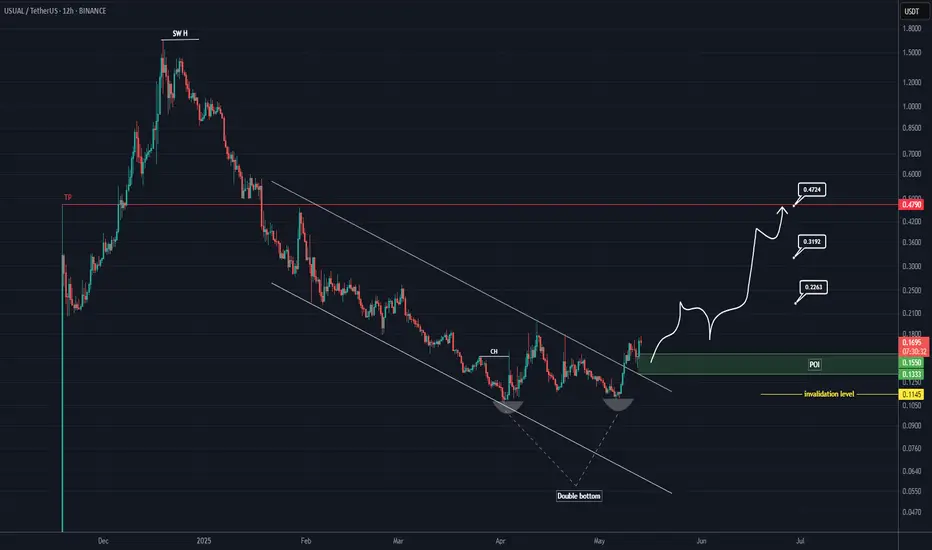
USUAL Looks Bullish (12H)A double bottom pattern has formed on the chart, leading to a breakout from the price channel.
A support zone has been established, and a bullish CH has appeared on the chart.
Considering the breakout and the bullish structure, we can set up a buy position on this coin.
Targets are marked on the chart, and reaching the third target is also possible.
The invalidation of this setup will occur if a daily candle closes below the invalidation level.
For risk management, please don't forget stop loss and capital management
When we reach the first target, save some profit and then change the stop to entry
Comment if you have any questions
Thank You
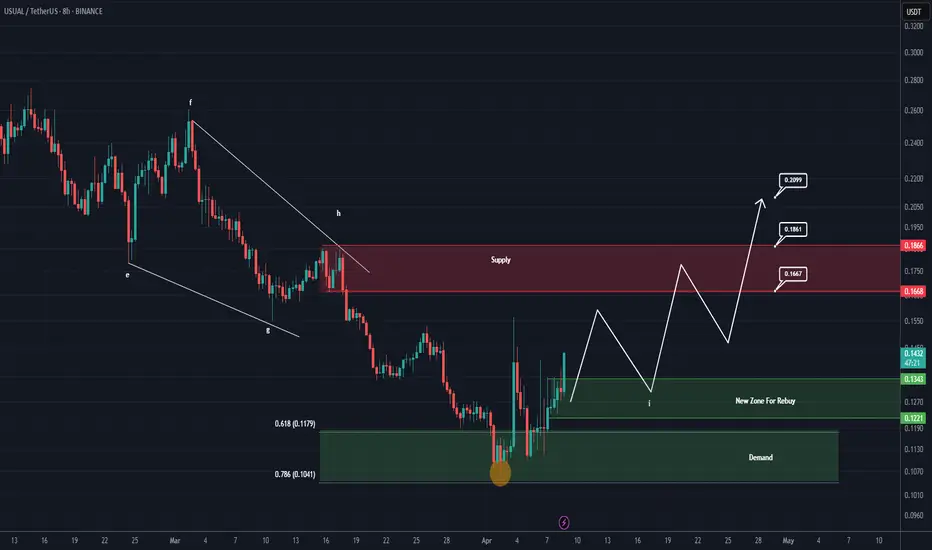
USUAL is waking up - the beginning of a new bullish wave?This analysis is an update of the analysis you see in the "Related publications" section
We previously had accurate analyses of USUAL, correctly identifying the highs and lows.
Based on the type of custom order flow visible on the chart and recent candlestick formations, it seems that the buy orders in the lower green zone have been sufficient to trigger a trend reversal.
We’ve now identified a new zone. the upper green zone. as a rebuy area, where we’ll be looking for buy/long positions.
Targets are marked on the chart.
A daily candle closing below the upper green zone would invalidate this outlook.
For risk management, please don't forget stop loss and capital management
When we reach the first target, save some profit and then change the stop to entry
Comment if you have any questions
Thank You
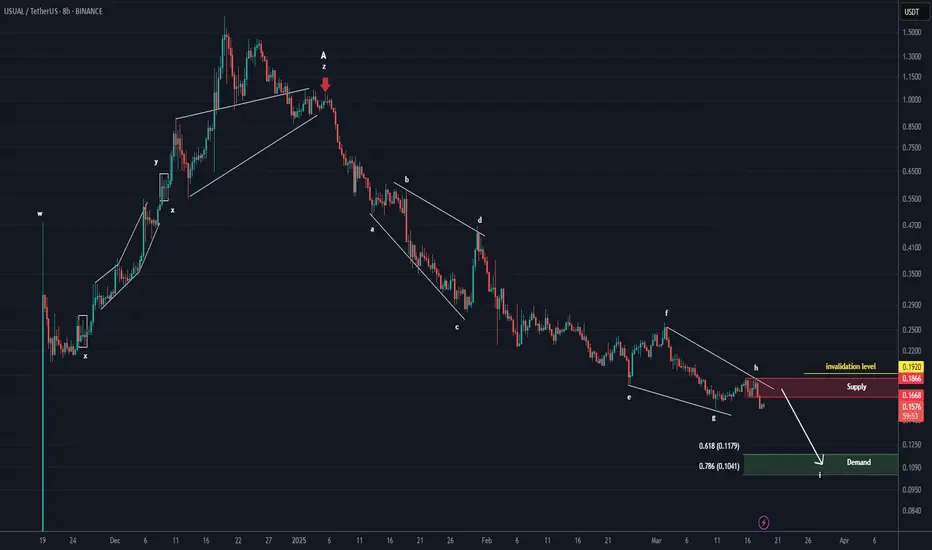
USUAL ANALYSIS (8H)After wave A was completed, from the point where we placed the red arrow on the chart, it seems the price has entered wave B.
Wave B is a bearish symmetrical wave, and it currently appears that we are in the early stages of wave I, which is a bearish wave.
From the supply zone, we expect a rejection towards the Fibonacci levels of wave a to i, which corresponds to the green zone.
A daily candle closing above the invalidation level will invalidate this analysis.
For risk management, please don't forget stop loss and capital management
Comment if you have any questions
Thank You
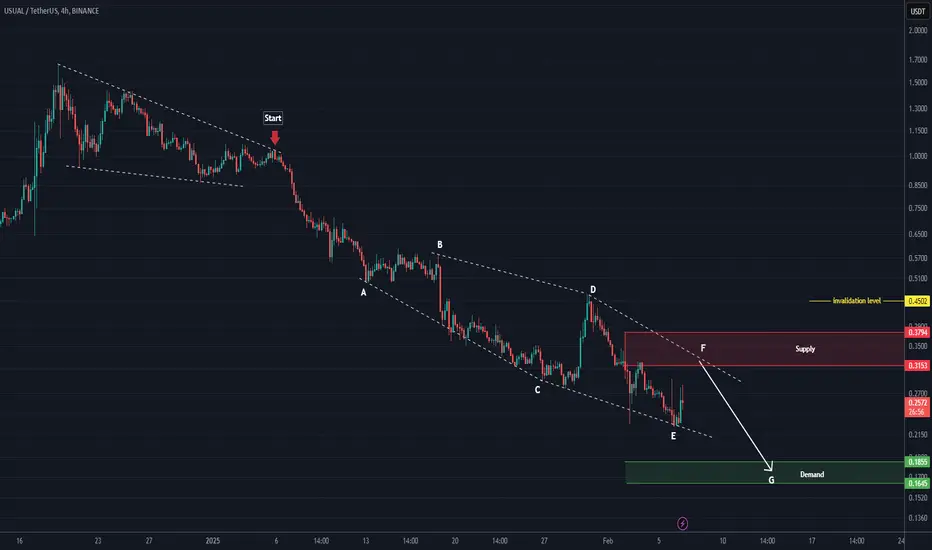
USUAL analysis (4H)It seems that the correction for this asset has started from the point where we placed the red arrow on the chart.
This correction appears to be a diamond-shaped diametric.
Currently, we seem to be in wave F of this diametric. The price may reject downward from the red zone.
A daily candle closing above the invalidation level will invalidate this analysis
For risk management, please don't forget stop loss and capital management
Comment if you have any questions
Thank You
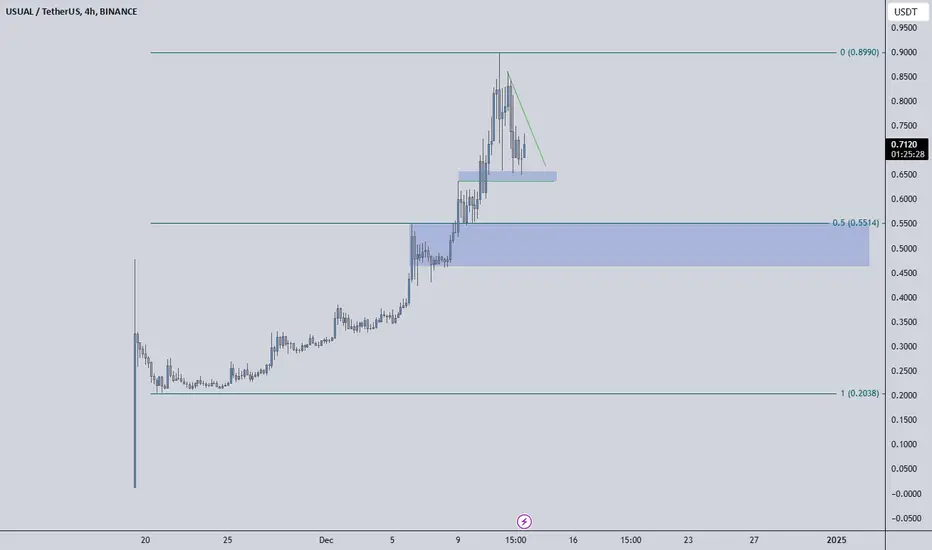
Key Support Holds: USUAL/USDT Eyes a Bullish Breakout USUAL/USDT pair is showing a strong rebound from the key support zone, suggesting a successful retest of the breakout levels. However, the price is currently facing rejection from the descending, narrow resistance zone.
Based on the current setup, we predict a breakout from this zone, potentially leading to further bullish momentum in the coming sessions.

USUAL | UNUSUAL PUMPsUSUAL Suspects: The Stablecoin Revolution Nobody Saw Coming!
After 300% pump lets see whats unusual here
USUAL is like the cool kid of stablecoin projects focused on making secure, decentralized fiat stablecoins while letting the community call the shots. The magic happens with the USUAL token, giving users control over governance. Using multi chain tech, USUAL grabs Real World Assets (RWAs) from big league players like BlackRock and Mountain Protocol, turning them into USD0 a stablecoin that’s on-chain, transparent, and way more trustworthy than your flaky ex.
Why Is USUAL "Unusually" Cool?
1.Multi-Chain Mastery: Plays nice with multiple blockchains, so USD0 isn’t stuck on one network like your grandma’s ancient landline.
2.RWA Wizardry: Collects tokenized real-world assets from legit pros and backs the stablecoin like it’s guarding Fort Knox.
3.Power to the People: Governance is decentralized, meaning you (yes, YOU!) help steer the ship with the USUAL token
4.OnChain Transparency: USD0 is like that one friend who overshares—totally transparent and verifiable, plus it’s compatible with your favorite DeFi apps.
5. Community Takeover:It’s all about the users power, value, and decision-making are in your hands. No middlemen allowed.
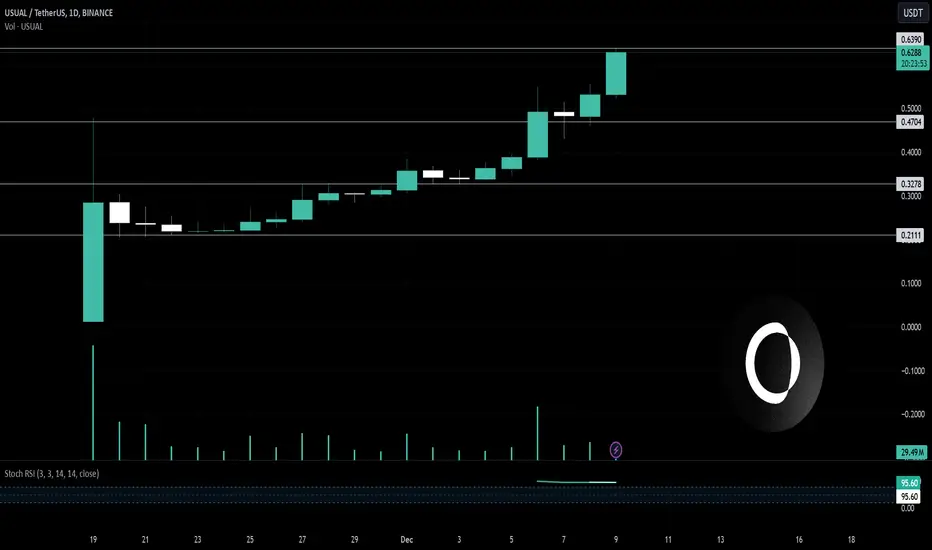
USUAL’s Price Parade
- Today’s Price: $0.603 (up a spicy +23.8% in the last 24 hours).
- All-Time High: $0.632 (Dec 9, 2024 so close, yet so far at -4.57%).
- Supply Stats: 494.6M tokens circulating, with a max supply of 4B tokens.
- Trading Volume: $52.76M in the last 24 hours, traded across 2 markets and 4 exchanges (Binance being the star)
- Market Cap: $299M, grabbing 0.01% of the crypto market pie.
Basically, USUAL is doing the stablecoin hustle while keeping things unusually exciting
USUALUSDT | Buyers Are ActiveBuyer Presence: I believe there are buyers in USUALUSDT, making it a promising addition to my spot trading basket.
Price Reaction:
The price did not get a strong reaction from the blue box, suggesting it might target lower levels.
Buy Strategy:
Despite the lack of a strong response, I find it logical to remain a buyer from both blue boxes, aligning with my overall strategy.
I keep my charts clean and simple because I believe clarity leads to better decisions.
My approach is built on years of experience and a solid track record. I don’t claim to know it all, but I’m confident in my ability to spot high-probability setups.
My Previous Analysis
🐶 DOGEUSDT.P: Next Move
🎨 RENDERUSDT.P: Opportunity of the Month
💎 ETHUSDT.P: Where to Retrace
🟢 BNBUSDT.P: Potential Surge
📊 BTC Dominance: Reaction Zone
🌊 WAVESUSDT.P: Demand Zone Potential
🟣 UNIUSDT.P: Long-Term Trade
🔵 XRPUSDT.P: Entry Zones
🔗 LINKUSDT.P: Follow The River
📈 BTCUSDT.P: Two Key Demand Zones
🟩 POLUSDT: Bullish Momentum
🌟 PENDLEUSDT: Where Opportunity Meets Precision
🔥 BTCUSDT.P: Liquidation of Highly Leveraged Longs
🌊 SOLUSDT.P: SOL's Dip - Your Opportunity
🐸 1000PEPEUSDT.P: Prime Bounce Zone Unlocked
🚀 ETHUSDT.P: Set to Explode - Don't Miss This Game Changer
🤖 IQUSDT: Smart Plan
⚡️ PONDUSDT: A Trade Not Taken Is Better Than a Losing One
💼 STMXUSDT: 2 Buying Areas
🐢 TURBOUSDT: Buy Zones and Buyer Presence