USUAL/USDT — End of Pressure? Breakout or Breakdown Ahead📊 Full Analysis (Daily Chart):
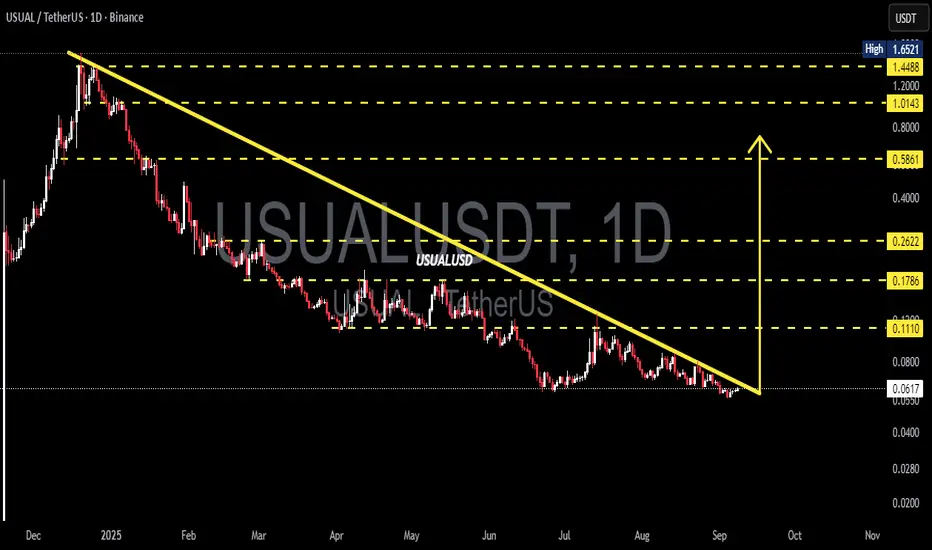
Since peaking around $1.65, USUAL/USDT has remained under heavy selling pressure, forming a clear long-term downtrend with a descending trendline acting as a major resistance. Price is now trading near $0.0614, exactly at the critical $0.05–0.07 support zone.
The structure is shaping into a descending triangle, where price keeps making lower highs while holding a flat support base. This pattern is often seen as a bearish continuation, but if bulls manage to break above the trendline with strong volume, it could trigger a major trend reversal.
---
🔼 Bullish Scenario (Potential Reversal)
Trigger: Daily close above $0.07–0.08 with convincing volume.
Extra confirmation: Successful retest of the broken trendline as new support.
Upside targets:
1. $0.1110 (minor resistance)
2. $0.1786 (mid supply zone)
3. $0.2622 – $0.5861 (major recovery levels if momentum expands).
Risk management: Stop loss below $0.05 to avoid false breakouts.
📌 Interpretation: A breakout could signal the end of prolonged selling, inviting bargain hunters and possibly triggering a short squeeze rally.
---
🔽 Bearish Scenario (Continuation of the Downtrend)
Trigger: Daily close below $0.05 with heavy selling volume.
Downside targets: $0.03 → $0.02 (psychological support levels + measured move projection of the descending triangle).
Risk management: For shorts, stop loss above $0.075–0.08.
📌 Interpretation: If the support base fails, the descending triangle confirms as a bearish continuation pattern, likely driving price to new lows.
---
🔎 Technical Pattern in Play
Descending Triangle: A structure often seen as bearish, but also a potential launchpad if broken upward with volume.
Breakout Case: A strong bullish breakout would flip market sentiment and shift momentum upward.
Breakdown Case: Failure to hold support would accelerate downside pressure.
---
🎯 Trading Outlook
USUAL/USDT is now at a make-or-break level. Price compression between the trendline and support is setting up for a decisive move. Patience is key here — waiting for a daily close with strong volume confirmation is safer than guessing the direction.
Short-term traders may play the current range, while swing traders should wait for a confirmed breakout or breakdown before committing to larger positions.
---
#USUAL #USUALUSDT #CryptoAnalysis #Altcoin #TechnicalAnalysis #Breakout #Bearish #Bullish #DescendingTriangle
USUALUSD
USUALUSDT Ready to Explode? Major Breakout From Downtrend?USUALUSDT is currently displaying a very compelling technical structure on the daily timeframe. After a long downtrend since early 2025, the price is now forming an accumulation pattern with increasing buying pressure.
---
📊 Pattern & Chart Structure Overview:
🔹 Descending Triangle Formation:
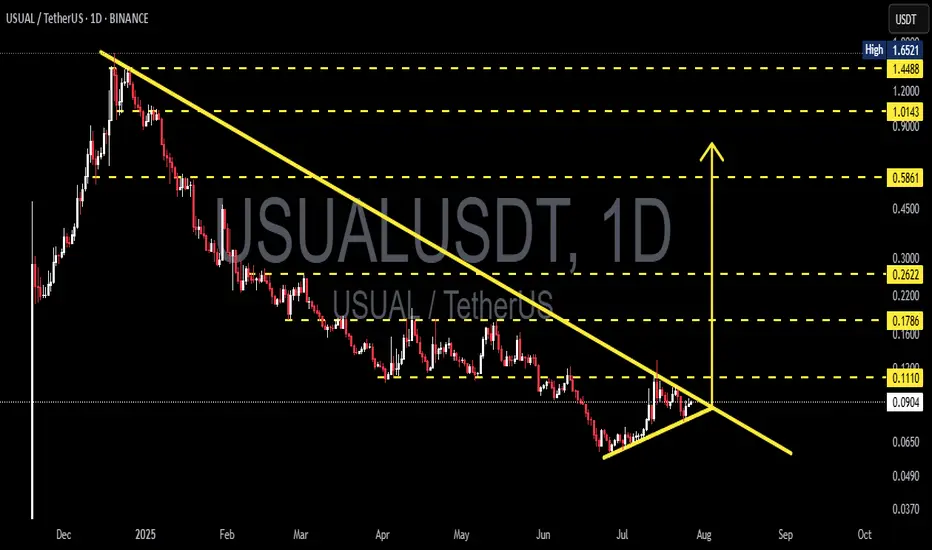
The price has been forming a series of lower highs with a gradually rising base, indicating a classic compression or accumulation pattern that often precedes a major breakout.
🔹 Rising Buying Pressure:
Notice the formation of higher lows since early July—this suggests that buyers are gradually stepping in, despite the macro downtrend still intact.
🔹 Low Volume = High Breakout Potential:
Volume remains relatively low, which is typical in the final stages of consolidation. Once a breakout occurs, it’s likely to be accompanied by a significant spike in volume.
---
🟢 Bullish Scenario (Confirmed Breakout):
If the price breaks above the descending trendline (~0.1110) with a strong daily candle and increased volume, it may ignite a bullish move with the following targets:
🎯 Upside Targets:
1. 0.1786 – Previous consolidation resistance
2. 0.2622 – Psychological zone and prior seller control area
3. 0.5861 – Medium-term target if momentum builds
4. 1.0143 and 1.4488 – Long-term bullish targets upon full trend reversal
🚀 The upside potential is massive as the price has a lot of room above once resistance is broken.
---
🔴 Bearish Scenario (Failed Breakout):
If the price gets rejected at the descending resistance and breaks down below the ascending support:
📉 Downside Targets:
1. 0.0650 – Minor support from July's accumulation zone
2. 0.0490 – 0.0370 – Previous cycle lows and potential bounce zones
⚠️ A breakdown would invalidate the current accumulation setup and suggest sellers still dominate.
---
🔍 Conclusion & Strategy:
USUALUSDT is now at a critical decision zone. The combination of a descending triangle, rising higher lows, and low volume makes it clear that a major move is brewing.
📌 Breakout = Big swing trade opportunity
📌 Breakdown = Avoid entries, wait for lower support zones
---
📈 Trader Recommendations:
✅ Set alerts above 0.1110
✅ Confirm breakout with strong candle + volume
✅ Aggressive stop loss below 0.0750
✅ Swing trade targets based on historical resistance & fib levels
#USUALUSDT #CryptoBreakout #AltcoinSetup #DescendingTriangle #CryptoAnalysis #BullishSetup #BearishSetup #BreakoutIncoming #TechnicalAnalysis
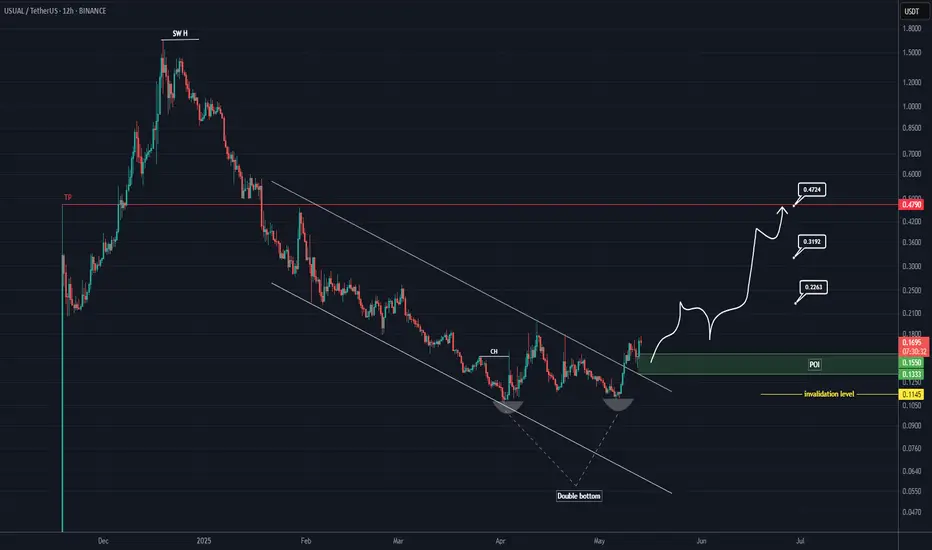
USUAL Looks Bullish (12H)A double bottom pattern has formed on the chart, leading to a breakout from the price channel.
A support zone has been established, and a bullish CH has appeared on the chart.
Considering the breakout and the bullish structure, we can set up a buy position on this coin.
Targets are marked on the chart, and reaching the third target is also possible.
The invalidation of this setup will occur if a daily candle closes below the invalidation level.
For risk management, please don't forget stop loss and capital management
When we reach the first target, save some profit and then change the stop to entry
Comment if you have any questions
Thank You
USUALUSDT 1D Analysis USUAL ~ 1D Analysis
#USUAL Buy gradually from here with a short term target of at least 15%+ from here. These are the early signs when whales start to accumulate.

USUAL is waking up - the beginning of a new bullish wave?This analysis is an update of the analysis you see in the "Related publications" section
We previously had accurate analyses of USUAL, correctly identifying the highs and lows.
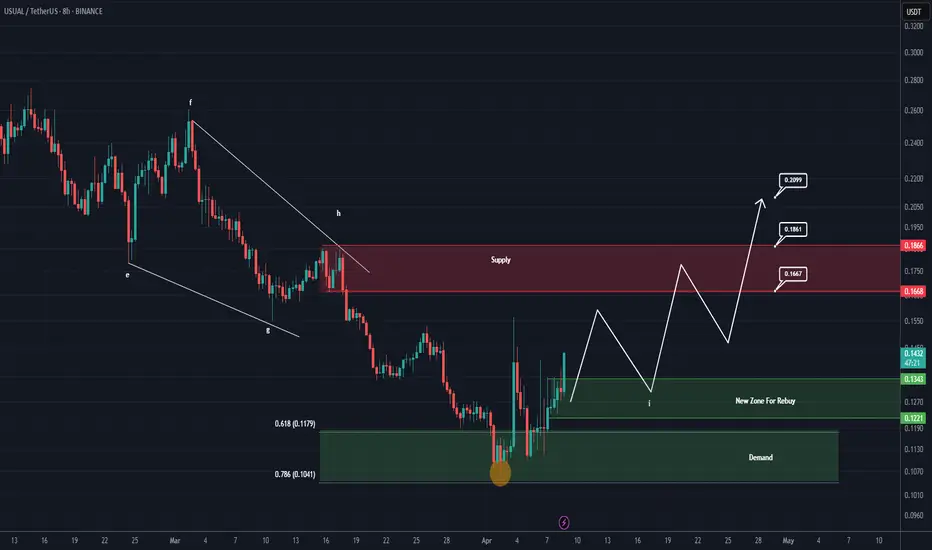
Based on the type of custom order flow visible on the chart and recent candlestick formations, it seems that the buy orders in the lower green zone have been sufficient to trigger a trend reversal.
We’ve now identified a new zone. the upper green zone. as a rebuy area, where we’ll be looking for buy/long positions.
Targets are marked on the chart.
A daily candle closing below the upper green zone would invalidate this outlook.
For risk management, please don't forget stop loss and capital management
When we reach the first target, save some profit and then change the stop to entry
Comment if you have any questions
Thank You
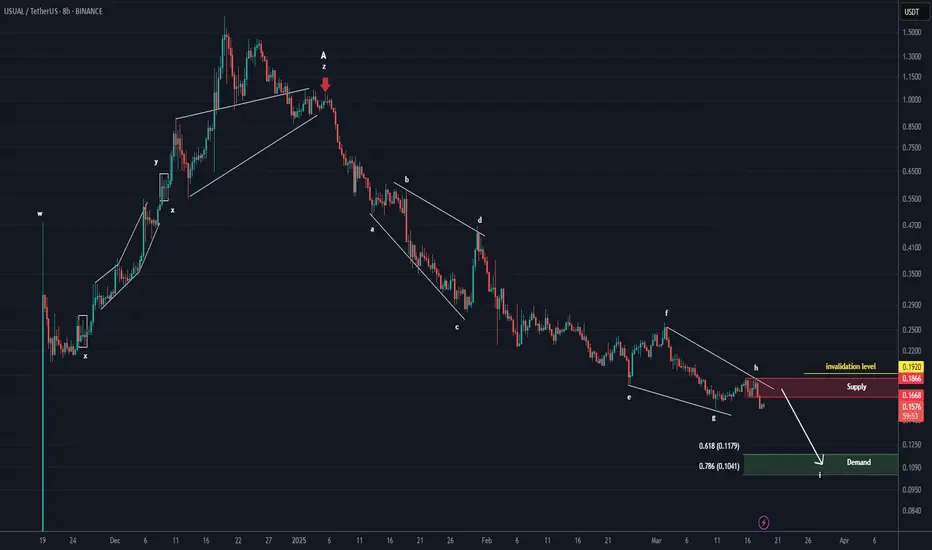
USUAL ANALYSIS (8H)After wave A was completed, from the point where we placed the red arrow on the chart, it seems the price has entered wave B.
Wave B is a bearish symmetrical wave, and it currently appears that we are in the early stages of wave I, which is a bearish wave.
From the supply zone, we expect a rejection towards the Fibonacci levels of wave a to i, which corresponds to the green zone.
A daily candle closing above the invalidation level will invalidate this analysis.
For risk management, please don't forget stop loss and capital management
Comment if you have any questions
Thank You
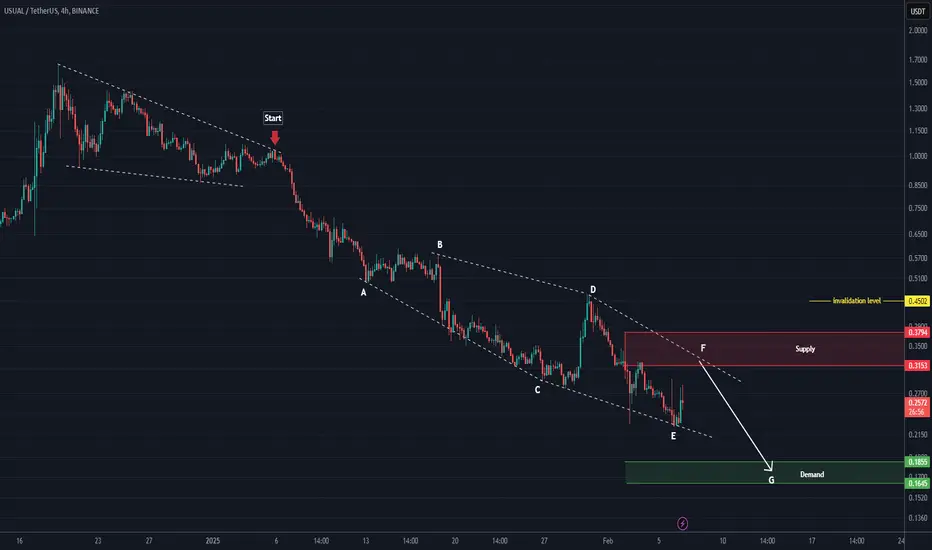
USUAL analysis (4H)It seems that the correction for this asset has started from the point where we placed the red arrow on the chart.
This correction appears to be a diamond-shaped diametric.
Currently, we seem to be in wave F of this diametric. The price may reject downward from the red zone.
A daily candle closing above the invalidation level will invalidate this analysis
For risk management, please don't forget stop loss and capital management
Comment if you have any questions
Thank You