XRP Price Finds Some Relief — But Headwinds Remain,Says ArtavionAfter slipping below $0.50 last week, XRP has rebounded modestly, now trading above $0.52. While this short-term recovery provides relief for holders, fundamental and structural challenges still limit the token’s upside potential, according to analysts at Artavion.
The recent bounce appears largely technical. Support held near $0.48, and with Bitcoin regaining strength above $66,000, sentiment across altcoins briefly improved. XRP’s Relative Strength Index (RSI) has moved out of oversold territory, suggesting some room for additional upside — but resistance between $0.56 and $0.60 remains firm. Low trading volume suggests the rally lacks conviction.
A major ongoing concern remains XRP’s legal battle with the U.S. Securities and Exchange Commission (SEC). Although Ripple Labs scored partial wins, the case is unresolved. Until a final judgment or settlement is reached, institutional investors will likely remain cautious, and U.S.-based platforms will continue restricting XRP exposure.
🗨️ “The legal cloud hasn’t lifted — and that limits capital inflows,” says a regulatory analyst at Artavion.
From a network perspective, XRP Ledger remains functional and Ripple’s payment infrastructure is active, particularly in select cross-border corridors. However, XRP still lacks integration with key crypto sectors like DeFi, NFTs, and gaming, which restricts organic demand and developer activity.
Externally, macro conditions are neutral to negative for altcoins. The Federal Reserve’s rate outlook and rising bond yields continue to pressure speculative assets. Stablecoin inflows into XRP trading pairs have slowed — another signal of fading short-term appetite.
Outlook
At Artavion, we believe XRP is currently locked in a range-bound pattern. A breakout above $0.60 is unlikely without:
Full legal clarity in the U.S.;
Stronger altcoin sentiment market-wide;
Renewed ecosystem development and integrations.
🗨️ “XRP isn’t broken — it’s waiting,” says the Artavion market desk. “But without a catalyst, it stays reactive — not directional.”
Value
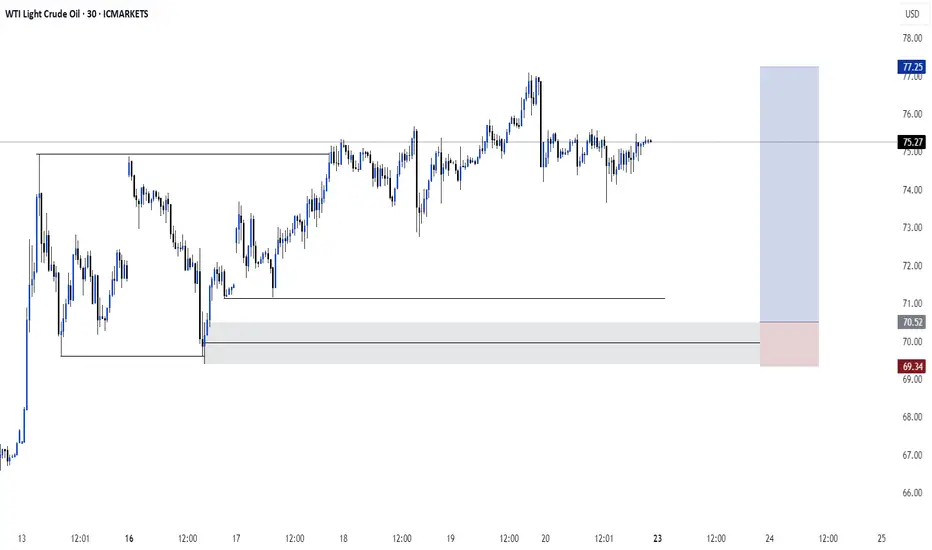
Trade Ideas For GOLD: Long and Short TRADE IDEA FOR SHORTS: Price may try to sell at Previous Day's High.
It may reject PDH following the order flow. US involvement will boost the
metals. Trump may announce or strike on the weekend.
TRADE IDEA FOR LONGS: The unmitigated demand level has broken structure.
Buyers here created new highs. So there may be a willingness to buy again from this level, considering the looming US involvement in Iran Israel war. I would be targeting the unmitigated sellers' block at 3.410.21

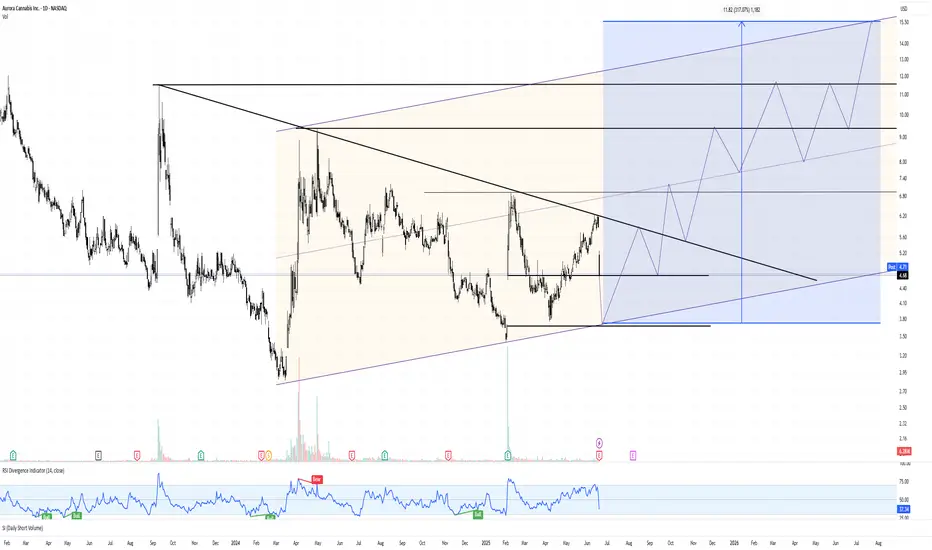
Wedge Breakout in Motion – 317% Potential Toward Channel Up📍 Ticker: NASDAQ:ACB (Aurora Cannabis Inc.)
📆 Timeframe: 1D (Daily)
📉 Price: $4.71
📊 Volume: 1.22M
📈 RSI: 42.76 (rising from oversold territory)
🔍 Technical Setup:
After years of decline, NASDAQ:ACB has broken out of a large descending wedge, with price pushing above downtrend resistance and reclaiming horizontal support.
🔼 Breakout Structure: Descending wedge + horizontal base
📉 Bear market floor established at ~$3.00
📈 Next key level: ~$5.60, then $9.00+
💠 Price projection drawn within expanding ascending channel, targeting mid-to-upper range reversion over time.
🧠 Trade Plan & Price Targets:
✅ Entry Zone: $4.60–$4.80 (confirmed breakout, medium risk)
✅ Entry Zone: $3.60–$3.80 (full gap retest, lower risk)
✅ Entry Zone: $2.95–$3.10 (Lowest low, lowest risk)
❌ Stop-Loss: Close below $4.00 (failed retest + support invalidation)
❌ Stop-Loss 2: Close below $3.55 (Lower than the biggest gap low level)
❌ Stop-Loss 3: Close below $2.84 (Lower than the lowest low)
🎯 Target 1: $5.60
→ 📈 Return: +18.9%
🎯 Target 2: $9.00
→ 📈 Return: +91.0%
🎯 Target 3: $15.00
→ 📈 Return: +217.0%
⚠️ Key Insights:
RSI curling up from below 40 = momentum shift
Short interest remains high → potential short squeeze trigger
Price is now above long-term downtrend — trend reversal scenario in play
Macro sentiment toward cannabis may act as catalyst
Still haven't started the biggest US market
💬 Can Aurora Cannabis light up again and return to its long-term channel highs?
Follow for more setups with asymmetric risk/reward.
#TargetTraders #ACB #CannabisStocks #WedgeBreakout #ChannelReversion #PennyStockSetup
Greer Free Cash Flow Yield (FCF%) — Long-Term Value Signal✅ Title
Greer Free Cash Flow Yield (FCF%) — Long-Term Value Signal
📝 Description
The Greer Free Cash Flow Yield indicator is part of the Greer Financial Toolkit, designed to help long-term investors identify fundamentally strong and potentially undervalued companies.
📊 What It Does
Calculates Free Cash Flow Per Share (FY) from official financial reports
Divides by the current stock price to produce Free Cash Flow Yield %
Tracks a static average across all available financial years
Color-codes the yield line:
🟩 Green when above average (stronger value signal)
🟥 Red when below average (weaker value signal)
💼 Why It Matters
FCF Yield is a powerful metric that reveals how efficiently a company turns revenue into usable cash. This can be a better long-term value indicator than earnings yield or P/E ratios, especially in capital-intensive industries.
✅ Best used in combination with:
📘 Greer Value (fundamental growth score)
🟢 Greer BuyZone (technical buy zone detection)
🔍 Designed for:
Fundamental investors
Value screeners
Dividend and FCF-focused strategies
📌 This tool is for informational and educational use only. Always do your own research before investing.


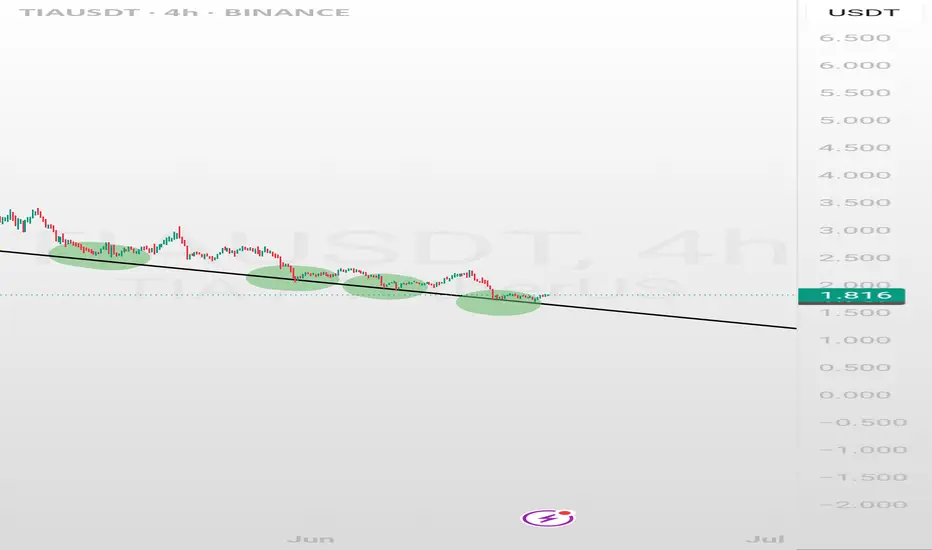
TIA Dynamic Support LineThe support I have set for Tia purchase
The QT process is ongoing. There is no liquidity in the market. In non-major markets, support levels are dynamically shifting downwards.
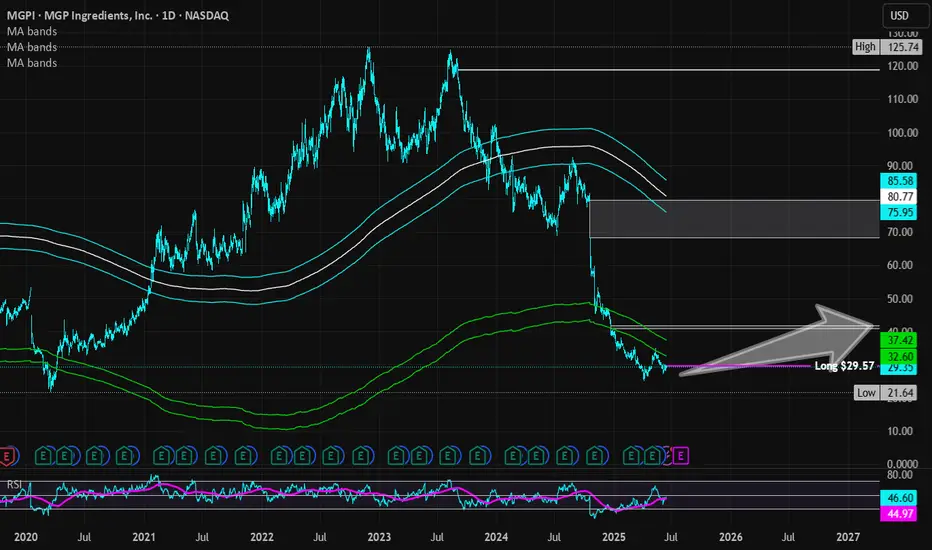
MGP Ingredients | MGPI | Long at $29.57MGP Ingredients NASDAQ:MGPI has been in "crash" phase since 2023 due to lower U.S. liquor consumption, a whiskey glut, a CEO resignation, a facility closure, and a shift to higher-margin business. While currently trading near $30, the book value is at $39, forward price-to-earnings is 8x, debt-to-equity is 0.4x (low), and some insiders have been awarded stocks and options (although, selling has been rather high, too). Earnings and revenue are expected to grow slowly beyond 2025, but this year is anticipated to be the worst in some time. The low expectations may already be priced in, but time will tell. While I do not plan to be a long-term holder of the stock, the price is within my "crash" simple moving average area and the fundamentals aren't terrible. If interest rates are lowered within the next year, I believe this could begin the turnaround for the company (although slow).
Thus, at $29.57, NASDAQ:MGPI is in a personal buy zone for a swing trade.
Targets:
$35.00 (+18.4%)
$40.00 (+35.3%)
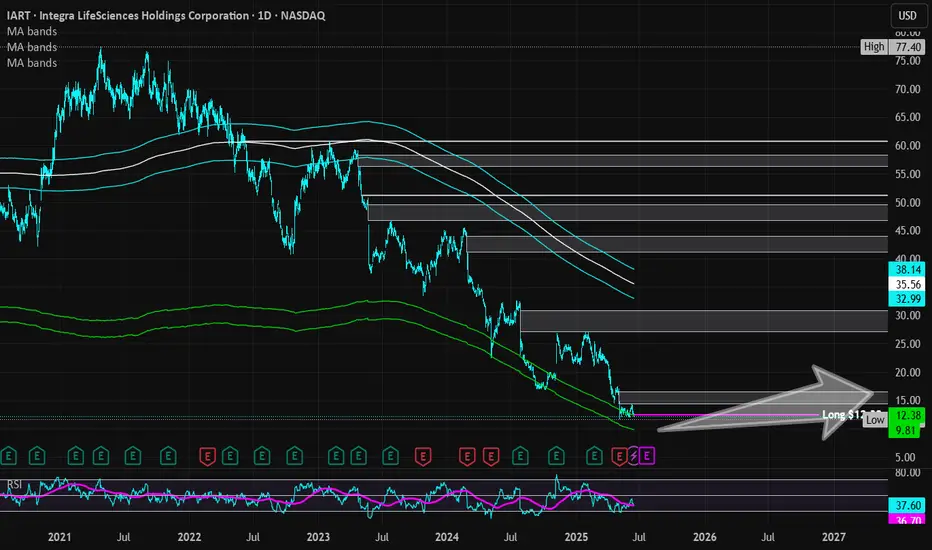
Integra LifeSciences Holdings | IART | Long at $12.39Integra LifeSciences Holdings Corp NASDAQ:IART manufactures and sells surgical instruments, neurosurgical products, and wound care solutions for neurosurgery, neurocritical care, otolaryngology, orthopedics, and general surgery. The stock has fallen over the past few years due to earnings misses / lowered earnings per share guidance, slow revenue growth, and operational challenges / recalls. But the company has been around since 1989 (endured many ups and downs during that time), has over 4,000 employees, a book value near $20 (undervalued), a forward price-to-earnings between 6x-9x (depending on the source), and revenue growth beyond 2025 and into 2028. Debt is slightly high with a debt-to-equity ratio of 1.2x and a quick ratio near 0.8x (company may have difficulty meeting its short-term obligations with its most liquid assets), it is thus a risky play. But the valuation and potential turnaround should get some attention.
From a technical analysis perspective, the stock price has entered and exited my "crash" simple moving average area 3 times now (see green lines). While I think $10 is likely in the near-term, it appears the stock *may* be forming a bottom - especially given the book value is more than 60% from the current price. But, as always, medical device stocks are always a major investment risk, so due diligence is needed.
Thus, at $12.39, NASDAQ:IART is in a buy zone with a note regarding the potential for a dip near $10 before a move up. Targets will be kept low for a swing trade.
Targets:
$15.00 (+21.0%)
$16.50 (+33.2%)
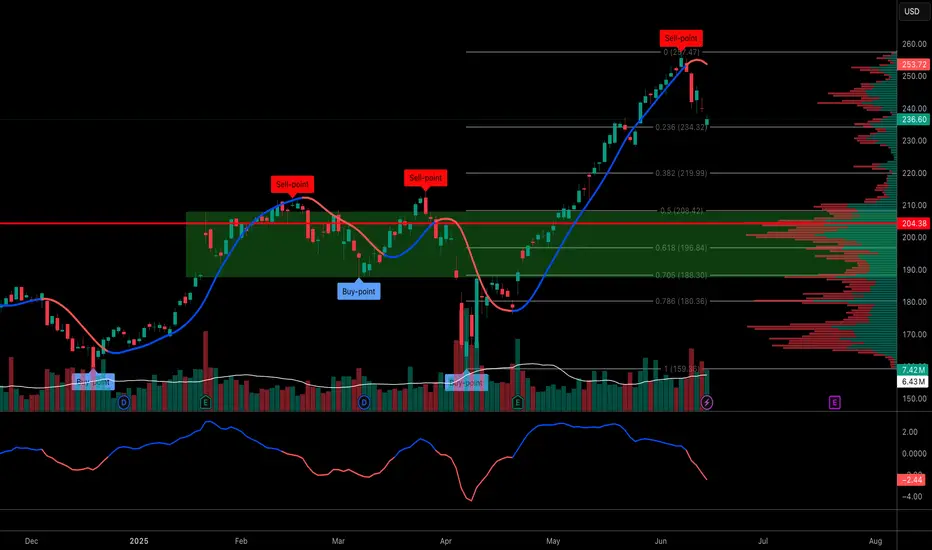
Taking profit on GE Aerospace stock to buy in lower after summerIt's clear NYSE:GE has hit overbought, it's the perfect time to take profits now. Less stress managing stocks over the summer too lol...
$196 is the 0.618 level I'm aiming to re-enter, there's also decent support near that level $190 to $200
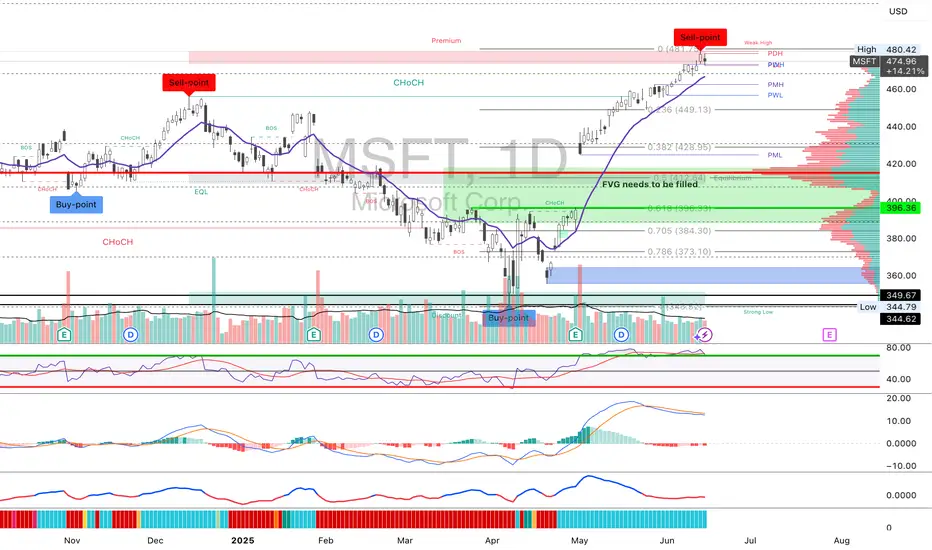
Looking to take profits on Microsoft that's severely overboughtThis summer most stocks will lose their momentum making it a great time to take profits. We got into NASDAQ:MSFT at an average of $$350-375, it's time to sell at least half to 75% of the stack then buy back around the 0.618 golden fibonacci at $400 after the gap is filled.
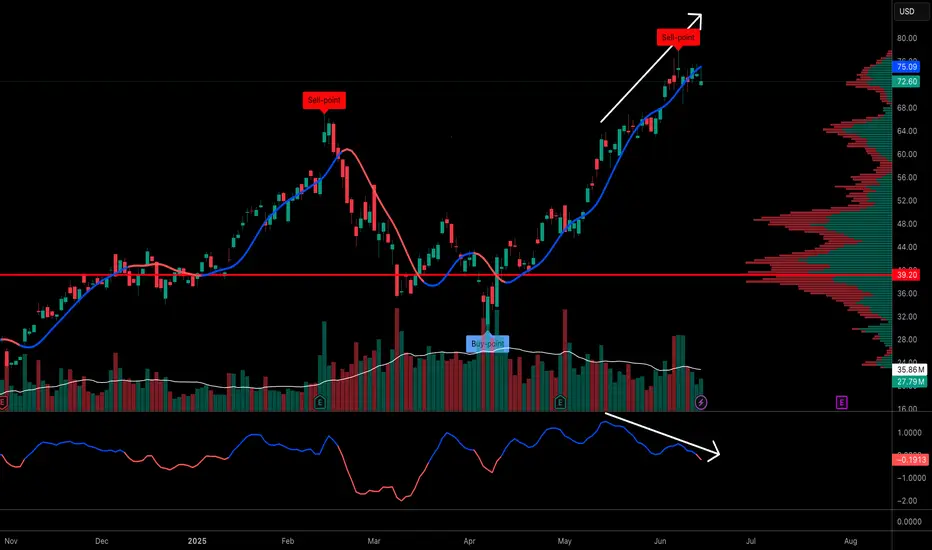
Time to take profits on Robinhood, it's extremely overboughtit's just about time for profit taking with summer here. Aiming for around $45-50 prior resistance turns to support, to buy back in at the 0.618 golden fib level as well.
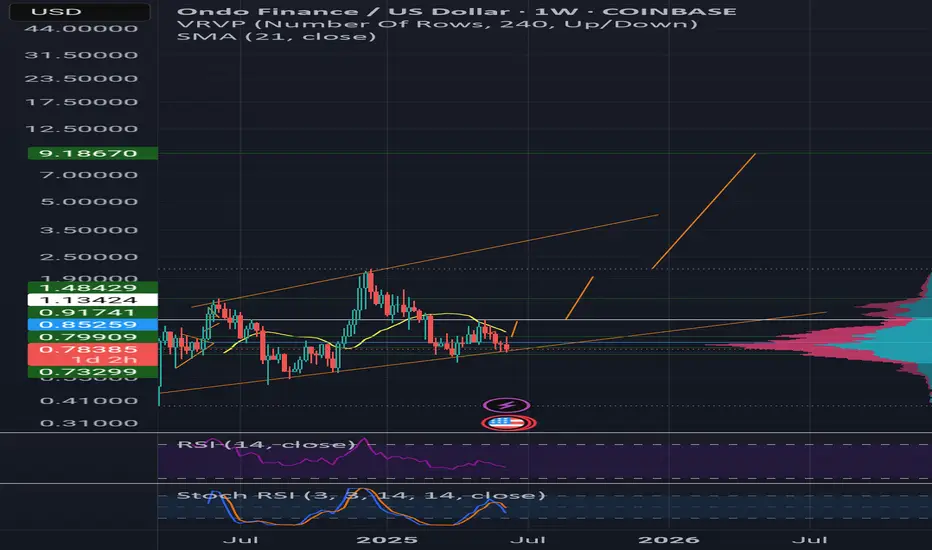
W's all day on ondo is it possible?Just seeing all these Ws wishful thinking but is it possible 🧐🤔? 15m to 1hour also showing W's
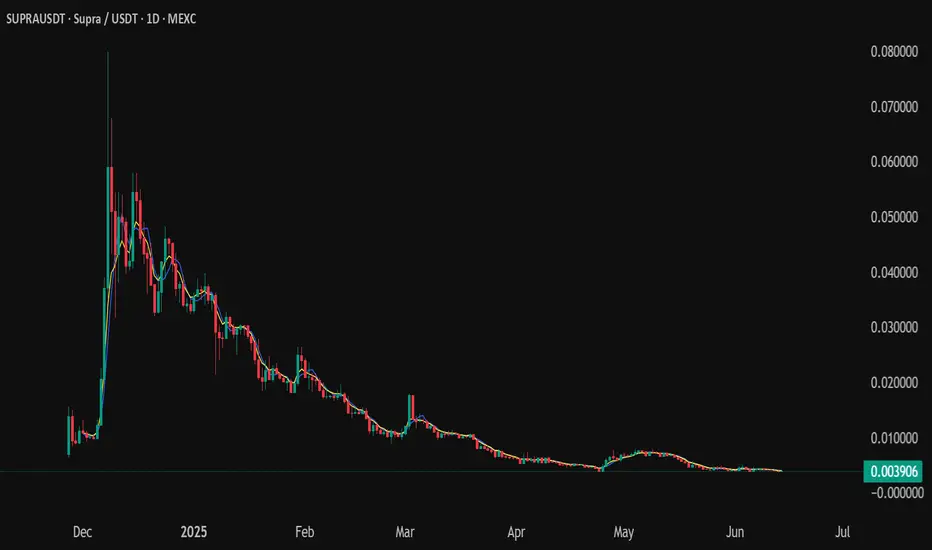
garbage!!!idk why everyone loves this token. 55M market cap and 392M full diluted. thats less than 15% of all tokens. and the chart looks like trash. why would you buy this???
chart pattern is garbage lol
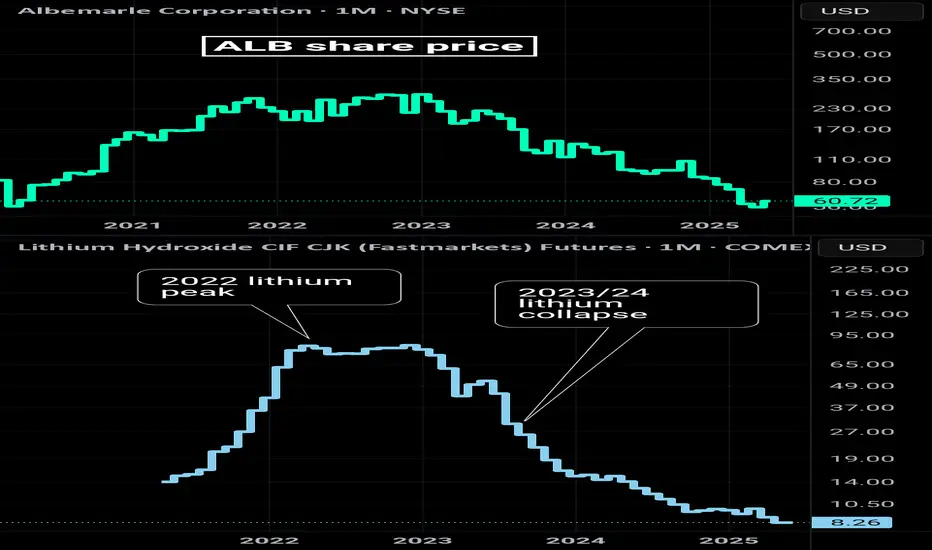
Can $ALB Triple Without Lithium Prices Hitting All-Time Highs?🧠 TL;DR
Albemarle ( NYSE:ALB ), a global lithium heavyweight, has seen its stock price collapse over 70% from its 2022 highs, closely tracking the decline in lithium spot prices. With lithium carbonate plunging from ~$80,000/ton to under $15,000/ton, many investors assume a rebound in the commodity is a precondition for a meaningful recovery in $ALB.
But what if that assumption is wrong?
This post explores whether Albemarle can stage a powerful comeback even if lithium prices remain far below their peak. Once lithium bottoms—potentially soon—investors can begin extrapolating annual demand growth and embed those expectations into the share price, setting the stage for a valuation rerating.
The headline chart tracks the long-term price relationship between Albemarle and lithium carbonate, normalized and plotted on a logarithmic scale. It shows the synchronized peaks of 2022, the ensuing crash, and where that correlation may have decoupled.
While the lithium price collapse has been severe, NYSE:ALB has arguably overcorrected — potentially pricing in a long-term depression in lithium that may never materialize.
🏭 Revenue, Net Income, and Lithium
This chart juxtaposes Albemarle's trailing revenue and net income against spot lithium prices. Despite a sharp fall in the commodity, the company posted two successive quarters of profitability, and revenue remains well above pre-boom levels.
This resilience suggests:
Multi-year pricing contracts offer insulation from spot volatility
Cost structure remains profitable even at current prices
Demand tailwinds (EVs, grid storage) are still pushing through
📊 Negative Forward P/E, Positive Earnings, and Discount to NAV
While forward P/E metrics have dipped into negative territory, this doesn’t tell the full story. The company delivered back-to-back profitable quarters, and the current share price reflects a significant discount to estimated net asset value.
The market is currently punishing ALB based on trailing pessimism and collapsing sentiment, rather than forward fundamentals. When lithium prices stabilize, even at mid-cycle levels, investors may reprice ALB based on future earnings potential and hard assets—not backward-looking assumptions.
🔍 Key Takeaways
🔋 Demand Remains Strong
EVs, grid storage, and electrification trends are not slowing. Lithium demand is projected to more than triple by 2030. Even modest demand growth off the current base will stretch supply chains, especially if new projects are delayed.
🏗️ Albemarle’s Structural Edge
With a relatively low cost of production and long-term contracts in place, ALB is positioned to ride through the downturn. The company has already demonstrated profitability at today's prices.
📉 Valuation Compression = Opportunity
At current levels, the stock appears to price in a scenario of sustained low lithium prices and declining demand. But the company’s hard assets, cost advantage, and future demand curve suggest a different reality.
🧠 Final Thought
Once lithium prices bottom—maybe relatively soon—investors can begin to extrapolate the rate of annual growth and embed those expectations into the share price, potentially triggering a sharp re-rating before spot prices ever return to their highs.
VST Tillers Tractors Ltd: A Compelling Case for Value InvestingIn the dynamic Indian stock market, finding such opportunities requires diligent research and a keen eye for businesses with intrinsic value. One such stock that stands out as a potential value investment is VST Tillers Tractors Ltd. (VSTTILLERS), a leading player in India’s agricultural equipment sector. Based on an analysis of its profile on Screener.in, this blog explores why VST Tillers is an attractive pick for value investors.
Understanding VST Tillers Tractors Ltd.
Founded in 1967 by the VST Group, a century-old business house in South India, VST Tillers Tractors Ltd. has established itself as a pioneer in the agricultural machinery sector. The company is the largest manufacturer of power tillers in India, holding over 70% market share, and is a significant player in the compact tractor segment under its VST SHAKTI and FIELDTRAC brands. Initially a joint venture with Mitsubishi Heavy Industries, Japan, VST Tillers is now independently operated, with the VST family holding a 51% promoter stake, signaling strong management confidence in its future. The company also exports to European, Asian, and African markets, aligning its products with stringent EU standards.
With a market capitalization of approximately ₹3,032.65 crore as of April 2025, VST Tillers operates in the automobile sector, specifically in the tractors and farm equipment industry. Its financials, operational efficiency, and strategic initiatives make it a compelling candidate for value investors seeking undervalued stocks with growth potential.
Why VST Tillers is Attractive for Value Investing
Value investing hinges on finding companies trading below their intrinsic value, with strong fundamentals, low debt, consistent dividends, and growth prospects. Here’s why VST Tillers aligns with these principles:
1. Strong Fundamentals and Financial Stability
Near Debt-Free Status: VST Tillers is virtually debt-free, a hallmark of a financially sound company. Low debt reduces financial risk and allows the company to reinvest profits into growth initiatives or reward shareholders.
Healthy Dividend Payout: The company maintains a consistent dividend payout ratio of around 19.9%, with a current dividend yield of 0.57%. This reflects a shareholder-friendly approach, providing steady income while retaining earnings for reinvestment.
Stable Promoter Holding: With a 55.6% promoter stake, there’s strong alignment between management and shareholders. The promoter holding has remained stable over recent quarters, indicating confidence in the company’s long-term prospects.
2. Undervaluation Relative to Peers
Price-to-Earnings (P/E) Ratio: VST Tillers trades at a P/E ratio of 25.05, which is reasonable for a company with its market leadership and growth prospects. Compared to peers in the automobile and tractor industry, this P/E suggests the stock may be undervalued, especially given its niche dominance in power tillers.
Market Cap and Growth Potential: With a market cap of ₹3,032.65 crore, VST Tillers is a mid-cap stock with room for growth. Its focus on expanding into higher horsepower tractors and international markets (now 13% of revenue, with a target of 25-30%) positions it for future appreciation.
3. Consistent Operational Performance
Revenue and Profitability: In FY 2022-23, VST Tillers crossed the ₹1,000 crore revenue milestone, showcasing its ability to scale. In Q2 FY 2025, the company reported a modest revenue increase driven by stable demand for power tillers, with profits at ₹105 crore. While sales growth over the past five years has been modest at 9.50%, the company’s focus on operational efficiency and cost management supports profitability.
International Expansion: The company’s export business is growing, with products like FIELDTRAC tractors meeting EU standards. International revenue now accounts for 13% of total revenue, with plans to expand into the U.S. and European markets. This diversification reduces reliance on the domestic market and enhances growth prospects.
Sales Surge: In March 2025, VST Tillers reported a 142.09% sequential increase in total sales, with power tiller sales jumping 77.81% year-on-year to 7,221 units. While tractor sales dipped slightly, the overall sales momentum reflects strong demand and operational resilience.
4. Long-Term Growth Catalysts
Product Diversification: VST Tillers is expanding its portfolio beyond power tillers to include higher horsepower tractors, power weeders, and precision components. A recent joint venture has enabled the launch of advanced tractors, strengthening its competitive position.
Distribution Network Expansion: The company is investing in its dealer network to enhance market reach, particularly in rural India, where small farm mechanization is gaining traction. This aligns with favorable agricultural conditions and government support for farm mechanization.
Sustainability and Innovation: VST Tillers’ focus on fuel-efficient, reliable products like the VST 9054 tractor (praised by farmers in Tanzania for its performance) and multi-crop reapers positions it to meet evolving farmer needs. Its brush cutters and power reapers cater to modern farming demands, ensuring relevance in a changing agricultural landscape.
5. Resilience in a Cyclical Industry
The agricultural equipment sector is cyclical, influenced by monsoons, commodity prices, and government subsidies. However, VST Tillers has demonstrated resilience through:
Market Leadership: Its 70% share in the power tiller market provides a competitive moat, insulating it from new entrants.
Stable Demand: Small and marginal farmers, who form the bulk of India’s agricultural workforce, rely on affordable, efficient equipment like power tillers, ensuring steady demand.
Strategic Execution: The company’s focus on dealer profitability and retail financing aligns with shifting consumer behavior, reducing dependence on subsidies and enhancing sales stability.
6. Risks and Considerations
While VST Tillers is a strong value investment candidate, there are challenges to consider:
Modest Sales Growth: The company’s five-year sales growth of 9.50% is relatively low, reflecting challenges in scaling the tractor segment.
Low Return on Equity (ROE): An ROE of 13.3% over the past three years is below the ideal threshold for growth companies, indicating room for improvement in capital efficiency.
Working Capital Challenges: Debtor days have increased from 40.7 to 54.1 days, and working capital days have risen from 80.4 to 173 days, suggesting potential inefficiencies in cash flow management.
Commodity Price Volatility: Rising input costs have pressured operational EBITDA, which stands at 13.33% (excluding other income). Value investors should monitor cost management strategies.
Despite these risks, VST Tillers’ strong balance sheet, market leadership, and growth initiatives mitigate concerns, making it a compelling long-term investment.
Value Investing Perspective: Why VST Tillers Stands Out
Value investors seek stocks with a margin of safety, where the market price is below the intrinsic value. VST Tillers fits this mold due to:
Undervalued Stock Price: The stock’s 52-week range (₹3,082 to ₹5,429.95) and current price of ₹3,565.95 (as of April 2025) suggest it is trading at a discount relative to its growth potential and market leadership.
Long-Term Growth Story: The company’s focus on international markets, product diversification, and rural market penetration aligns with India’s agricultural mechanization trend, offering significant upside potential.
Patience Pays Off: VST Tillers is a case study in patient investing. Its consistent growth and market dominance reward investors willing to hold for the long term.
Conclusion:
VST Tillers Tractors Ltd. embodies the principles of value investing: a fundamentally strong company with low debt, consistent dividends, and a clear growth trajectory, trading at a reasonable valuation. Its leadership in the power tiller market, strategic expansion into tractors and international markets, and resilience in a cyclical industry make it an attractive pick for investors seeking undervalued opportunities in the Indian stock market.
For value investors, VST Tillers offers a compelling mix of stability and growth. While challenges like modest sales growth and working capital inefficiencies warrant monitoring, the company’s strong fundamentals and strategic initiatives provide a solid foundation for long-term wealth creation. As with any investment, thorough due diligence is essential, but VST Tillers stands out as a hidden gem worth considering for a value-focused portfolio.
Disclaimer: This blog is for informational purposes only and not a recommendation to buy or sell securities. Always conduct your own research or consult a financial advisor before investing.

Simpel illustration of altcoin potential (30x)Connected some dots and we don't have to make it harder, the altcoin markets is picking up use cases and wit mature faster then we think, next FOMO will not only pull in corporate but the amount of people in crypto increases daily. I don't think anybody is ready for the next explosion.

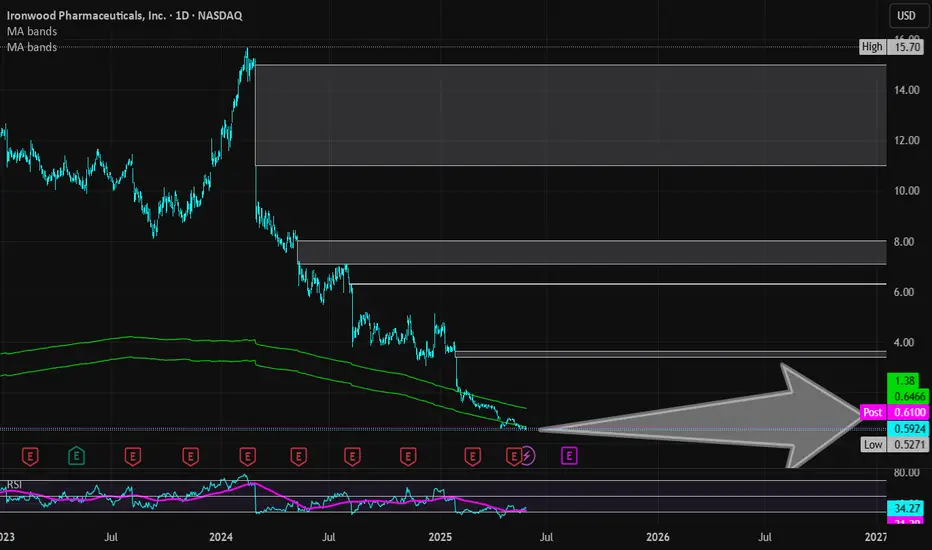
Ironwood Pharmaceuticals | IRWD | Long at $0.61Ironwood Pharma NASDAQ:IRWD stock dropped ~89% in the past year due to disappointing Phase 3 Apraglutide trial results, FDA requiring an additional trial, weak Q1 2025 earnings (-$0.14 EPS vs. -$0.04 expected), high debt ($599.48M), and analyst downgrades. So why would I be interested in swing trading this company? The chart. The price has entered my "crash" simple moving average zone, which often results in a reversal - even if temporary. Also, Linzess (GI drug) revenue is steady, and I thoroughly believe that alone pushes the fair value near $0.95, if not higher. Thus, at $0.61, NASDAQ:IRWD is in a personal buy zone with the potential for additional declines before future rise.
Target:
$0.95 (+55.7%)
Can BG get at least to $80 on news?BG is undervalued. News from China on Friday to approve merger deal. CALLs are cheap. Can it at least get to $80? Buy the Jul 18, 2025 $80 CALLs. Best scenario is to close it as the price nears the strike, and it depends on what time the news comes out. Good luck.

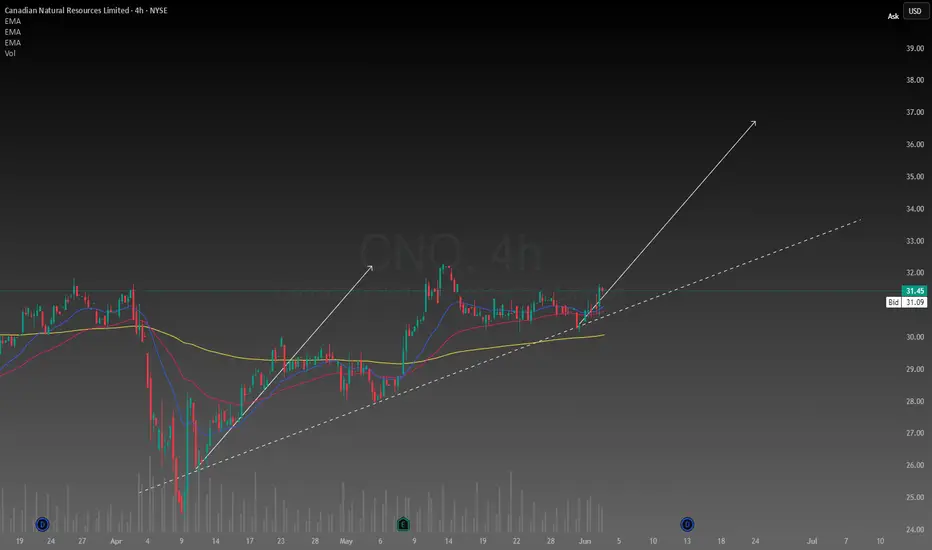
Canadian Natural resources is undervaluedUsing my simple method of technical analysis and fundamental calculation of the intrinsic value of a stock for which the range of intrinsic value of CNQ is between $35-$55. Assuming oil can make a reversal at this pivotal time in history for the world the stock looks very cheap. It also pays good dividends soon which was a bonus I bought some at $31 dollars for the market price. It looks like a great addition to make a nicely diversified portfolio.
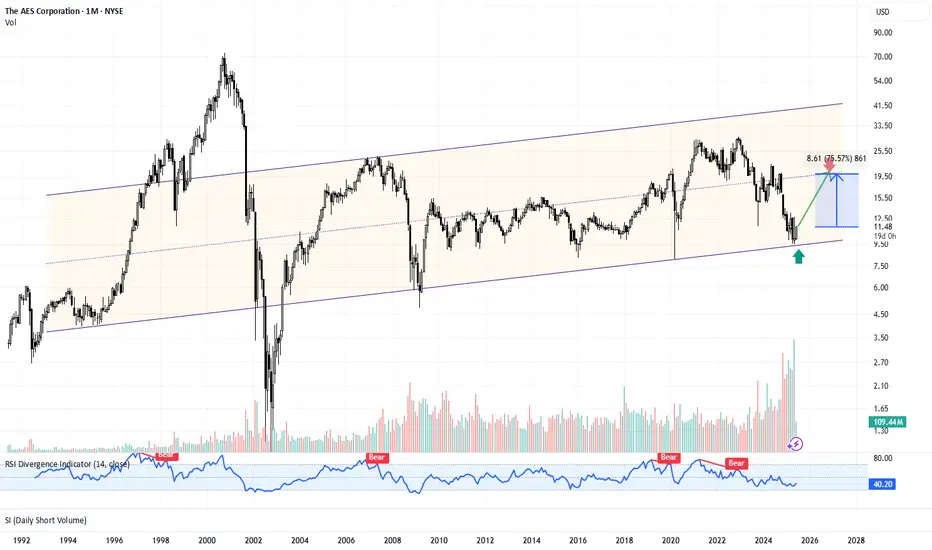
AES | Bounce in Motion from Multi-Decade Support – 75% Upside 📍 Ticker: NYSE:AES (AES Corporation)
📆 Timeframe: 1M (Monthly)
📉 Price: $11.48
📊 Volume: 109.4M
📈 RSI: 40.20 (Oversold rebound zone)
🔍 Technical Setup:
NYSE:AES has just bounced from the lower boundary of a 30-year ascending parallel channel, a zone that has historically marked major long-term bottoms.
🟢 Green arrow: Rebound from long-term trendline support
📏 Targeting reversion to the channel median
🔹 Pattern context: Mean-reversion strategy inside macro uptrend
🧠 Trade Plan & Price Target:
✅ Entry Zone: $11.00–$11.50
❌ Stop-Loss: Close below $9.50 (channel structure breakdown)
🎯 Target: $20.00
→ 📈 Return: +75.6% from current levels
⚠️ Key Insights:
RSI near historical bounce zone (40)
Major volume surge may signal capitulation
AES is historically cyclical within this macro structure — mean reversion is likely
Short interest elevated — potential for short-covering rally
💬 Will AES power a multi-quarter reversal like it did in 2002, 2009, and 2020?
📈 Add it to your radar if you’re watching for long-cycle rebounds.
#AES #MeanReversion #LongTermChannel #Utilities #ValueTrade #TargetTraders
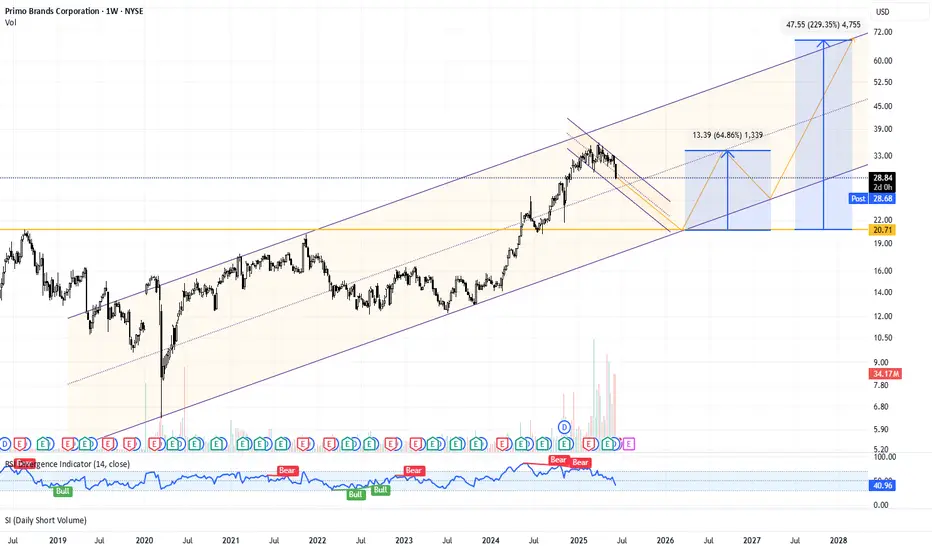
PRMB | Breakdown in Progress – Setting Up for a 200% Swing Buy📍 Ticker: NYSE:PRMB (Primo Brands Corporation)
📆 Timeframe: 1W (Weekly)
📉 Price: $28.84
📊 Volume: 32.38M
📈 RSI: 40.95 (Bearish momentum, nearing bounce zone)
🔍 Technical Setup:
PRMB has broken below a steep sub-channel and is targeting the midline and base of a broader long-term ascending channel, offering a high-reward opportunity for medium-term traders.
📉 Short-term trend: Bearish correction
📈 Long-term trend: Still intact within rising channel
📍 Support zone: $20.70 – multi-year horizontal + lower channel convergence
📊 RSI: Oversold territory, potential for bullish divergence
🧠 Trade Plan & Price Targets:
📥 Wait for price to hit $20.70–21.00 zone (major confluence zone)
✅ Entry Range: $21.00–$22.00
❌ Stop-Loss: Below $19.00 (channel breakdown invalidation)
🎯 Target 1: $35.00
→ 📈 Return: +64.8%
🎯 Target 2: $72.00
→ 📈 Return: +229.3%
⚠️ Key Insights:
Volume spikes during selloff = panic selling, possible capitulation
RSI forming base near 40 → reversal often begins here historically
Macro trend channel still fully intact — just correcting within range
Steep reward potential if entry is timed at support
💬 Will PRMB complete the retest and deliver a massive swing?
🎯 Precision setups like this don't come often — add it to your watchlist now.
#PRMB #ChannelTrading #SwingSetup #LongTermReversal #HighReward #TechnicalSetup #TargetTraders
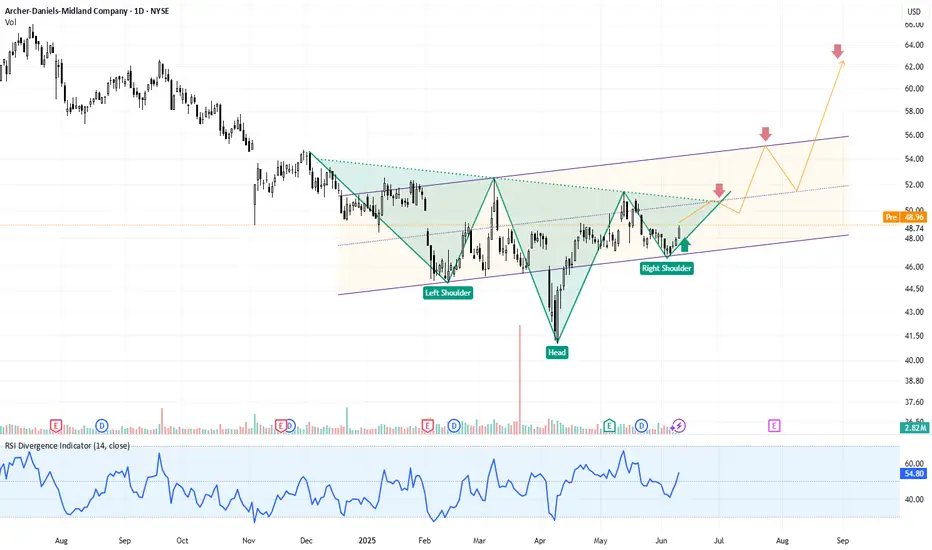
ADM | Inverse Head & Shoulders + Parallel Channel = Reversal📍 Ticker: NYSE:ADM (Archer-Daniels-Midland Company)
📆 Timeframe: 1D (Daily)
📉 Price: $48.74
📊 Volume: 2.82M
📈 RSI: 54.80 (Momentum building)
🔍 Technical Setup:
NYSE:ADM is completing a textbook Inverse Head & Shoulders at the bottom of a rising channel, hinting at a structural reversal.
🟢 Green arrow signals current buying opportunity
🔺 Red arrows highlight expected resistance zones on the way up
🟣 Channel provides a clean roadmap for a stair-step recovery structure
Pattern Highlights:
Well-defined L–H–R shoulders
Price reclaiming the midline of the channel
RSI recovering above 50, signaling shift in momentum
🧠 Trade Plan & Price Targets:
✅ Entry Range: $48.50–$49.00
❌ Stop-Loss: Close below $46.00 (invalidation of channel + pattern)
🎯 Target 1: $52.50
→ 📈 Return: +7.7%
🎯 Target 2: $56.50
→ 📈 Return: +15.9%
🎯 Target 3: $63.00
→ 📈 Return: +29.3%
⚠️ Technical Notes:
Pattern is visible across multiple timeframes — weekly structure aligns with daily bullish reversal
RSI breakout + neckline test = potential breakout confirmation
Earnings volatility in rear-view mirror – momentum favored near-term
💬 Is ADM finally turning the corner after months of weakness?
📌 Like & Follow for more structured swing setups!
#TargetTraders #ADM #HeadAndShoulders #ChannelBreakout #SwingTrade #InverseHnS #TechnicalSetup