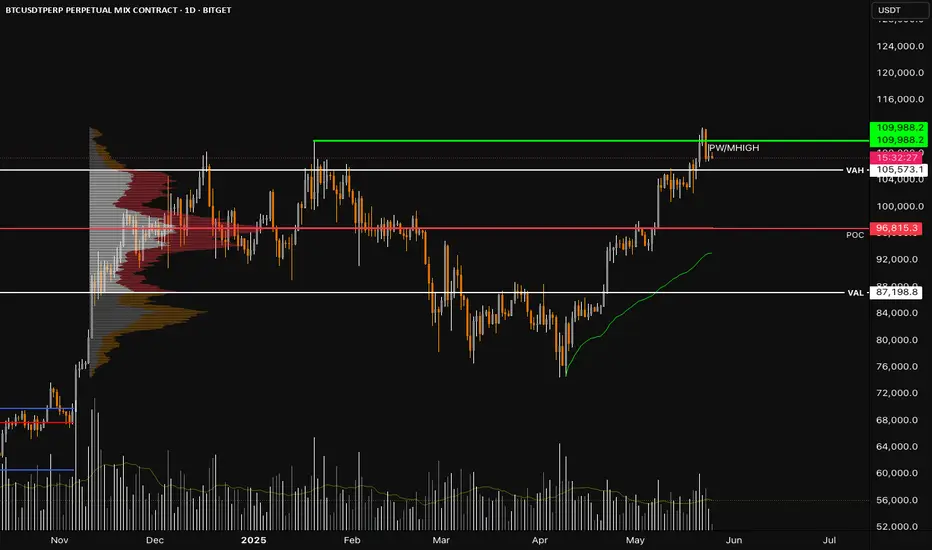
Deeper Retrace if previous monthly high and VAH are lostBTC has made a strong move up recently, but we’re now trading just above key contextual levels that could act as a tipping point if lost. Do we look for a failed auction?
🧭 Key Levels on Watch:
• PW/MHIGH (Previous Week and Month High): ~109,988
• VAH (Value Area High): ~105,573
• POC (Point of Control): ~96,815
• VAL (Value Area Low): ~87,198
• Anchored VWAP from the April low is rising steadily and currently converging with the POC.
🔍 What to Watch For:
We’ve wicked above the monthly high and are now showing signs of stalling. If BTC fails to hold above the VAH (~105.5k), it would suggest acceptance back inside the prior value area. This could open the door for a rotation lower toward the POC (~96.8k) — the area with the highest historical volume and strong structural support.
🟢 Anchored VWAP Support
The anchored VWAP from the April low continues to rise and is on a collision course with the POC. This area could become a magnet for price, offering confluence for a potential bounce or reaccumulation zone.
⚠️ Scenario Outlook:
• Lose PW/MHIGH → Caution
• Lose VAH and hold below → Expect rotation to POC
• VWAP + POC convergence could be a key buy zone if tested
This is a classic example of auction market theory in action: acceptance back into value often leads to a revisit of the point of control.
Valueareahigh
BITCOIN NEW All Time Highs Soon!!!Value Area High of previous bullrun has officially been broken through!!
There's not too much left stopping Bitcoin from reaching ATH's!
Let The Fun Begin!
Calculate Your Risk/Reward so you don't lose more than 1% of your account per trade.
Every day the charts provide new information. You have to adjust or get REKT.
Love it or hate it, hit that thumbs up and share your thoughts below!
This is not financial advice. This is for educational purposes only.

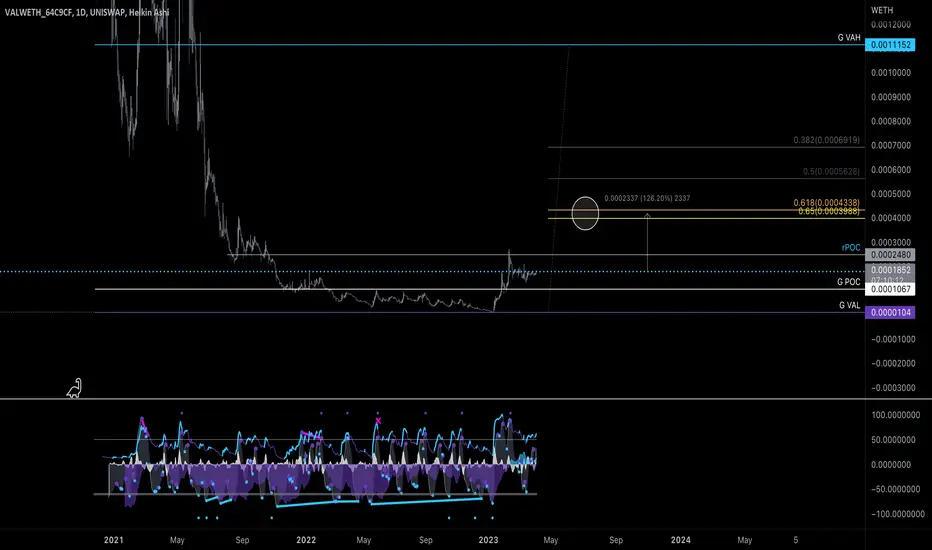
VAL - Sora Validator TokenThis chart is a creative venture. I did something a little different. I pulled a volume profile for the entire uniswap history of VAL token. I then pulled a FIB range on that revealed VAH and VAL area (value area high, low).
It is creative in the sense that I want to see if the total buying and selling data from the volume profile will be respected in the future with external market conditions. It all plays together but so do the minor details.
So it's a bit predictive in nature but no guarantees, and no fortune telling.
I will make other charts on VAL but for now I will start here.