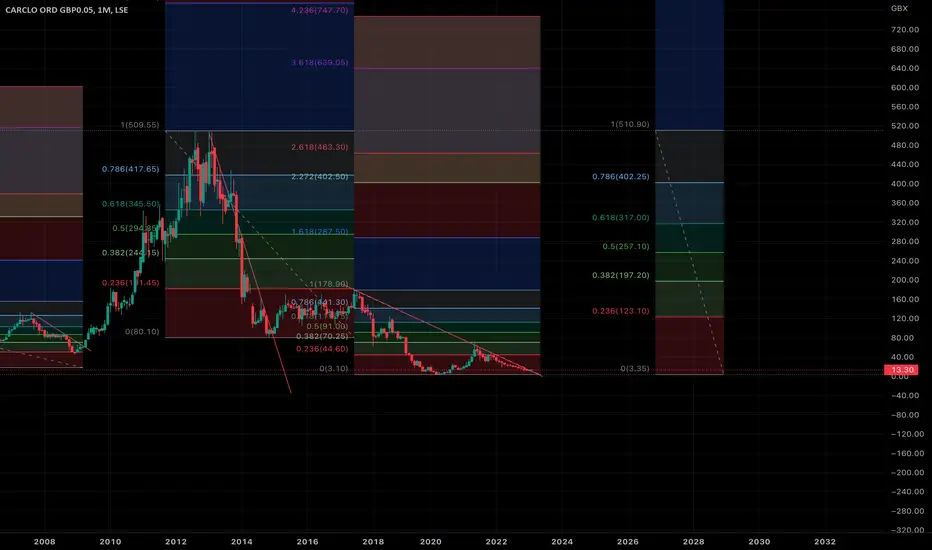
Breakout for a 2,200%-plus return?This is Carclo, an industrial share listed on the London Stock Exchange’s Alternative Investment Market. It looks like it is breaking out from a 68-month decline that, if the past is any guide, could return huge multiples on any investment at this stage.
Some of this company’s subsidiaries have been trading almost 100 years, but this century it has been a hugely volatile share. It began with the general market decline after the dotcom bubble at the turn of the millennium. A major slide in price was triggered in June 2000, bringing it down almost 90% from peak to trough across 33 months.
It took 26 months for the share to rebound to the 50% Fib (this share loves a Fibonacci level) and, after hitting resistance there, retraced to the .382 Fib where it bobbled along for the best part of a year. By August 2007 it had risen 650% from the bottom.
But then came a double top and another major decline, hitting resistance at the 50% Fib in September 2008 and setting eight months’ worth of relative equal highs from there. (A very nice trading range, that.)
Price reversed again at the .236 Fib and this was where the fun started. Across the next four years, Carclo rose 1,000%, trough to peak.
Since that January 2013 peak, another double top almost 10 years ago to the day, Carclo has been in seemingly terminal decline. There can’t be many bulls left to sell and you get the sense capitulation is around the corner.
Although there was a slight recovery in price from November 2014 to June 2017 (31 months), it met resistance at the .236 Fib and rolled over again. The peak-to-trough decline, at the nadir of the Covid lockdowns in 2020, was 99.19%.
But this is no junk share. It has had its problems with its pension liabilities and with debt but it has arranged new banking facilities with its lenders that give it good headroom. Net assets are almost £30m against a market cap of <£10m.
But the key thing is how *every single time* this share has opened on the monthly above the trendline after a multi-month decline, it has sparked a tremendous rally in price over the medium term. It opened above again yesterday. I’m eyeing as my first TP the 50% Fib on the most recent decline, where there are five months of relative equal highs to mitigate.
From there, a return to the .618 Fib on the broader, 67-month downtrend would also draw price to the monthly swing low and ICT fair-value gap from June 2013, which also remains unmitigated. And if you believe in cups and handles and head-and-shoulders patterns, there’s every reason to believe a C&H and inverse H&S could form very soon.
Hitting the .618 Fib at 317p would constitute a near 2,200% return for anyone investing today. Better still, given the current zeitgeist of war and ageing populations, Carclo’s specialisms (e.g. heavy-duty cabling for the aviation industry and technical plastics for the medical sector) could create a new era of enormous value for the business. Who’s to say it wouldn’t rocket beyond old support-and-resistance levels to make new ATHs?
After all, this share has made big, big moves before.
BUT DYOR. GLA.
Valueinvesting
At the beginning was the EquityWith this post, I am concluding the analysis of the company's balance sheet. You can read the previous parts here:
Part 1 - Balance sheet: taking the first steps
Part 2 - Assets I prioritize
Part 3 - A sense of debt
Now we know that every company has assets on one side of the balance sheet and liabilities and equity on the other side. If you add liabilities and equity together you get the sum of assets. And vice versa, if you subtract all of the company's liabilities from the assets, you get what? That's right, you get Equity . Let's discuss this important component of the balance sheet.
When a company is first established, it must have initial equity. This is the money with which any business starts. It is used for the first expenses of the new company. In the case of our workshop , the equity was the master's savings, with which he bought the garage, equipment, raw materials and other assets to start his business. As sales progressed, the workshop received the revenue and reimbursed expenses. Whatever was left over was used to boost the company's profit. So, our master invested his capital in the business to increase it through profits.
Making a profit is the main purpose for which the company's assets work, loans are raised, and equity is invested.
Let's see which balance sheet items are in the Equity group:
- Common stock (The sum of nominal values of common stock issued). Remember, when our master decided to turn his company into a stock company , he issued 1 million shares at a price of $1,000 per share. So $1,000 per share is the par value of the stock. And the sum of the nominal values of the stocks issued would be $1 billion.
- Retained earnings . It is clear from the name of this item that it contains profits that have not been distributed. We will find out where it can be allocated in the next post, when we start analyzing the income statement.
- Accumulated other comprehensive income (Profit or loss on open investments). The profit or loss of a company can be not only from its core business, but also, for example, from the rise or fall in the value of other companies' shares that it bought. In our example, the workshop has oil company shares. The financial result from the revaluation of these shares is recorded in this item.
So, the equity is necessary for the company to invest it in the business and make a profit. Then the retained earnings themselves become equity, which is reinvested to make even more profits. It's a continuous cycle of the company's life that bets on equity growth.
Which balance sheet items are of interest to me in the Equity group? Of course, I am interested in the profit-related items: retained earnings and profit or loss on open investments. The sum of nominal share values is a static indicator, so it can hardly tell us anything.
However, it is better to use information from the income statement rather than the balance sheet to analyze earnings, because only this report allows us to see the entire structure of a company's income and expenses.
So we conclude the general analysis of a company's balance sheet. To fully understand why it is needed, let's engage our imagination once again. Do you remember the example with the hotel ? We imagined that a joint stock company is a hotel with identical rooms, where you, as an investor, can buy a certain number of rooms (one room = one share). Think about what you would want to look at first before buying? Personally, I'd rather see photos of the rooms.
So, the balance sheet can be compared to such photos that we get from the hotel at quarterly and annual intervals. Of course, in such a case, the hotel will try to use special effects as much as possible in order to improve investors' impression of the photos released. However, if we track and compare photos over multiple periods, we can still understand: is our hotel evolving, or have we been watching the same couch in a standard room for 10 years in a row.
We can say that the balance sheet is a "photo" of the company's assets, debts and equity at the balance sheet date. And the balance sheet items I've chosen are what I look at first in this photo.
In the next series of posts, we will break down an equally important report, the income statement, and explore the essence of earnings. See you soon!

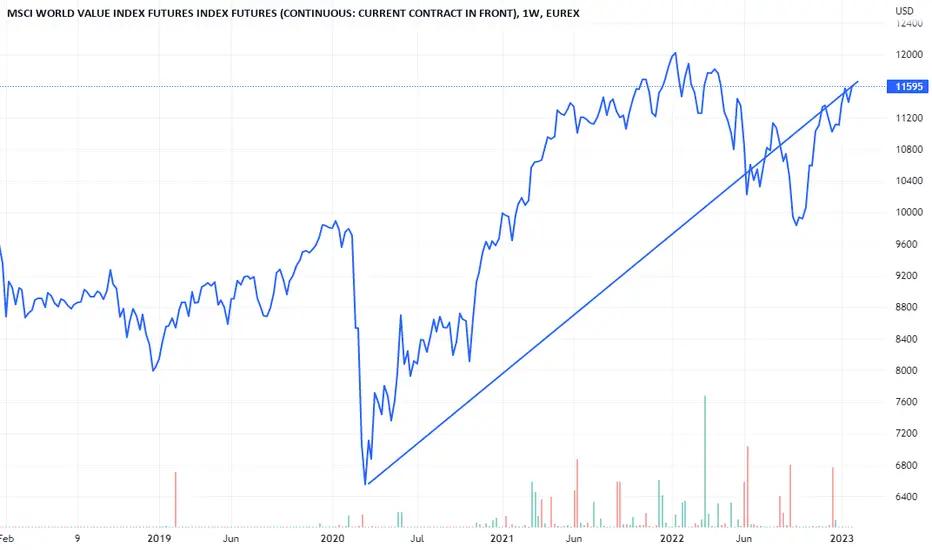
2023: Time to dive deep into value2023 is off to a cautious start, heralded by the International Monetary Fund (IMF). They have warned that the upcoming recession is likely to leave the global economy fundamentally damaged – with a recession in the US, a deeper slowdown in Europe, and drawn-out recession in the United Kingdom. This is quite possible. However, the current downturn may not look like the downturns of the past - supported by a more resilient labour market. As we transition to 2023, three questions from 2022 still remain unanswered: 1) how sticky will the underlying inflation be 2) how intense will the recession be 3) will we find a solution to Europe’s energy crisis.
2022 has been a tough year for equities, evident from the 20% decline in the global stock market capitalisation to USD $96.6 tn1. Expensive growth stocks that had driven markets higher over the past decade began to correct sharply as the interest rate regime changed. In contrast, value stocks, while down for the year, were relative outperformers. The MSCI value index outperformed its growth counterpart by 21% this year1. The rising rate environment had a strong role to play in the higher relative performance.
Central banks turn up the hawkish rhetoric
While inflation has begun showing signs of easing globally, central banks in the US, Europe, and UK continue to remain hawkish. The Federal Open Market Committee’s (FOMC) new forecasts for the economy and policy showed few signs that the inflation picture is improving meaningfully. Federal Reserve (Fed) Chair Powell made clear in the December meeting that he wanted to see “substantially” more progress on inflation before the hiking would stop.
The latest European Central Bank (ECB) projections show inflation is unlikely to reach the 2% target until late 2025. At its December meeting, the ECB took a hawkish turn, and we think they are likely to hike by 50bps at least twice more, in February and March 2023. Similarly in the UK, the Monetary Policy Committee (MPC) will need to see core consumer price index (CPI) inflation slow materially before the MPC stops its rate hike cycle. The key question in 2023 remains how sticky inflation will be on the upside (how soon it will approach the central bank’s targets), as it will determine the likelihood of central banks maintaining their hawkish stance on monetary policy. Historically the value factor has demonstrated resilience during periods of interest rate volatility.
De-risking your equity portfolio with the high dividend and value factor
As interest rate volatility is poised to remain high, value-oriented stocks such as financials, energy, utilities, healthcare and industrials may be in better shape to withstand a slowdown. This is because value companies tend to make their money in the near term owing to which earnings for these companies are less discounted than for growth companies whose significant profits and cash flow are expected to occur far in the future. Value stocks also have a better chance of defending and/or growing their operating margins compared to growth stocks.
The high dividend factor is synonymous with an investment strategy that gains exposure to companies that appear undervalued and have demonstrated stable and increasing dividends. The strong performance of the dividend factor in 2022 has been a function of their close relationship with stocks with more stable fundamentals alongside the rising rate environment.
What worked in 2022?
Our approach to blending the high dividend factor alongside the value factor helped the WisdomTree US Equity Income UCITS Index outperform the S&P 500 Index by 24.8% in 2022. As illustrated in the sector attribution (above) the allocation has been positive, contributing to the tracking difference by +21%. The overweight in energy, healthcare and utilities benefitted performance by +12%, 2% and 1% respectively last year.
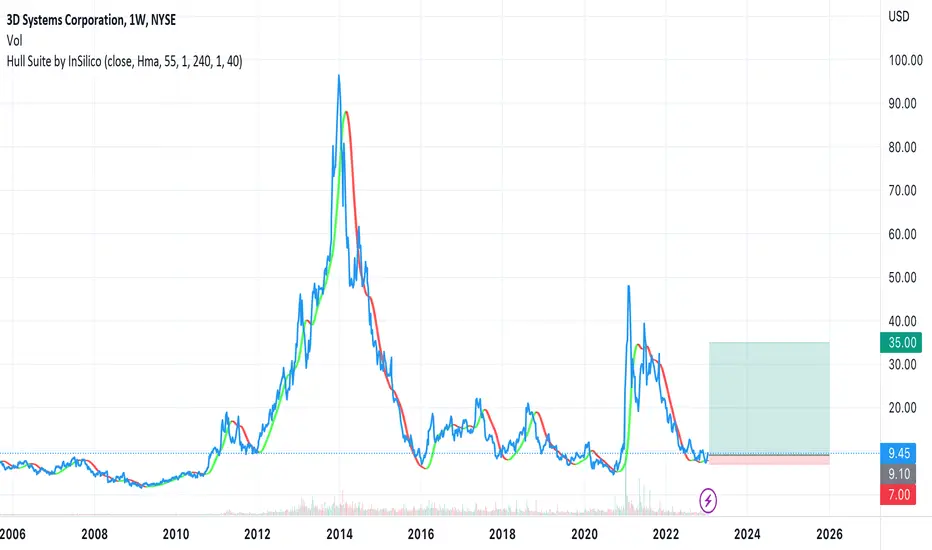
DDD 3D Systems. The Cheapest High Tech Play You Haven't Heard OfDDD is a 3D printing stock which experienced incredible price action back in 2014 when there was a lot of hype around 3D printing. Back then the company was not making money, now it has a great balance sheet and strong earnings and trades under a P/E ratio of 5. The stock is cheap in general and especially for a new age tech stock. Let alone 3D printing could go through another hype cycle and make this stock pop big time. Target is at least 35 dollas in the next couple years
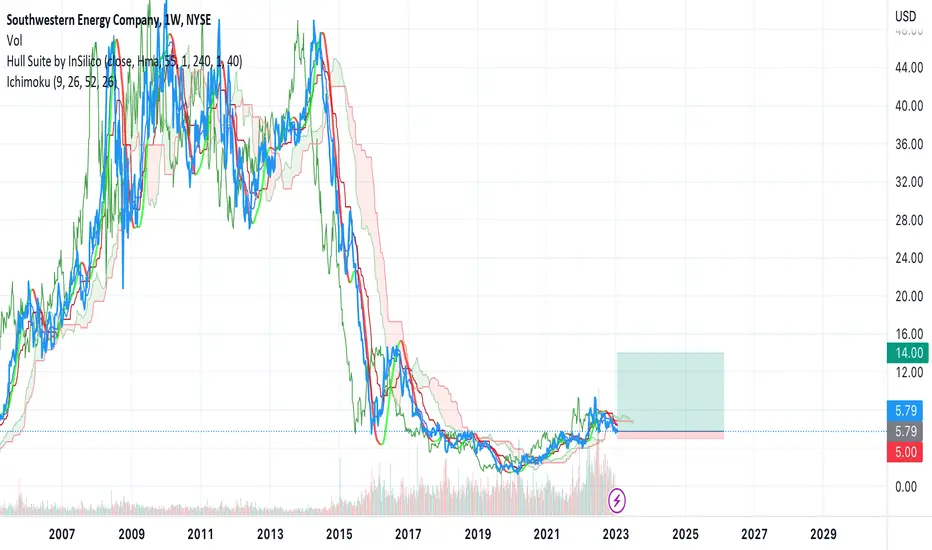
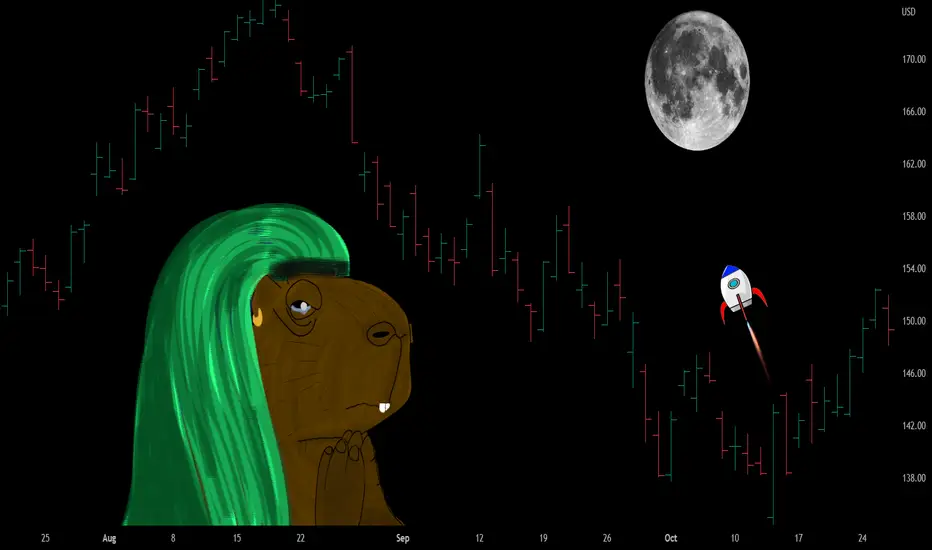
SWN Southwestern Energy. The Best Play on US Natural Gas ExportsI've held this investment for over a year now. Average price is around 5.8. It has not done anything in terms of stock price but the company's financials improved big time and they are bringing in massive free cash flow. In the next couple years they pay down their debt and get a big pop next time Natural Gas has good times. I feel good in it still think it's cheap and that the market just doesn't know it yet. The last year has been a hard times for stocks too. Target for SWN is at least $14
A sense of debtIn the previous two posts, we explored how assets are grouped in a company's balance sheet.
Part 1: Balance sheet: taking the first steps
Part 2: Assets I prioritize
Now let's deal with Liabilities and Stockholders' equity. Let me remind you that these are the sources of funds that give a company assets. And indeed, with what funds can a company have assets? Either with its own funds (stockholders' equity), or with funds borrowed (liabilities). For simplicity, we will call them Debts and Equity.
Debts can vary in maturity, so we've divided them into two categories in the balance sheet: Current liabilities and Non-current liabilities .
Current liabilities include:
- Current debts are debts that need to be paid back within a year after they are incurred. Do you remember our master took a loan from the bank to make a large batch of boots? That loan will be recorded in this item (assuming the loan is up to one year in repayment).
- Accounts payable (debts to suppliers of goods and services). You can borrow money not only from the bank, but also from your suppliers, for example. In other words he is giving you raw materials now, but is ready to accept payment later. Such debts are reflected in this item.
- Accrued liabilities (Provisions for future expenses on unpaid bills in the form of wages, rent, taxes). The word "debt" is in many ways synonymous with the word "liability." A company may have many such liabilities: payment of wages, rent and taxes. In essence, these are also debts to be paid during the year. For convenience, cash reserves are set aside for them. They are spent at the moment when the payment is due. Such reserves are recorded in this item.
- Other current liabilities . Debts or liabilities with a maturity of up to one year that are not included in the categories above are shown here.
Non-current liabilities include:
- Long term debt - these are debts that need to be paid back more than one year after they are incurred. If our master had borrowed from the bank for two years, such a loan would fall into this category.
- Deferred taxes liabilities (Provision for taxes to be paid in a future period). Tax rates are subject to change, and new taxes may come into effect in a year or more. But even now, the company can set aside money for future taxes.
- Other long term liabilities . Here are debts or liabilities with a maturity of more than one year that are not included in the categories above.
In short, debts are loans taken by the company, provisions for tax liabilities, and debts to suppliers.
The amount of debt is a very important indicator in the fundamental analysis of a company. On the one hand, the mere presence of debt is not scary, because it demonstrates that banks trust the company and give it loans for development. On the other hand, a substantial amount of debt can cause serious problems and losses in the period of weak sales of goods or services. Banks are unlikely to suspend interest charges on loans if a company is doing poorly. This means the company will incur expenses in the form of interest on loans that are not offset by revenue. Also a reminder that if a company goes bankrupt, the owners of the stock get the assets of that company only after all debts have been settled . If the debts are so large that they exceed the value of all the property, the shareholders get nothing. For these reasons, I select companies with small debt loads.
What liabilities do I focus on?
- Current debt;
- Accounts payable;
- Long term debt.
For me, these are the items that most clearly reflect the company's debt situation.
In the next post, we will conclude our study of the balance sheet and look at the basic source of assets, which is Equity. See you soon!

Assets I prioritizeIn the previous post Balance sheet: taking the first steps , we began parsing the balance sheet of the imaginary workshop and focused on assets. Today, I suggest looking at what types of tangible and intangible property are classified as current assets and what types are classified as non-current assets.
Current assets contain the following items:
- Cash and cash equivalents - in our case we can include a safe with money, which, in general, corresponds to the company's cash in its current bank accounts.
- Net receivables - here we would include the IOU from a friend. That is everything that clients owe the company for goods or services.
- Inventory - this includes a bag with leather, rubber and thread. That is all raw materials, from which goods are made, as well as stocks of finished goods in warehouses.
- Other current assets - this can include other current assets that do not belong to the previous items.
Non-current assets include the following items:
- Net property, plant and equipment - we include a garage, table, chair, sewing machine and tools. Depreciation is deducted from the original cost of the property when reporting it. Depreciation is the cost to repair and renew the property.
- Equity and other investments - in our example, this would include oil company stocks (and in general, any company investment in stocks or bonds of other companies).
- Goodwill - let's say our company wants to buy another company and is willing to pay $11 million for it. The assets of the other company are $10 million, and the debts that our company will have to pay for the other company are $2 million. So the assets net of debt are $8 million. After the purchase, the assets and debts of that company will become the assets and debts of our company. So, the difference between the purchase amount of $11 million and the net assets of $8 million is a goodwill equal to $3 million. For our workshop, this item is not relevant, as it didn't buy any company. Nevertheless, remember that goodwill is the difference between the purchase price of another company and its net assets.
- Intangible assets - this can include the value of the customer base in the master's phone book, as well as any other assets that have no tangible basis (such as purchased trademarks).
- Other long term assets - this item includes other non-current assets that don't belong to the previous items.
Once we understand which asset belongs to which item, its value (or rather, the sum of the values of all assets belonging to this item) is written in the balance sheet. For example, let's say we've determined that the Inventory item includes leather, rubber, and thread. The accountant adds up the value of the leather, rubber, and thread and writes the total amount in monetary terms against the Inventory item. This is how the numbers appear in the balance sheet.
Now let's discuss which balance sheet items we should pay attention to during the fundamental analysis of assets. I have formulated the following rule for myself: pay attention to the assets that are directly related to the sale of the company's goods or services .
If a company does not sell its goods or services well, its bank account balance will shrink, huge inventories of unsold goods and raw materials will accumulate in its warehouses, and accounts receivable (customers debt) will grow. The fact is that when sales are bad, the company is ready to lend out goods as debt.
If sales are going well, then, on the contrary, the money in the account will grow, and accounts receivable and inventory will start to shrink. All other assets can influence sales only indirectly, so I don't consider them.
Thus, I have identified my priority assets :
- Cash and cash equivalents;
- Net receivables;
- Inventory.
As you can see, they are all quick current assets. Non-current assets only indirectly affect sales, so they are not a priority benchmark for me.
In the next post, we'll start looking at the right side of our disclosed book, called the Balance sheet. That's where the company's liabilities and equity belong. See you next time!
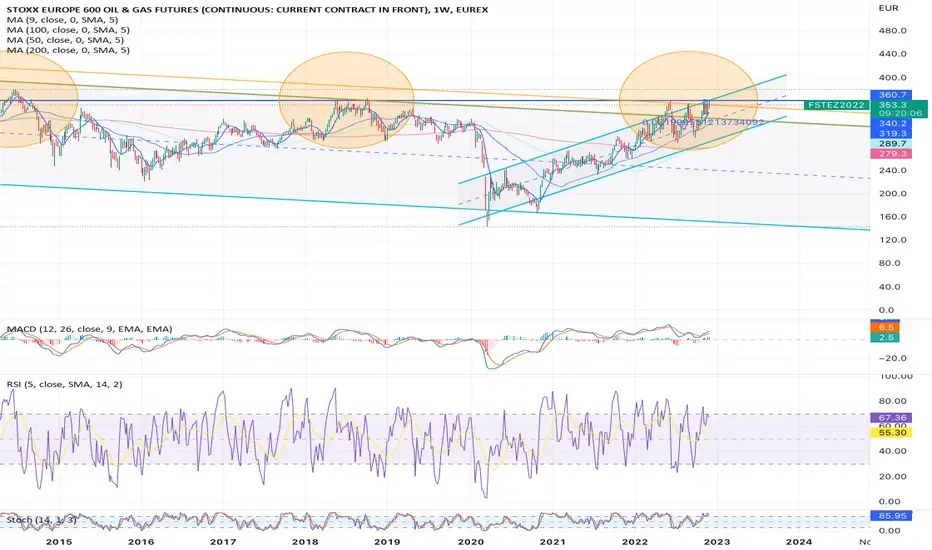
Short STOXX EUROPE 600 OIL & Gas sectorWe are having here a very well structured trade idea, exploiting the confluence of high important technical factors, mean reverting stance, and extreme positioning in the Oil and Gas space thanks for a Long Inflation lean by most investors this year.
Into year end and preparing for 2023, Fact is that after such a good performance some will be tempted to take profit especially with a potential FED pivot in [/b preparation based on Inflation peaking.
Saying it simply and pragmatically : if you made money being long the sectors or High dividend stocks in that space, that's a great achievement, but the forward looking factors are clearly pointing lower.
the USD price action is clearly indicating of Inflation peaking and is highly supportive of this trading idea.
Bottom line: Sell / Short SXEP Sector using this Multi Month horizontal trendline and overbought technical indicators
Balance sheet: taking the first stepsToday we are going to start learning about fundamental analysis of companies. In my opinion, this is the basic skill you should have when picking stocks to invest in.
Once again, the main principle of the strategy I follow is to pick outstanding companies and buy their stocks at a discounted price.
You may have noticed that first-class products are occasionally discounted in stores, but not for long, because such products are quickly swept off the shelves, and almost the next day the price is again without a discount. Exactly the same strategy is applicable to the stock market. Now, fundamental analysis is a method for picking outstanding companies (that is, companies with strong fundamentals).
How can we tell if a company has a strong foundation or not? There is only one way - by analyzing its financial statements. Every listed company has to disclose this information publicly on its website. In other words, we don't have to extract that information - it is publicly available. You can also find it on TradingView and see the data in dynamics.
What is the content of this information? The company publishes three reports : balance sheet, income statement and cash flow statement.
The balance sheet, like the order book , can be presented as an open book. The left side of the book lists the company's assets and their valuation in monetary terms, and the right side lists the company's liabilities and equity , and their valuation in monetary terms.
What are company assets ? These are everything that belongs to the company: buildings, equipment, trademark, shares of other companies, cash in the cash register. In general, all tangible and intangible property of a company are assets.
What are liabilities and equity of a company? These are the sources of funds that gave rise to the assets. For example, if you bought a computer for $1000 with your savings, then the computer is an asset, and your own savings are equity. If a friend lent you $100, and you put the money in your pocket, the money in your pocket is an asset, and the debt to your friend is a liability. Based on these examples, you can make an imaginary balance sheet:
As you can see, the entry in the balance sheet is the name of the asset, liability or equity and their monetary value. Assets, liabilities and equity are inextricably linked, so the sum of assets is always equal to the sum of liabilities and equity .
If we were to write every asset in this way on the balance sheet of a large company, it would turn into an endless book of hundreds of pages. However, if we look at the balance sheets of huge corporations, they can fit on a single sheet of paper. This is due to the fact that over time invented to group the same type of balance sheet items. Let's look at how the company's balance sheet items are grouped:
Don't be frightened. Now we will try to digest this table with the help of an example we are already familiar with. Let's think back to our master cobbler , specifically to the period when he was just starting out.
Let's assume what exactly he had at that time: a garage, a table, a chair, a sewing machine, tools, a bag with leather and rubber, thread, a safe with money, a phone book with clients' contact information, a IOU from his friend, and oil company stocks.
I have now listed the assets of our master, or should I say, of his workshop. I should note that what is listed here is exactly what is directly related to his business. Even the money in the safe, the debt from his friend, and the oil company shares came about because of the existence of the business. Let's say the master's apartment or the bicycle he rides in the park are not assets, because they don't belong to the workshop. They belong to the master, but not to his business.
Let's categorize the workshop's assets into groups. There are two big groups: Current assets and Non-current assets .
How should you distinguish them? The general rule is this: Current assets are what a company's product is made of, and what can turn into money in the near future, so they can be called quick assets . Non-current assets are where and with what we create the product, and what can turn into money not so soon (so they can be called long-term assets ).
So, here we go:
- A garage, a table, a chair are where we create a product, so a long-term (non-current) asset.
- A sewing machine, tools - this is what we use to create a product - a long-term (non-current) asset.
- A bag with leather and rubber and thread is what a product is made from - a quick (current) asset.
- A safe with money is already real money - a quick (current) asset.
- A phone book with customer numbers - it's hard to sell it to someone quickly, such assets are also called intangible assets and are placed in long-term (non-current) assets.
- IOU from a friend, i.e. a friend bought boots from a master, but can pay only after receiving his salary - a quick (current) asset.
- Shares of an oil company - let's assume that a customer once paid for the boots with them - a long-term (non-current) asset.
So, we've just categorized the master's assets into two groups: current assets (quick assets) and non-current assets (long-term assets). In the next post, we'll break down the components of these two large groups. See you then!

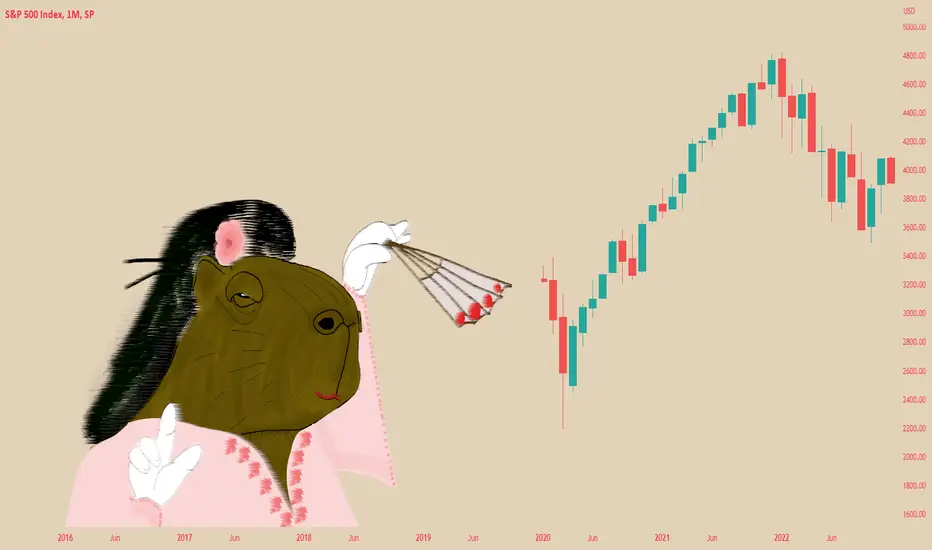
CAT - 9 lives, 1 left CAT sitting on the front steps of a very dangerous channel where historically we have seen blowoff tops and waterfall selling anytime we're here....
.... Complacency?

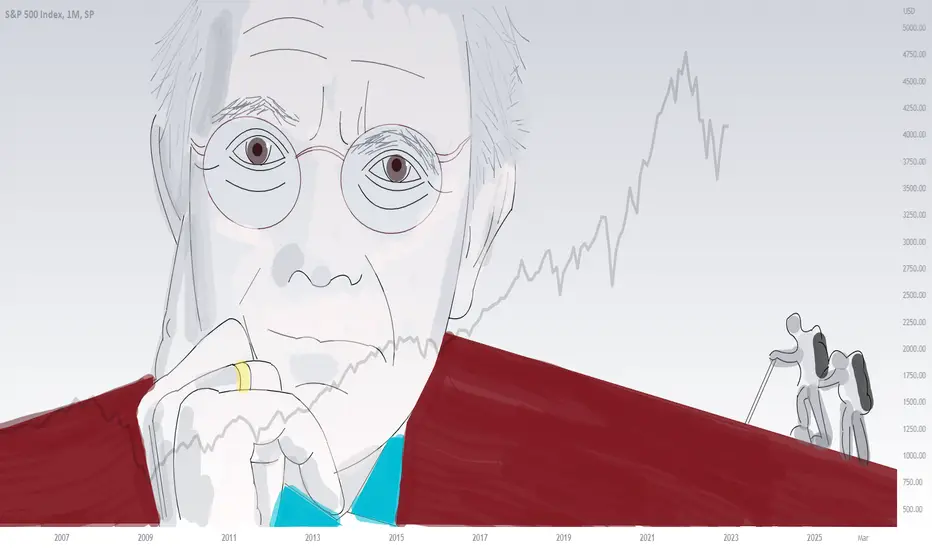
Man on the shoulders of giantsIsaac Newton, who turned people's view of the world upside down, once said: "If I have seen further than others, it is by standing on the shoulders of giants". And indeed, each of us has a chance to discover something new for ourselves and others by drawing on the wisdom of our predecessors. I want to say a big thank you to Benjamin Graham, David Dodd, Warren Buffett and Peter Lynch, who openly shared their ideas with the world and inspired more than one private investor in their first investments.
I'm sure Mohnish Pabrai will join me in saying the same. Born in Mumbai, an engineer by training, he had no interest in the subject of stock investing until he was 30 years old. But by chance, after reading a book by Peter Lynch, he began to study the subject more deeply. Inch by inch he climbed the shoulders of the giants of value investing to see hitherto unknown horizons. He is now known as a successful investor, author of books on investing, and creator of incredibly kind philanthropic initiatives.
Listening to Mohnish Pabrai's lectures, I noted his ideas, which in many ways coincide with my own. I am happy to share them with you:
1. The market is always concerned about what will happen to the company in the future, so it cannot be 100% efficient (*).
(*) Let me remind you that according to "efficient market" theory, a company's current price reflects its "fair value" because any publicly known information instantly affects the price. Thus, an investor is unlikely to make a profit on any information, such as a company's strong financial statements, because the market has already reflected the event. However, this theory does not take into account the future, which we all think about every day and act in the present, including the market, based on those thoughts. For example, someone may think that a company's future is murky because of the news that has come out. This concern will be picked up by the crowd, and the stock will go down. Or on the contrary, the success of the company may be perceived as over-optimistic, and a real stir will start around the stock. No one knows the future, but thinking about it affects the present. For this reason, the current price of the company may not reflect its fair value, contrary to the "efficient market" theory.
2. Continuing with the first thought, the waves of pessimism and optimism will always be present in the market. They distort a company's value so much that they give us private investors a chance to buy and sell a company's stock profitably.
3. The more time you spend analyzing a company, the more you "fall in love" with it. Try to grasp this idea. After all, by spending a lot of time studying something, such as a company's excellent financial statements, we set ourselves up for what it must pay off as a profitable investment. Remember: the market doesn't owe you anything.
4. Often the decision to invest in a company can be made based on just a few surprising figures. For example, if the value of a company is equal to 50% of the amount of cash in its checking account. Mohnish Pabrai said that Warren Buffett used a reference book with the statements of thousands of companies, not to spend months studying each of them, but to find something that would really surprise him.
5. Mohnish Pabrai admitted that he has never once played the short and has no intention of doing so for the rest of his life. His math is really simple. If you play the short by selling a stock at $100, your maximum earnings are capped at $100 (which will happen when the stock drops to zero). Whereas a buyer of a $100 stock has a chance to sell it at both $1,000 and $2,000. There is no upside restriction by its very nature.
6. And the thought I want to conclude this post with is don't look for people to hand you a treasure on a platter. Looking for treasure is much more interesting! It's about not trying to replicate someone else's trades or portfolio positions. Try to make your own decisions. Try to see your horizon.
The unwavering shoulders of giants will help you in all of this.

A pill for missed opportunitiesPrevious parts of the post:
Part 1: My Three Comrades: the Chart, the Screener, and the Watchlist
Part 2: Two captains of the same ship
The market is an element we take for granted. It can't stop when we're busy doing other things, and it can't work if the stock market is off and you personally have work days.
The small investor's impact on the market is close to zero. Some may not like it, but I see it as a big plus. I'm not the only one. Even Peter Lynch wrote about this . It is because of our size that we small investors have the ability to get the best buy and sell prices on stocks. Just imagine an elephant and a mouse trying to drink water from a coffee mug. Who has a better chance?
Like the best sales, attractive stock prices don't last long. This also applies to the period of increased stock prices that are interesting to sell. To make sure you don't miss this time, TradingView has an alert service.
Why do we need an alert system? For our convenience. Once we have selected fundamentally strong companies, our next step is to keep an eye on their stock price so we can buy them at a price we can benefit from.
You remember our strategy, right? Buy rooms in a great hotel, and even during a sale period.
How do you monitor these "sales"? You have two options: to monitor the price chart yourself during the trading period, or set up alerts so that if the stock price reaches a certain level, you will receive an SMS message to your phone or email, or a push-notification in the TradingView app (depending on your settings). Agree, this is very convenient.
So how do you set up the alerts?
1. First of all, you must open the chart of the stock you are going to configure the alerts for.
2. Then click on the "Alert" button at the top toolbar of the chart.
3. Set the alert parameters in the settings menu.
How do I read the settings in this picture?
If the Apple stock price is less than $130 per share, I will receive an alert every minute, all the time the stock is trading below $130.
The alert I will receive will contain the following message:
AAPL Less Than 130.00
If you don't want to get an alert every minute, set the trigger to "Only Once".
4. In the "Notifications" tab, you can configure where the alerts and the sound will go. The system of customized alerts will allow you to use your time effectively. You will not be chained to the monitor and you can calmly wait for the cherished message.
In the picture you can see that alerts can come as:
- push notification to your phone (if you have the TradingView app installed);
- a pop-up window on your monitor;
- a letter to your email address;
- a message to a web address (advanced feature for developers);
- SMS to your phone, but via email (i.e. your email service must have the ability to send copies of emails via SMS).
As for my investment strategy, it's quiet enough to work on it even without alerts. Mr. Market doesn't often come with insanely interesting prices , so it takes time to get to the target values. It's like waiting for an astronaut from the Moon: he can't return to Earth in a day, you have to wait patiently, with the occasional peek at the situation.
So, I'm concluding my series of posts dedicated to the basic functions of TradingView. I advise you to "play" with the platform for a while to get used to it as quickly as possible. In fact, it has a lot of features that you will discover over time. For now, that's it.
In the following posts, we will begin to examine perhaps the most important aspect of an investment strategy, which is fundamental analysis. Get ready, here comes the part that will require the most concentration. But then you will be able to navigate this topic with ease.
See you next time!
Two captains of the same shipPrevious part of the post: My Three Comrades: the Chart, the Screener, and the Watchlist
Now let's move on to the fundamental analysis. Remember in this post I gave the example that a joint stock company can be thought of as a hotel, and owning shares can be thought of as owning one or more rooms in that hotel. So, imagine now that our hotel has a terrible foundation with lots of holes in it. What would happen to such a hotel? Of course, it could collapse, dragging everything down with it. It would also affect the value of the stock, and in our case, the value of the rooms. Because no one will want to buy rooms in such a hotel, on the contrary, they will try to sell them at any price, and then the value of rooms (stocks) will go down.
The purpose of fundamental analysis is to understand how financially stable and profitable the chosen company is. Sometimes they say that a company has a strong or weak foundation - a generalized conclusion based on analysis of its financial statements. So, our task will be to find stocks of companies with strong foundations.
Let's go to "Chart+" and select "Indicators" in the upper toolbar. A menu will open for you, where on the left we will select "Financials". Here we can select data from company reports: Balance Sheet, Income Statement and Cash Flow. They are issued quarterly and annually. Accordingly, you can select any indicator from the statements, such as revenue, select the period - quarter or year, and add it to the chart. In this way, you can study the dynamics of this indicator over time.
In addition to the reporting data, you can add so-called multipliers to the chart. They are placed in the same menu after the "Cash Flow" > subsection called "Statistics". What is a multiplier and how to analyze the statements, we will discuss in our separate posts on the fundamental analysis, and now let's move on to the technical analysis.
Technical analysis is a search for recurring patterns on a price chart in order to predict its future behavior.
Let's go back to the time when candlesticks were invented. These charts appealed to traders so much that they began to look for repeating combinations of candlesticks, which served as signals of future price movement.
For example, there is a combination called "bearish engulfing" . When the market has a clear upward trend, and in one day, a massive bearish candle appears, the body of which closes the body and shadows of the previous candle - it can herald the reversal of the uptrend.
Or, if the market for three days in a row is drawn three black candles with massive bodies - they are called "three crows" . Traders interpret this as a sign that the downtrend is continuing.
Doesn't that sound like an omen to you? In fact, people have made up dozens of similar patterns and many more that, like weather forecasts, don't always come true.
You must have sensed that I cover this topic rather cursorily? This is due to the fact that I do not use technical analysis at all. That is, I do not make predictions based on recurring situations from the past.
I do, however, use one of the tools of technical analysis, which is the average value of the stock price over the year. Not to make predictions, but to have a guideline: when to buy and when to sell stocks of companies with strong fundamentals.
I will surely elaborate on this in my next posts, but for now, wrapping up the topic of technical analysis, I want to give one analogy.
Stock price movements can be compared to the sea: sometimes it is calm and sometimes it is subject to strong waves. An investor can be compared to the captain of a ship who has to decide whether to put to sea now or not (i.e. whether to buy stocks or not).
A captain who looks at the official weather reports and gauges is like an investor who uses fundamental analysis. And a captain who is only guided by omens and his gut is like an investor making a decision based on technical analysis.
You can be captain number two without me, but how to become captain number one is the subject of my blog.

My Three Comrades: the Chart, the Screener, and the WatchlistToday we will continue to explore the fascinating world of stock investing. And TradingView will help us with that. I sincerely recommend making friends with this platform, as I haven't found anything more convenient to implement my strategy yet.
After you have registered on the site, move to the main menu "Products" > "Chart+" . This is where you'll spend most of your time with the platform.
What opportunities are in front of you:
- Find companies to invest in;
- Make a fundamental analysis of the companies;
- Make a technical analysis of stock charts;
- Receive alerts on the buy or sell price of a stock that is right for you.
So, let's break down each item. How to search for stocks on TradingView?
Hopefully, you've already entered the "Chart+" section. In the upper left corner is a line to enter the ticker of the stock. If you don't know the ticker, just enter the first letters of the company name: the system will find the ticker that corresponds to that company on its own. However, keep in mind that stocks of the same company may be traded on different exchanges from different countries, so sometimes one company may have several tickers.
As an example, let's enter the name "Tesla" in the search bar to open a chart of their stock. As we can see, the system tells us that Tesla is traded on NASDAQ and some exchanges in other countries.
To the right of the search bar is a button with a choice of time frame. You can try different time frames, but for me the most important is the time frame of 1 day (i.e. one candle shows the price change for 1 day).
So, the way of selecting a company via the search bar is convenient when you know at least its name. But there are thousands of companies listed on the stock exchange, and it is impossible to know the name of every company. In this case, the "Stock Screener" will help us. It is located in the lower left corner. Clicking on the Screener will open a list of stocks, filtered according to the parameters you set (you can customize the parameters by clicking on the bright blue button "Filters" on the right).
Let's go to filters and configure the parameters we need. First of all, let's select the country - the USA . In the second turn, on the tab with general parameters, let's choose the instrument type - common stocks , and let's choose the exchanges - NYSE , NASDAQ , and one more - NYSE ARCA . Now we have a list of all stocks, which are traded on the exchanges that we have chosen.
What we are interested in, we can add to the "Watchlist" . This is the first (top) button in the menu on the right. Just right-click on the ticker from the screener and select "Add to Watchlist". The same can be done by right-clicking on a chart. Switching between the tickers in the Watchlist you will consequently switch between the charts.
So, we have figured out how to find the shares of a company. In the next post, let's see what we have in terms of fundamental analysis of companies.

A little bit about volumes and the master of all averagesSo, let's refresh our knowledge from the previous posts (read part 1 and part 2 at the links):
- The chart is based on the data from the tape;
- The X-axis is the time scale, and the Y-axis is the price scale;
- To avoid having to analyze a huge number of trades, interval charts were invented for convenience;
- The most popular chart type is the Candlestick chart;
- The candlestick consists of a body and shadows (upper and lower). The body is drawn at the open and close prices of the interval. The shadows are built by the maximum price (high), and the minimum price (low);
- The time interval for one candle is called a time frame. The smaller the time frame, the more detailed information we get about the price changes.
In addition to information about the price dynamics, from the stock chart, we can get information about the dynamics of trading volume. These are bars that we see below the candlesticks. They are also drawn on the basis of information from the tape. Let's return to our example:
FB $110 20 lots 12/03/21 12-34-59
FB $115 25 lots 12/03/21 12-56-01
FB $100 10 lots 12/03/21 12-59-12
FB $105 30 lots 12/03/21 12-59-48
If you add up all the lots of trades in the interval from 12-00-00 to 12-59-59, we get 85 lots. Then the lots need to be multiplied by the number of stocks in one lot, for example, 100. It turns out that 8500 shares changed their owners in 1 hour. This information is displayed as a bar below each candlestick.
My strategy does not use a trading volume analysis, but it is important to understand that increasing trading volumes are a sign of increasing attention to the stock. However, this attention does not always translate into higher prices. If there is negative news about a company, we will see both a drop in the stock price and an increase in volume.
What is constantly used in my investment strategy is the moving average . What is it? This is the average of the close prices of a selected number of candles, starting with the last one.
I use the average of the close values of the last 252 candlesticks. Why this number? The number 252 corresponds to the average number of trading days per year on the NYSE and the NASDAQ. That is, in fact, the average annual moving price .
Why is it moving? Because every day there is a new candlestick with a new close value, and it begins a new calculation of the average value of the last 252 daily candlesticks.
You can plot the moving average chart on a candlestick chart and see how far the current price has "run away" from the annual average price. I will tell you exactly how to apply this in investing in the next posts, and that's all for today.
Finally, I will ask you to reflect on one thought:
One who is true to the golden mean will always find something that someone else missed and give it to someone who is afraid to miss it.
See you in future posts.

Japanese Candlesticks: Game of Body and ShadowsSo, in the last post we learned how to build a simple line chart based on the tape. Each point on the chart is defined by coordinates from the time (X scale) and price (Y scale) of a trade. But some stocks are traded at a frequency of hundreds of trades per second, at different prices. The question arises: which trade price to choose from this set?
Interval charts were invented to solve this question. The most popular is the Candlestick Chart. They appeared in Japan three hundred years ago, when the Japanese exchanges were trading rice. They were invented by a trader named Homma. Apparently, being tired of drawing a lot of points on charts, he decided that it would be more convenient to show the price change over the time interval. So, what he came up with.
Let's take a time frame equal to one hour and plot a 1-hour candle on the basis of the following tape:
FB $110 20 lots 12/12/22 12-34-59
FB $115 25 lots 12/12/22 12-56-01
FB $100 10 lots 12/12/22 12-59-12
FB $105 30 lots 12/12/22 12-59-48
A candle consists of a body and upper and lower shadows. Like a float. The body is formed from the open and close prices of a certain time frame. In our case the hour interval is from 12-00-00 till 12-59-59. Only 4 deals were concluded in this time interval. The price of the first deal is $110, which is the opening price of the period or the so-called " open ". The price of the last deal was $105, which is the period closing price or " close ". These two prices are enough to form the body of the candle.
Now let us move on to the shadows. The upper shadow is drawn at the maximum price of the interval (115$) and is called " high ". The lower shadow is drawn at the minimum price of the interval ($100) and is called " low ".
The shape of our candle is ready. However, it should also have a content, namely the color. What is it for? Let's take a look at another candle.
Here we can see where is the high and where is the low. But how do we know which is the open or the close? After all, the open is not always at the bottom of the candlestick body, as in the previous example, it can be at the top.
To understand where is the open and where is the close, Homma has invented to paint the body of a candlestick in black, if close is lower than the open, i.e. if the price in the interval is falling (falling candle or bearish candle ).
But if close is higher than open, the body of the candle remains white, it will indicate the growth of price during the interval (rising candle or bullish candle ).
Sometimes a candlestick has shadows, and the close price is equal to the open price. Then it will look like a cross. This candlestick is called a doji .
White and black are the classic colors for the bodies of Japanese candles. However, you can come up with your own colors. If you want the rising candles, for example, to be blue, and the falling orange - you're welcome. The main thing is to make it convenient and understandable for you.
So, one candlestick allows us to understand where we had the first trade, the last trade, the price maximum and minimum in a given time frame. But it does not allow us to understand how the price changed within the interval: when the maximum or minimum was reached and what was happening within this price range.
But the problem can be easily solved if we switch to a smaller time frame. If we look at the daily candlesticks (this is when the time frame of one candle is equal to one day), and we want to see what was during the day - we switch to the hourly time frame. If we want to see even more details - we switch to 15-minute candles and so on down to the seconds. But you and I will most often use daily timeframes, so as not to be distracted by the fluctuations that occur during the day.
To be continued :)
The birth of the chart. The evolution of the tapeLast time we studied how the exchange price is formed, and we found out that it is important to learn how to read charts correctly in order to analyze price changes correctly. Let's see how a chart is made and what it can tell us.
Everyone who went to school probably remembers: to draw a function, we need the X and Y axes. In stock charts, the X-axis is responsible for the time scale, and the Y-axis is responsible for the price scale. As we already know, a chart is built on the basis of data from a tape. At the previous post , we have produced the following tape:
FB $110 20 lots
FB $115 5 lots
FB $100 10 lots
Actually, in addition to ticker, price and volume the tape also fixes time of trade. Let's add this parameter to our tape:
FB $110 20 lots 12/08/22 12-34-59
FB $115 5 lots 12/08/22 12-56-01
FB $100 10 lots 12/08/22 12-59-02
That's it. Now this data is enough to put points on the chart. We draw three points, connect them with straight lines and get a chart.
At one time, this was enough, because trades on the exchange were not frequent. But now some popular stocks, such as Apple or Google, have hundreds of trades per second with different prices.
If the minimum division on the X scale is one second, what price point should we put if there were many trades at different prices in one second? Or let's place all the points at once?
We will discuss that in the next post. And now, as a postscript, I want to show you some pictures describing how the tape was born and evolved.
Here is a picture of a stock player, looking through a tape with quotations, which is given by a special telegraph machine.
Each telegraph machine is connected by wires which, like a spider's web, entangle New York City.
1930's broker's office with several telegraph machines and a quotation board.
An employee of the exchange looking through a tape of quotes. It won't be long before all this is replaced by the first computers.
We'll continue today's theme soon.

Market order or the hunger games of stock tradingThe previous parts of the post can be found at the links:
Part 1 - How is the share price formed on the stock exchange? We do it
Part 2 - Bid/Offer: The Yin and Yang of Stock Prices
So, let's continue. So why don't we ever see some orders in the order book?
Because such orders don't have a price, which means they can't be arranged in a book where all orders are sorted by price. This type of order is used by buyers or sellers who don't want to wait for a counter offer with a suitable price.
"But how can you buy or sell something without specifying a price?" - you ask. It turns out it's possible. When you put out an order without specifying a price, the order simply "eats up" the number of lots you need at the prices currently on the books. Such an order is called a " market order ". We can say that the most "hungry" investors who want to satisfy their "hunger" right now use the market order. Remember yourself: when you really want, for example, a cake, you won't stand at the counter and wait for the seller to set the price you want, you'll just buy the cake at the price that's valid at the moment.
So, let's imagine that someone sent the following order to the exchange: " to sell FB stocks in the volume of 20 lots". Such an order will not appear in the book, but it will "eat" all bids within 20 lots, starting with the most expensive ones.
In our example, there were a total of 15 lots left in the book, so the following concluded trades will be printed in the tape:
FB $115 5 lots
FB $100 10 lots
What will happen to the remaining market order of 5 lots (20-15) that couldn't be filled? The exchange will cancel the order for this remainder, as there are no counter offers in the book.
So, let's review what we learned in the current series of posts:
- For each company, the exchange maintains its own order book for buying and selling stocks;
- A buy order is called a "bid";
- A sell order is called an "offer";
- The order must contain the ticker (abbreviated name of the stock), the direction of the transaction (buy or sell), the price per share and the volume in lots;
- The lot size is set by the exchange. It may be equal to 1 share, 100 shares or some other quantity;
- All orders in the book are called "limit orders";
- There is a special type of orders, which are called "market orders". They have the following parameters: ticker, trade direction, volume in lots, and have no "price" parameter.
- The intersection of buy and sell orders by price creates a trade;
- The volume and price of a trade depends on how much volume was "eaten" in the counter offer and at what price;
- The trade is recorded in the tape. Each company has its own tape.
By the way, our book became empty because all limit orders were filled and no new ones came in. As a result, we have a tape of three trades. The trades are recorded in the tape according to when they were made:
FB $110 20 lots
FB $115 5 lots
FB $100 10 lots
So, when you see a flashing stock price somewhere, like in the broker's app, know that it's the last trade in the tape as of the current second. Or if you hear that Tesla stock has reached $2,000 a share, that means that there's a $2,000-a-share deal imprinted in the Tesla tape.
To show how the stock price has changed over time, a chart is made based on the prices of the trades and when they were made. At its core, a chart is a demonstration of how the stock tape has changed over time.
Knowing how to read a price chart is a basic skill that you will use as you invest. I will tell you how to read charts at our next meeting.

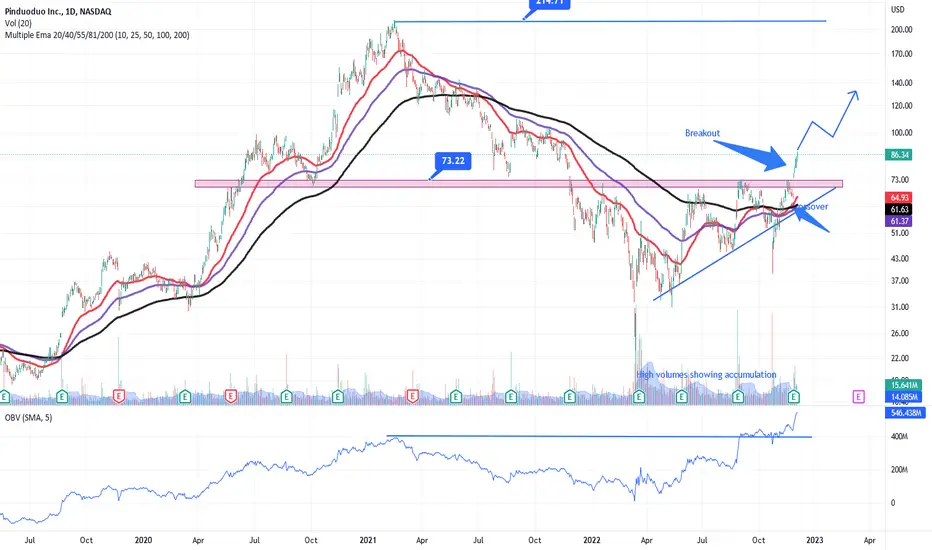
PDD - Read to Fly?
PDD is ready to fly. Here are some solid reasons:
REASON 1 - Accumulation Completed
Down since February 2021, this e-commerce platform of China has taken a reversal. Entered accumulation zone in March 2022, now enough buying volumes and positive earnings have pushed it out of the accumulation zone. Breakout has occurred at 73 USD key price level, and so now stock seems to have entered advance zone while the key long-term resistance (All Time High) is at 214 USD - a gain of more than 100% possible.
REASON 2 - Higher Revenues & Net Income
The real fuel is provided by better earnings and further higher expectations in the future. Revenue has grown 23% in TTM while income has swelled 260% in TTM - both are impressive signals of continued growth. Further pedestal is provided by positive expectations of end of lock-down in China which can open-up locked industrial growth.
Risk
Still caution is needed as markets aren't out of wood.
Bid/Offer: The Yin and Yang of Stock PricesRead the first part of this post at the link: How is the share price formed on the stock exchange? We do it
So at what price and what volume will the deal eventually be made? To understand this, let's go back to the "price" parameter of the order.
When a buyer placed an order "to buy 25 lots at $115 a share", the exchange takes it as "to buy 25 lots at a price not more than $115 a share". That is the purchase price can be less than the price stated in the order, but not more.
And when the seller earlier submitted an order "to sell 20 lots at $110 a share", the exchange takes it as "to sell 20 lots at a price not less than $110 a share". That is, it is possible to sell at a price higher than that specified in the order, but not less.
Once again: buyers always put orders "buy at no more than such-and-such a price", and sellers always put orders "sell at no less than such-and-such a price".
So, we return to the situation with the crossing of prices. When the exchange detects a crossover, it begins to execute the order that has caused this crossover. In our case, it is an order for 25 lots at $115 per share. This order kind of "eats up" all sell orders that are on the way to the price of $115 (that is, everything cheaper than $115), until it reaches 25 lots.
Which orders were "eaten up" in our case? One single order to sell is 20 lots at $110 per share.
What was "eaten" is recorded as a buy and sell trade in what's called a tape. It's similar to the way a cash register punches a check with a price. The record looks like this:
FB $110 20 lots
However, we have a remainder after the trade is 5 lots, the remainder of those 25 at a price of $115. Since at this price (or lower) nothing can be "eaten", the order remains in the left page of the book until a suitable offer.
Let's see how the FB order book looks now, after the deal is done:
Let me note again that all orders in the book are sorted in descending order from top to bottom.
The concept of "book" is very useful for understanding how the exchange price is formed. In the past, when there were no electronic trading systems, there were so-called floor brokers, who used to collect and record prices and volumes of orders in a real book. Nowadays you may encounter alternative terms like Depth of Market (DOM), Level II, but they are all identical to the notion of an " order book ".
The orders to buy that we see in the order book are called " bids ", and the orders to sell are called " offers ". So, in our order book there are two bids and no offers. All bids and offers are called " limit orders " because they have a price limit.
But there's also a type of order that we will never see in the book. Why? I'll tell you in the next post.
How is the share price formed on the stock exchange? We do itYou already know that the stock exchange is a one-stop place to buy or sell stocks, whether you are a novice investor or a seasoned professional. But even if you don't trade stocks, you will still "come" to the stock exchange to find out stock prices.
Let's find out how the exchange price of a stock is formed. Regardless of what country the stock exchange is in, the rules for determining the price are similar for everyone. Let us understand how it works, as always, with the help of our imagination.
Imagine a large rack of books. Each book has a name on the cover: Apple, Facebook, Amazon, etc. Let's take one of the books, let's say Facebook, and open it. We will see only two pages, and they are both blank. On the left page we will record buyers' orders to buy shares, and on the right page we will record sellers' orders, respectively, to sell shares. So, every day the exchange, when it opens trading, essentially opens such a "book" and records every bid it receives.
What should be written in the order?
First of all, there must be an abbreviated name of the stock, or, in professional slang, the "ticker," to understand which book to get off the shelf. For example, Facebook shares have a ticker consisting of two letters FB, while Apple shares have four letters - AAPL.
Second, the order must indicate the direction of the transaction, i.e. "buy" or "sell". This is how the exchange understands whether to record the incoming information on the left or on the right page of the book.
Third, the order must indicate the price per share, so that the exchange can sort the orders in descending order of price from top to bottom.
Fourth, the order must specify the volume in lots, that is, how many lots of shares we want to buy or sell. To clarify: Shares on the exchange are not traded by the piece, but by the lot. The lot size is set by the exchange. One lot may be equal to one share, or a hundred, a thousand, or even ten thousand shares (depending on the specific share). This is really handy because the price of one share can be equal to, for example, the price of your computer (then 1 lot may be equal to 1 share), and sometimes 1 share may be worth as much as a box of matches (then 1 lot may be equal to a thousand shares). Why "may be"? The specific rules for determining the lot size depend on the laws of the country and the exchange itself. For example, on the New York Stock Exchange (NYSE), the usual size of 1 lot is equal to 100 shares.
So, let's return to our example. Suppose we want to buy shares of FB at a price of $100 per share in the amount of 10 lots. Then the exchange will record the following on the left side of the FB book:
100$ 10
Then there is a seller who wants to sell FB stock at $110 per share in an amount of 20 lots. Then this is what the exchange will record in the right side of the book:
110$ 20
Then there is a buyer who wants to buy FB stocks at $115 per share in an amount of 25 lots. The entry on the left side of the FB book will look like this:
115$ 25
And now comes the interesting part.
Did you notice that the $115 price in the last buy order is higher than the single sell order of $110? That means the buyer is willing to make a deal at a price even higher than what the seller is offering. So at what price and what volume will the deal end up being made?
Please wait for the next post.

Picking rules - the Lynch methodBack in 1977, the still famous investment company Fidelity Investments entrusted the management of a small fund of $18 million to this very man. The next 13 years were impressive for the Magellan fund and its manager - the famous Peter Lynch. The fund's assets grew to $14 billion, more than doubling the average annual growth of the S&P500 stock index.
When he stopped actively managing assets, Peter shared his approach with the rest of us. Some of his thoughts inspired me to create my approach and may be useful to you as well.
1. The private investor has an objective advantage over institutional investors (e.g., funds) because he is more agile. He is not burdened by the need to coordinate his actions with the management of the company, and his purchase requests are easily satisfied by the market. Agreed, it's easier to buy for $1,000 than it is to buy for $1 billion. Thus, the private investor can catch prices that the big "players" will have a hard time getting.
2. Don't spend everything you have under your belt on stock investments. The trades will not be able to close "in the plus" just by your own volition. So first provide yourself with a financial safety cushion, a stable job and a place to live, and then start investing.
3. Admit to yourself: are you a patient person who is capable of making independent decisions, diving deep into analysis and soberly reacting to plus and minus changes? If not, practice, but on small volumes.
4. Never buy a company's stock if you can't explain what it does and can't talk about its financial performance. The stock market is no place for gambling. There are slot machines, etc., for that.
5. The company works for profit and grows because of it. So keep an eye on everything that affects profits. Evaluate the company not in monetary units, but in the number of profits.
6. Watch where the company invests its profits. If it's mostly capital investments that will probably make a profit someday, in the distant future - think about it. After all, the beautiful future as conceived may not come. If, on the other hand, the company is allocating its profits to buying its own stock, it means that management thinks the current stock price is attractive enough.
7. The success of the stock may be unrelated to the company's financial success. Beware of such investments.
8. A company's financial success may not be reflected in its stock price for a long time. However, the longer the period in question, the more direct the relationship. So if you select companies based on an analysis of financial performance, be prepared to make a long-term investment.
To this day, these thoughts help me look at assets consciously and not give in to spontaneous decisions.
What do you think of this approach?
I dream of entering the stock market. The question is: What for?Read the previous part of the post here .
Having received only denials, the owner of the workshop decides the following: it would be great if shares were sold and bought not in the offices of banks, but in one single place - the stock exchange. Then those who want to vote would be able to buy as many shares as they need votes. Those who want a discount will wait until the price on the stock exchange falls to an acceptable level for them. And those who bought one share would be able to sell it at any time at the exchange price. The owner likes this idea and decides to list his shares on the stock exchange.
Another term to remember is listing. Listing is the service of the stock exchange to allow the shares to be traded on the stock exchange.
Now the shares can be bought or sold in one place, simply by connecting to the stock exchange trading through brokerage companies. The banks, which have brokerage licenses, also liked it. The main thing is that now they do not have to convince clients to buy shares for dubious rights, you can just say that the price at the exchange is constantly changing, and if you buy shares at $ 1000 now (in the bank office), then a month later at the exchange you can sell them already at a higher price. This created a real stir around the company's shares, and they were bought up from banks at the IPO price - that is, at the original price of $1,000 per share.
A significant advantage for any investor is the ability to buy or sell shares quickly and easily. That is exactly the kind of opportunity stock exchanges provide. If there were no stock exchange, the owners of shares would have to look for buyers on their own. But now they have the opportunity to connect to the exchange and make a deal at any time.
As soon as the stock exchange started trading, the share price of the workshop came to life. This attracted new investors who tried to buy cheaper shares and sell at a higher price. Such investors include you and me.
So what we know so far:
- A company needs stock to sell a share of its business and get real money.
- Shares can only be issued by a public company.
- Shares give its owner rights: to vote, to receive agreed dividends, and to receive a share from a bankrupt company.
- The initial sale of shares to the public is called an IPO (initial public offering).
- During an IPO, shares are sold not on the stock exchange, but through brokers or banks.
- The first day of stock trading on the stock exchange is the completion of the IPO process.
- In order for the shares to be traded on the stock exchange, the company has to go through the listing procedure.
- It is only possible to buy shares on the stock exchange through a licensed broker.
- The exchange price is constantly changing during trading.
The workshop story may give the impression that we small investors are only being used to get money from us in exchange for unnecessary rights. However, it is important to understand that we are more interested in the opportunity to profit from the growth of the shares than in gaining formal rights. It is this desire that unites all shareholders of a company, whether you have one share or a million.
A joint-stock company can be compared to a hotel with many identical rooms. One share is one room. If the hotel is doing great and making a profit, investors will want to buy more rooms, and sellers will want to sell more rooms at a higher price. If the hotel performs poorly and makes a loss, then room owners will get rid of them (i.e. sell even at an unprofitable price to get money and find another hotel that is more attractive for investment).
The strategy I will share will be to find, figuratively, great hotels (in fact, joint stock companies) during a room sale (i.e., a period of declining stock).
We'll figure out how stock prices are formed on the stock market soon. See you next time!
