MP Materials Strong as Expected$MP made a new ATH just recently as I was/am expecting this stock to go far, however, the wave count and the indicators show that the price acceleration has taken the stock to the overvalued zone. The price can still go up if momentum traders pick up the stock and push it more towards the sky, however for long term investors the valuation is becoming rich for what it is today and I think it is time to trim a bit to lock in some profit or start to sell covered calls
Valueinvesting

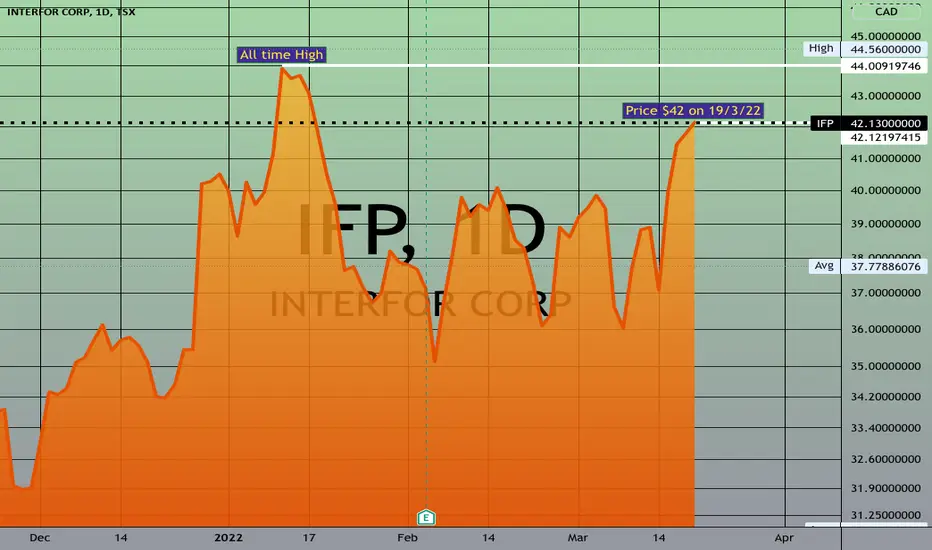
Investment idea - forestry and lumber. - Interfor Corp - CanadaInterfor Corporation IFP - Canada (IFP)
Interfor Corporation is a Canada-based forest products company. The Company and its subsidiaries produce wood products in British Columbia, the United States Northwest and the United States South for sale to markets around the world.
At the time of writing this on, 19/3/2022, the share price at $42 is just a whisker below the all-time-high of $44 reached in mid January.
Interfor Corporation is the 7th largest producer of sawmill timber in the world. Interfor Corporation operates about 15 sawmills in Canada, Oregon, Washington, South Carolina, Arkansas and Georgia. Most of the land on which the company harvests timber is owned by British Columbia. Interfor makes lumber for the construction market, logs for industrial processing, and wood chips for pulp production.
The company says it is “The only pure-play lumber producer of scale”
Why am I buying Interfor?
With a prospective p/e ratio of below 4, a possible dividend yield of over 5%, (see dividend comments below), high historical sales and earnings growth, and sharply rising analysts' forecasts, the fundamentals make Interfor look like the most attractive in the forestry and lumber producer sector. I like the inflation play. It has very strong positive cash flow. Net income, (before non-cash items and acquisitions), is equivalent to one-third of its market cap.
Catalyst for more growth
The timber production market is highly fragmented. This has historically worked to Interfor’s advantage. Multiple acquisitions have have helped Interfor to grow.
Potential takeover offer
Interfor’s annual accounts and cash flow statement show that in 2021 they had net earnings of CAD819 million before items not involving cash, and before investing activities. That’s a third of its CAD 2.4 billion market cap. A takeover of the company could be easily financed out of its own cash-flow, with plenty left for the acquirer. Given their modest size of USD 1.92 billion, they could easily become the target of a larger rival or a value investor. I think Interfor would be an interesting acquisition for a seasoned Canadian investor, such as the 91-year-old Jim Pattison of Jim Pattison Group. He owns 51% of rival Canfor Corp.
The largest investor in Interfor is Letko, Brosseau & Associates Inc. They own 10.8% of Interfor Corp. They are a Canadian institutional investment manger, with an interests in "Growth Through Value Investing" and in "Sustainable investing". They often exercise their shareholder votes, particularly when there are takeover offers, typically refusing what they see as low-ball offers. If Jim Pittard wanted to acquire Interfor he would need to get Letko Brosseau onside first before making any offer.
Lumber Prices
High Lumber prices boost Interfor’s profit.
You are no doubt aware that Lumber prices have been strong over the last 2 years.
Year end Price Random Length Lumber futures on CME front month.
2014 $319
2015 $247
2016 $328
2017 $459
2018 $343
2019 $416
2020 $716
2021 $1227
18/3/22 $1200
The average selling price of Lumber in Q1 2020 was $842. In Q1 2021 it was $1143. So far in Q1 2022 it looks like it is going to be about $960.
See the 50 year and 3 year charts below.
Various reasons are being given for the high Lumber prices. These include flooding in British Columbia. It knocked out road and rail links in December. Mudslides disrupted Vancouver shipments. Beetle infestations, wildfires, and government restraints on tree harvesting limited availability of mature trees. Sawmills were said to be struggling to keep up with demand in part due to a shortage of workers. At the same time the supply chain was being disrupted by the pandemic effect on the transportation network. There simply were not enough vehicles or trucks to get lumber to market, so backlogs were building up at sawmills. The net effect was that supply to the market fell.
At the same time, the Pandemic created unprecedented demand for home improvements. Home improvements more than compensated for any fall in homebuilding due to the pandemic. It was a perfect storm. Supply fell and demand rose.
Since some of these one-off effects are now dissipating we could see lumber prices going lower as supply returns to normal. On the other hand any extra supply might be absorbed by new home construction. Home-buiding is said to have been constrained during the pandemic. Going forwards, lumber prices are likely to be heavily influenced by housing starts. With property prices up around 15% over the last year, it looks like demand is currently strong. Freddie Mac sees house price inflation gradually dropping to 2.5% by 2023, but obviously that still means higher prices than at present, and ongoing demand for new constructions.
According to many articles housing inventories vs demand are at record lows for decades, and it’s likely to take years before the supply and demand balance out.
Dividend:
In May 2021 Interfor declared a "one-time special cash dividend" of $2. At the time they wrote: "“This special dividend reflects a partial distribution of the extraordinary cash flows being generated from record lumber markets” said Ian Fillinger, President and Chief Executive Officer. “We are able to reward our shareholders with this return of capital, while retaining ample financial flexibility to complete our multi-year strategic capital plans, grow significantly through acquisitions and continue to buy back Interfor shares.”
Will this “one-time” special dividend be repeated this year? I am concluding that it is possible for several reasons: Firstly the company has more liquid cash on hand at the end of 2021 than it had at the end of 2020. In fact it has more than four times the cash needed to pay the same dividend. Secondly, the price of lumber remains strong, well above the average during 2021. Thirdly, the company recently expressed strong confidence about the lumber price driven by strong demand from new housing starts, and stated that it is well positioned with a strong balance sheet and “significant available liquidity”. Fourthly the company share capital has reduced by about 10% due to share buy-backs in 2020. This means that the same special dividend would cost less than last year.
If the company pays a $2 special dividend - as per 2021, the yield will be 5%. The decision on dividend should be made in May.
Share buy backs
In 2021 Interfor purchased nearly 10% of its share capital. It was 100% of the amount allowed. The authorisation has been renewed again for 2022, again allowing for the purchase of nearly 10% of the share capital.
Sales Growth
Interfor’s historical lumber sales growth is reported as being 16.41%. In 2021 it was +50% helped by the acquisition. Analysts are forecasting that Interfor’s sales will increase by 17.3% in 2022.
Acquisition
The company made a major acquisition late last year (Eacom Timber Corp). As a result of this and high lumber prices, analysts have been raising their EPS forecasts for 2022. Currently analysts are forecasting EPS of close to CAD 11 per share. in 202 Interfor reported EPS was $12.80. The share price is currently close to $42 so the prospective p/e ratio is low (around 4x). If the company pays a $2 special dividend - as per 2021, the yield will be 5%. The decision on dividend should be made in May. Interfor’s historical lumber sales growth is reported as being 16.41%. In 2021 it was 50% helped by the acquisition. Analysts are forecasting that Interfor’s sales will increase by 17.3% in 2022.
Earnings
The future earnings of the company will, to some extent, depend on Lumber prices. The higher the better. The demand for Lumber will be heavily influenced by new home constructions. Interfor is thus an inflation play, especially if house prices keep rising.
Analysts are increasing their earnings forecasts.
Click below to see the latest lumber price progression
CME:LBS2!
Growth vs. Value: Skating to Where the Puck Will BeHockey legend Wayne Gretsky famously said: "Skate to where the puck is going to be, not where it has been." This sometimes applies in investing and trading.
Towards what object have investors been skating, figuratively speaking?
Currently, financial media, fund managers, and commentators have been emphasizing the opportunities in value over growth for several months. And for good reason: Energy, a value / cyclical sector unloved for about a decade, has outperformed every other sector this year by a huge margin. It has risen by approximately 20.5% since January 1, 2022. Even it's uptrend channel could not contain it (although it looks to be consolidating at the moment or perhaps mean-reverting).
Increasingly, market participants have been "skating" towards value areas and away from growth for over a year now, as anyone who has been burned by long trades in tech / disruptive innovation knows. For example, a spread chart (also called a ratio chart) of ARKK/SPY shows just how dramatically growth has struggled. ARKK is a well-known US ETF containing high-beta stocks typically categorized as disruptive-innovation stocks, i.e., high growth names. This chart evidences just how much growth has struggled vs. the S&P 500. Notice, though, how this spread chart shows how close to major, long-term support the ratio has moved.
Examples abound of high-growth names having been crushed in powerful bear markets in those names. Some of them are even top names with innovative products and services and an impressive record of earnings / sales growth: Square ( NYSE:SQ ) has declined about -68% from all-time highs, Upstart ( NASDAQ:UPST ) fell about -81% from its high to its low in late January 2022, and ( Roku ) dropped about 78% from its peaks. Even large cap tech not gone unscathed: Facebook NASDAQ:FB suffered a nearly -50% decline after a huge earnings / guidance disappointment. But in general, large-cap tech has been the exception in growth until the selloff this year. While growth / tech in general has struggled for months, large-cap tech names such as GOOGL, AAPL, MSFT, and NVDA have outperformed. Even AMZN's sideways move for about a year should be considered outperformance relative to other high-growth names as shown by the ARKK chart above: see the chart below, which is a relative chart of AMZN vs. ARKK, revealing that even with AMZN's lengthy sideways move, it has dramatically outperformed growth / tech names more generally.
Markets are in constant flux. So often, just when the little people (retail traders like me) take notice of a powerful new trend or outperformance, it ends. So I'm trying to watch for where markets are moving rather than focusing on where they are.
In short, is growth bottoming out relative to value? Here are a few charts to consider.
1. The main weekly chart above (also copied below) is a spread chart showing the ratio of NASDAQ:IJT (small-cap growth) vs. small cap value. Notice how close to major long-term up trendline support the ratio has moved. And the weekly ratio is also right at support at March 2021 and May-June 2021 lows. The RSI for this relative chart also shows that it's oversold to 33.65, a level that only appears in multi-month (and often multi-year) intervals. Even the two RSI lows in 1H 2021 occurred 2 months apart, but this is the exception looking back longer term.
2. Large-cap growth is right at support at a long-term uptrend line. See the weekly spread chart of the ratio between XLK/SPY. AMEX:XLK is a US ETF that is heavily weighted towards large-cap tech.
3. Equal-weighted growth vs. equal-weighted tech RYG/RPV is also very close to long-term upward trendline support.
4. Interest rates are nearing long-term downtrend channel resistance—at the upper line (the actual downtrend line). Interest rates have soared powerfully since mid-2020, and the Federal Reserve has hawkishly signaled coming rate hikes, and market participants have behaved as though rates will keep on going to the moon—by selling tech / growth, which struggle when rates rise b/c of discounting of future cash flows used to value such names. The viewpoint that rates could turn around in the near future seems radical, contrarian and unreasonable. But consider this chart below. Could rates turn around just after a large move just after millions of market participants have been flocking towards value names that outperform in rising-rate environments?
Some well-known experts have already taken this view. www.cnbc.com
It seems priced into the market right now that the 10-year yield could continue rising, that the interest rates could even breakout higher above long-term downtrend resistance, and that the Fed is likely behind the curve in controlling inflation. It seems consensus that value could continue to outperform long-term, and that growth could break even long-term support levels and continue to plummet. But if this is priced into the market, shouldn't one consider buying what's already priced in? Especially because maybe what is priced into the market will not last. Thinking about where the "puck is going to be" may suggest that tech / growth is making a multi-month or multi-year low or that interest rates are going to pullback in the next few months, allowing tech to thrive again.

Tesla has some work to doHello Friends!
Tesla had a great earnings call. Unfortunately, Tesla’s value is very high and it’s having a hard time through these market selloffs.
At this point Tesla needs to hold $814 (200 day) and then it needs to break above its $903 resistance.
As always thanks for your follows, likes, and comments. Let’s learn and grow together. Cheers!

The Investor Mentality: Are You a Worthy Investor?There are two types of people: people who will read through this entire post and put themselves on a life-changing path towards generational wealth by understanding the essence of investing, and people who simply won't read this post. This post may be lengthy and abstract, but I guarantee you that comprehending the concept of what it means to invest, and how to do so, can change your life forever.
This is not financial advice. This is for educational purposes only.
Capitalism is much simpler than you think. The goal of the game, as the name suggests, is accumulating as much capital as possible. Interestingly enough, there are only three ways to achieve this goal, and if anyone tells you otherwise, they're either lying or they're a crook. The method is simple - you need to own the three means of production: land, labor, and capital.
Land: Only 30% of earth's surface is covered by land. Land, contrary to common belief, is rare in the sense that it's limited. If you own land, you can have factories and houses built on your land, through which you can receive rent. This was also prevalent in the past where aristocrats allowed peasants to farm on their properties, taking a certain percentage of the crops that were harvested without even breaking a sweat.
Labor: When you own labor as a means of production, it essentially means that you run a business. What this implies might not be intuitive, but it simply means that you're paying money to buy someone's time. Time is a resource that is much more important than money. Money is infinite, and can even be printed. As for time, both Jeff Bezos and a freshman at college both get 24 hours a day. The difference between the two, is that Jeff Bezos can pay the freshman and hire him to work on whatever needs to be done. Essentially, Jeff is paying to buy the freshman's time, a limited resource.
Capital: Capital is the magic sauce that allows all of this to happen. You can buy land, buy someone else's time, and even buy companies that do all of the above on your behalf. But, capital is no good if you don't make that capital work for you. You can lend capital to someone who needs it, and receive interest payments. In this case, interest is simply understood if you think about it as the cost of borrowing money. The name of the game is to either make the capital work for you, or convert that capital to other means of production, which then bring you more capital, ultimately creating a virtuous cycle.
When people invest in stocks, oftentimes they get too caught up and focus only on the price action, and forget the fact that buying a stock represents ownership of the company. In other words, if you own 10% of Tesla's shares, you have ownership of 10% of the company whether the company is valued at $800B or $2T. So what do you do when a company that's supposed to be worth $1T, judging by the amount of money it makes (cash flow) and the growth it's showing, drops to $800B? The most logical course of action is to buy more shares. You want to buy more ownership of the company for a cheap price, because you know that the company is going to buy other people's time (labor) and use that to generate more capital for you.
It seems so easy, but there's a reason why most people fail at investing. Our brains are biologically wired to focus on short term consequences, and we fail to look at what's best for us in the long term. Thus, we make dumb mistakes like selling perfectly good assets just because "the price dropped too much".
"A price drop is an opportunity to buy more of a good prospect at cheaper prices." - Peter Lynch
Unfortunately, most people sell when the price drops, because fear, uncertainty, and doubt take over their mind. There is a reason why billionaire hedge fund manager Bill Ackman bought over $1.1B worth of Netflix stocks when the price dropped. He saw no fundamental changes to the company, yet the price dropped due to certain people's irrational decision to sell. And I'm very positive that there's a high chance that Bill will be the last one laughing in the end.
I believe that there are only three reasons for you to sell a perfectly good asset: 1) when the narrative has changed (fundamental change in the asset), 2) when you find a better asset, and 3) when selling is inevitable to save your entire position (ex. selling to pay taxes). Unless there is a clear reason for you to sell that fits into one of these three criteria, selling is probably not the best idea. If you truly understand what it means to invest, and convince yourself on why you should be buying or selling at certain levels, you can, and will become a successful investor. Think big, be optimistic, and have patience.
If you like this educational post, please make sure to like, and follow for more quality content!
If you have any questions or comments, feel free to comment below! :)
Is Bunge Breaking Out?The rise of inflation has investors quietly returning to many commodity-related stocks that were popular 2003-2007. One of them is Bunge.
Earlier this month, the soybean processor touched its highest level in over 13 years. It pulled back but is trying to stabilize around the same $92 area where it peaked last May. Is old resistance new support?
BG is also near its 50-day simple moving average.
Next, notice how the stock rallied after its last three earnings reports. (Each beat estimates on the top and bottom lines.)
Third, something of a rotation seems to be taking place because other similar names like Archer Daniels Midland, Mosaic , CF Industries and Deere are also above their 50-day moving averages. (Unlike the S&P 500.)
Overall, it’s been a tough start to the year for most major stocks. But certain corners of the market have held up better. Traders may start focusing on the emerging relative strength in agriculture-related names like BG.
TradeStation is a pioneer in the trading industry, providing access to stocks, options, futures and cryptocurrencies. See our Overview for more.
Important Information
TradingView is not affiliated with TradeStation Securities Inc. or its affiliates. TradeStation Securities, Inc., TradeStation Crypto, Inc., and TradeStation Technologies, Inc. are each wholly owned subsidiaries of TradeStation Group, Inc., all operating, and providing products and services, under the TradeStation brand and trademark. When applying for, or purchasing, accounts, subscriptions, products and services, it is important that you know which company you will be dealing with. Please click here for further important information explaining what this means.
This content is for informational and educational purposes only. This is not a recommendation regarding any investment or investment strategy. Any opinions expressed herein are those of the author and do not represent the views or opinions of TradeStation or any of its affiliates.
Investing involves risks. Past performance, whether actual or indicated by historical tests of strategies, is no guarantee of future performance or success. There is a possibility that you may sustain a loss equal to or greater than your entire investment regardless of which asset class you trade (equities, options, futures, or digital assets); therefore, you should not invest or risk money that you cannot afford to lose. Before trading any asset class, first read the relevant risk disclosure statements on the Important Documents page, found here: www.tradestation.com .

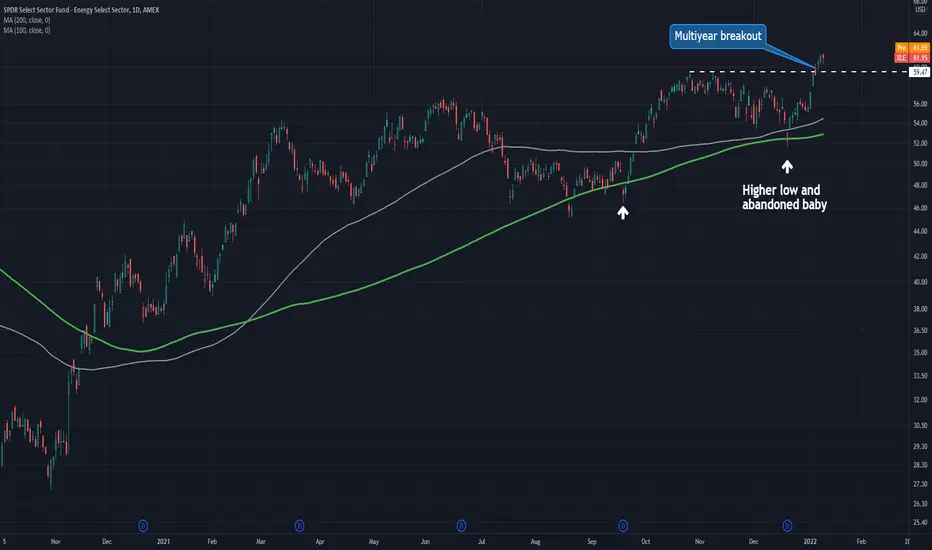
Energy and Financials Look Like Tech 5-1/2 Years Ago2022 has begun with another sharp rotation from growth to value stocks. The SPDR Technology ETF had its biggest weekly drop in over a year, while the SPDR Energy ETF had its biggest gain in even longer.
Financials also jumped:
Price action in the two value sectors (XLE and XLF) seems to resemble XLK another moment 5-1/2 years ago. The chart below shows XLK between January 2015 and November 2016. Notice how the tech ETF spent more than a year consolidating sideways after a big run, chopping along its 100- and 200-day simple moving averages (SMAs) before breaking out. There was also a bullish candlestick pattern (post-Brexit kicker) on June 27-28, 2016:
XLE and XLF haven’t consolidated as long as XLK in 2016, but they have other similarities. Both moved sideways for at least six months and spent time below their 100-day SMAs. Both made one final higher low at the 200-day SMAs. Both had potentially bullish candlesticks (abandoned-baby hammers). And, most importantly, both closed at new highs.
It’s also noteworthy that XLK’s 2016 breakout helped launch the current regime of FANG and “big cap growth.” Now as investors shed tech stocks and monetary conditions grow less favorable , similar breakouts have occurred in the polar-opposite sectors. Are we entering a new phase of the market, led by neglected cyclical value names?
TradeStation is a pioneer in the trading industry, providing access to stocks, options, futures and cryptocurrencies. See our Overview for more.
Important Information
TradingView is not affiliated with TradeStation Securities Inc. or its affiliates. TradeStation Securities, Inc., TradeStation Crypto, Inc., and TradeStation Technologies, Inc. are each wholly owned subsidiaries of TradeStation Group, Inc., all operating, and providing products and services, under the TradeStation brand and trademark. When applying for, or purchasing, accounts, subscriptions, products and services, it is important that you know which company you will be dealing with. Please click here for further important information explaining what this means.
This content is for informational and educational purposes only. This is not a recommendation regarding any investment or investment strategy. Any opinions expressed herein are those of the author and do not represent the views or opinions of TradeStation or any of its affiliates.
Investing involves risks. Past performance, whether actual or indicated by historical tests of strategies, is no guarantee of future performance or success. There is a possibility that you may sustain a loss equal to or greater than your entire investment regardless of which asset class you trade (equities, options, futures, or digital assets); therefore, you should not invest or risk money that you cannot afford to lose. Before trading any asset class, first read the relevant risk disclosure statements on the Important Documents page, found here: www.tradestation.com .
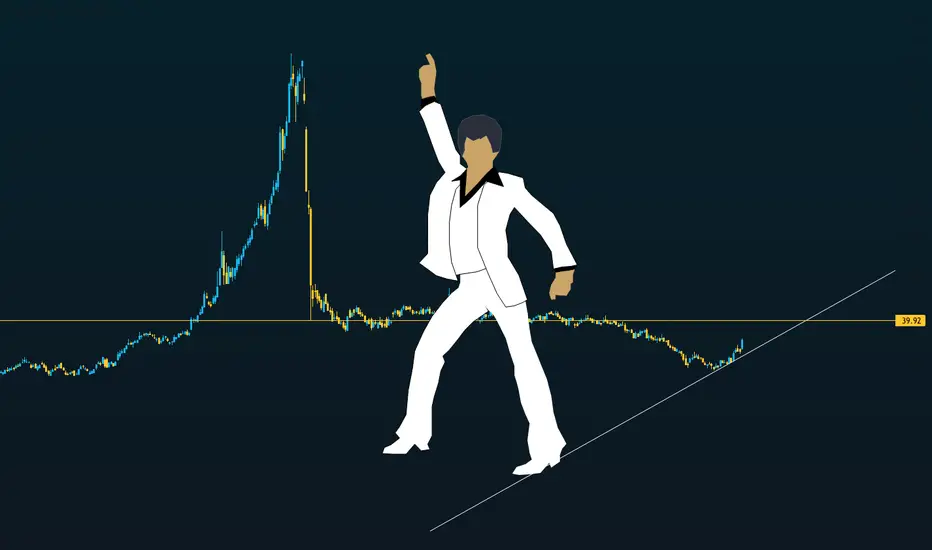
Staying AliveI don't know about you, but I got the Saturday Night Fever for VIAC.
Since Archegos made its fatal misstep, VIAC has been under short pressure from the Shylock.
Tax harvesting has relieved some of that pressure from shorts.
Add market sentiment shifting to risk off appetite,
We will likely see a retro stock like VIAC back in fashion this year.
I'm not saying the dance will rise to 100 again, but an ascending triangle breakout might see the 40-50 range again by the end of jan.
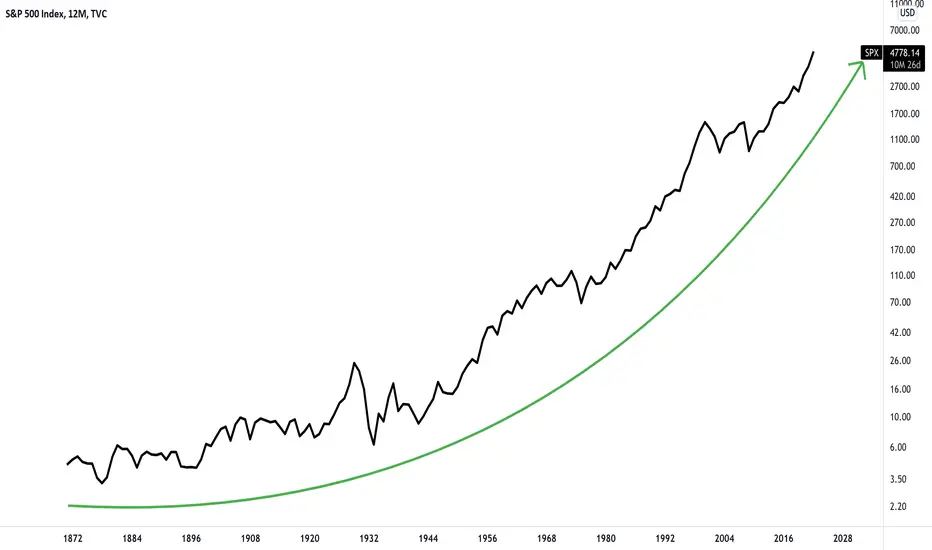
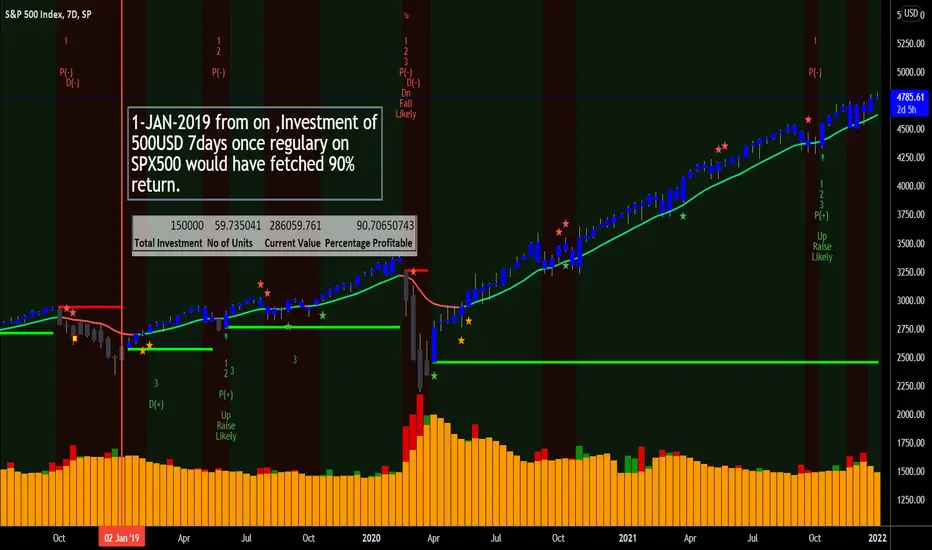
SPX500 Index Investing -Popular method yet less known methodDo you know regular & consistent investment strategy leads to wealthy financial asset creation ?
Simple way of doing the investment would result bigger wealth accumulation over a period of time.
It is interesting ,Backtest proves YES it works :)
Have collected data of SPX500 from 23-09-2013.
Goal was to put 500 USD every 7D (weekend ,holidays excluded) & irrespective of Markets accumulate the units.
This goes like this ....
2013-09-23 1695 500 0.294985251
......
......
......
2022-01-3 4788 500 0.104410073
Summary :
Total USD invested : 150000
Total systematic investment : 300 times
Total Units accumulated : 59.73
Current value of the investment : 286059
Profit percentage : 90%
How you can do this kind of analysis,The data can be downloaded from Tradingview .
Go to Menu (top left corner)--> Export Chart Data -Download the CSV --> open the CSV file - keep only Date ,Open,high,Low,Close data and in F column and G colum do the math and sum the data from F1:F300(last row) G1:G300 you will get the accumulation value.
Refer the screenshot i put below in comment section that will show how to do this.
If you like this Comment and like ...
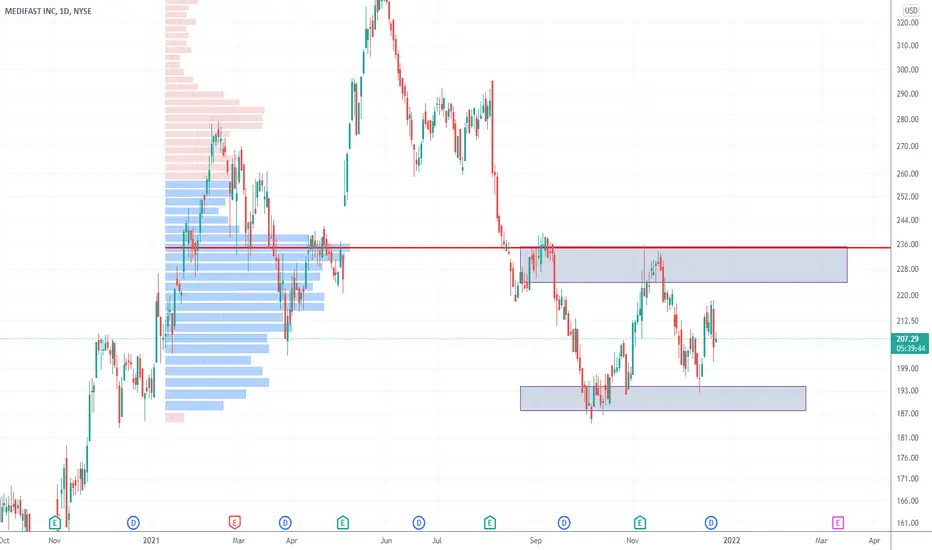
MED - underrated stock?Hello my dear subscribers
Finally I am back with new investing candidates.
Today we will talk about Medifast Inc.
It is personal services company, which made own product OPTAVIA for peoples, which want change their lifestyle and habbits on healthy and strong.
Levels for entry are here:
From 1-year profile we have 2 levels.
First level is at 188.42 to 197 USD. That is lower part of market profile and price haven't fallen lower. And from that levels price jumped up. Here we can buy stocks with cheaper prices.
Second level is at 223 to 235 USD. That was most popular price with biggest volumes and value for market. It is chance to breaking POC to grow up - it can be positive for both swing traders and long-term investors.
Ok, now reasons - why I am thinking that MED will grow fine(source - Guru Focus service)?
First: all 2018-2021 year company acts good with good financial result.
Net margin is 11,18% and operating margin has meaning 14,67%
ROE has meaning 91,53%
Last 3 years EPS growth at 56% - which is unique for that industry.
And here is no manipultion with financial results. Medifast Inc DO NOT provide activity, which is unusual for that industry.
Second: really stable financial situation
Low debts (10%), enough cash to pay for debts, high interest coverage and extremely high meaning ROIC (274%) cause strong financial stability for Medifast Inc.
Third: well organized business
Company works with clients directly, without any third parties. And allow work from home for couches and sellers. This new organization caused 92% of sellings.
Company has good PEG ratio (0,44) and fast-circling product.
Medifast Inc continue to buyback her stocks and makes strong investing in growth.
In official statements Medifast Inc plans to move on Asia-Pacific markets. Strongest points are Hong Kong and Singapour.
They are reasons, why at my opinion price and value of the company will grow after new year.
So just expecting financial statement 10-K at 31 december.
SIMCORP A/S | UNDERVALUED | MARGIN OF SAFETY 47%Hello investors! It has been a while since I posted my latest investing idea/opprotunity.
I have been researching SIMCORP A/S for a while now.
For my intrinsic value I used a formula from "RULE 1 Investing" by Phil Town.
I have calculated 3 differend intrinsic values for 3 differend scenarios.
Optimistic: 1999,61 kr
Neutral: 1282,01 kr
Pesimistic: 837,64 kr
Actual value at the moment: 678,40 kr
This gives us a margin of safety of the neutral scenario of 47 %.
I would recommend to put STOP LOSS and TAKE PROFIT in the areas shown, but maybe consider the stock to be a long term buy, given the undervaluation, that you do not see often these days.
This makes SIMCORP A/S seem like a nice buy. In 2020 the stock value and company revenue has dropped by a lot, but looking into 2021 data gives me a strong confidence, that the stock should grow in the future.
I would like You to give any kind of feedback on my idea and maybe point out any flaws within the company, that can lead to stock price drop.
I wish you all successful investing!

Value Rotation Possible?Noticed KO seems awfully familiar to MSFT chart. Nice consolidation over the past 20 years and if we do see a value rotation KO could be a nice buy and hold with some great potential gains.

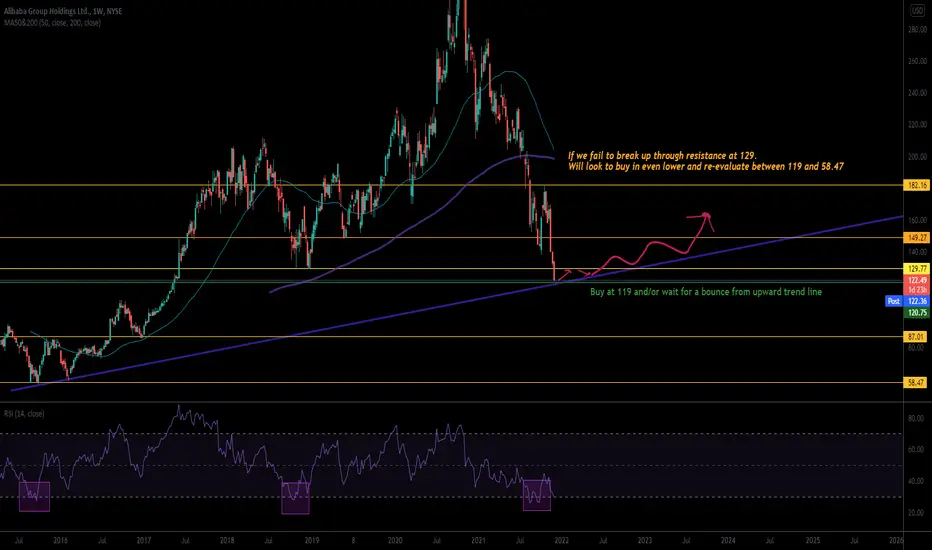
ALIBABA BOUNCE FROM TREND LINE Alibaba oversold - RSI is low, historically this has preceded growth.
P/E and P/B are low compared to other industry players and historically. Stochastic RSI was also down so tomorrow may be good for a buy.
Debt to equity ratio decreasing. despite a bit of increased dept from a few Quarters ago.
Let's see what the next few days bring, likely will open a buy position. I will update with TP levels.
Hope you enjoy the idea. Let me know what you think below, anything to add or that I miss?
Good day to you
NYCB - Swing Trade
Buying in now at $12.59
Sell at $14
New York Community Bancorp is trading below fair value. I anticipate when tech stocks make reversal we will see bank stocks gain more steam as investors swing back into more value stocks.
RSI is at ideal level, and Squeeze Indicator is showing good momentum.

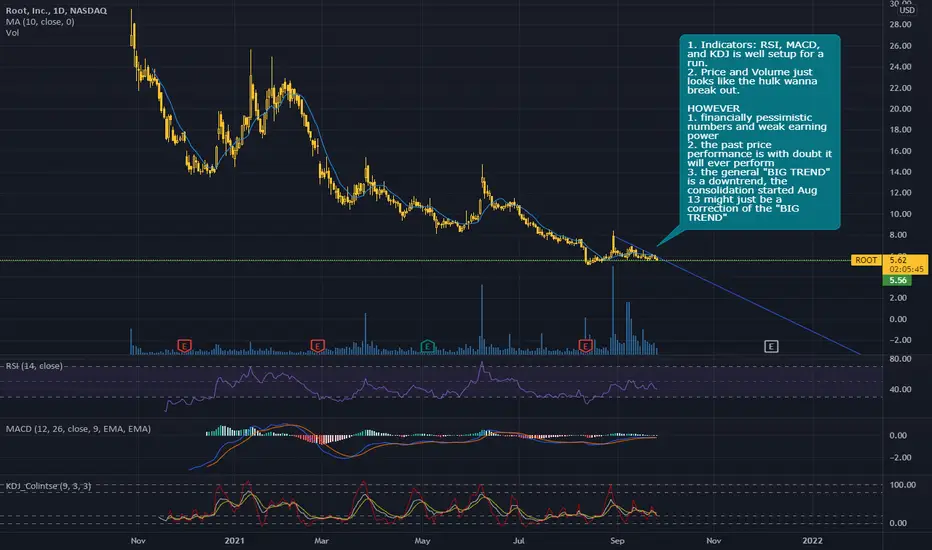
ROOT - Daily - Break or No Break?1. Indicators: RSI, MACD, and KDJ is well setup for a run.
2. Price and Volume just looks like the hulk wanna break out.
HOWEVER
1. financially pessimistic numbers and weak earning power
2. the past price performance is with doubt it will ever perform
3. the general "BIG TREND" is a downtrend, the consolidation started Aug 13 might just be a correction of the "BIG TREND"
If I were to play this, (in my opinion):
-Buy shares sell covered calls.
-option premium is great at the moment.
-sell some puts?
MOMO - Monthly - Value Trap? or Value Buy?1. Price has entered the 2015 level
2. RSI Flattening out
3. MACD is crossing below -0 (personally i think is unreliable)
4. Volume is above average from Sep 2020
5. KDJ is at bottom
6. Financial Reports are positive net income with attractive PE
7. Market comparison with Tinder is just a huge discount,
8. although it is a Chinese company which has political risk, the political risk discount seems included at current price.
9. ~ 4.5% annual dividend for a tech

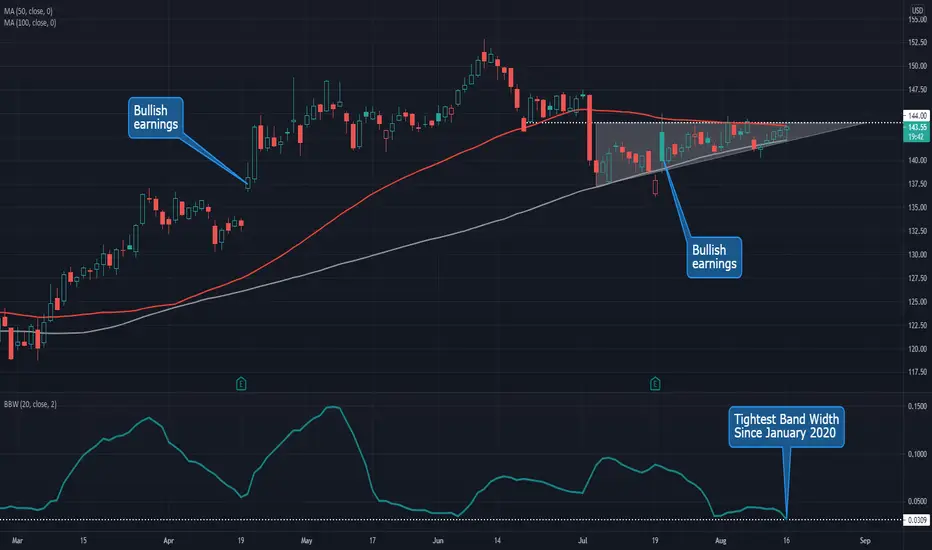
Is IBM the Next Oracle?A lot of people forget about International Business Machines. However the 110-year old tech giant’s chart has some interesting patterns.
First and most important is the series of higher lows since early July. IBM has been trapped around the same $144 area where it bounced on June 21. That combination (higher lows + resistance) has produced a bullish ascending triangle with breakout potential.
Also notice how the 50-day simple moving average (SMA) and 100-day SMA closely match the top and bottoms of the ascending triangle.
The current squeeze is so tight that Bollinger Band Width has narrowed to its lowest reading since January 2020. This could add fuel to a breakout.
Finally, don’t forget about Oracle. The lumbering software giant broke out this year after its Cloud business improved. IBM gapped higher after showing similar progress its last two quarters. With a 12x forward P/E and price/revenue under 2x, it could also benefit from sentiment shifting toward value stocks.
TradeStation is a pioneer in the trading industry, providing access to stocks, options, futures and cryptocurrencies. See our Overview for more.
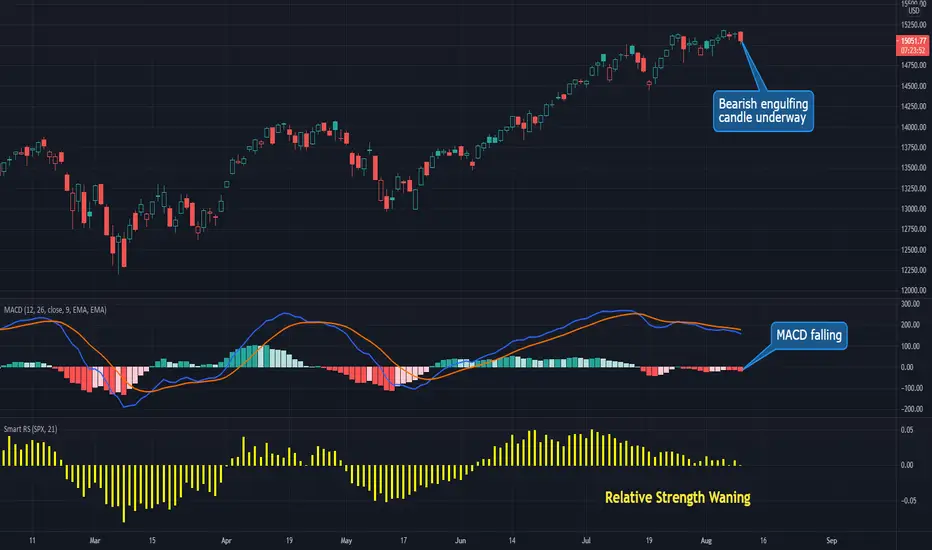
Nasdaq Shows Signs of Fatigue as Cyclicals GainThe Nasdaq-100 has led the broader market since early June, but now the tech-heavy index is showing signs of fatigue.
First, consider its falling MACD over the last four weeks. That’s occurred as the index struggles around 15,000, a sign of bearish momentum developing.
Second is the waning relative strength versus the S&P 500. NDX is starting to lag at the same time cyclicals like financials and industrials start to gain. That suggests money could be shifting back toward “value” and away from “growth.” This pendulum has swung a few times in the last year. Now could also be a logical time for it to happen again because bond yields are rising and Big Tech earnings have passed.
Speaking of Big Tech earnings, several major NDX members suffered technical damage in their last quarterly results. Amazon.com and Facebook gapped lower (and have yet to recover). Netflix is flying a potential bearish flag. Even Apple failed to break out on a stellar quarter.
Overall NDX isn’t explicitly bearish, but investors may be getting ready for another rotation back toward smaller and more cyclical stocks. Big growth names could get sold to make room for financials and industrials.
TradeStation is a pioneer in the trading industry, providing access to stocks, options, futures and cryptocurrencies. See our Overview for more.
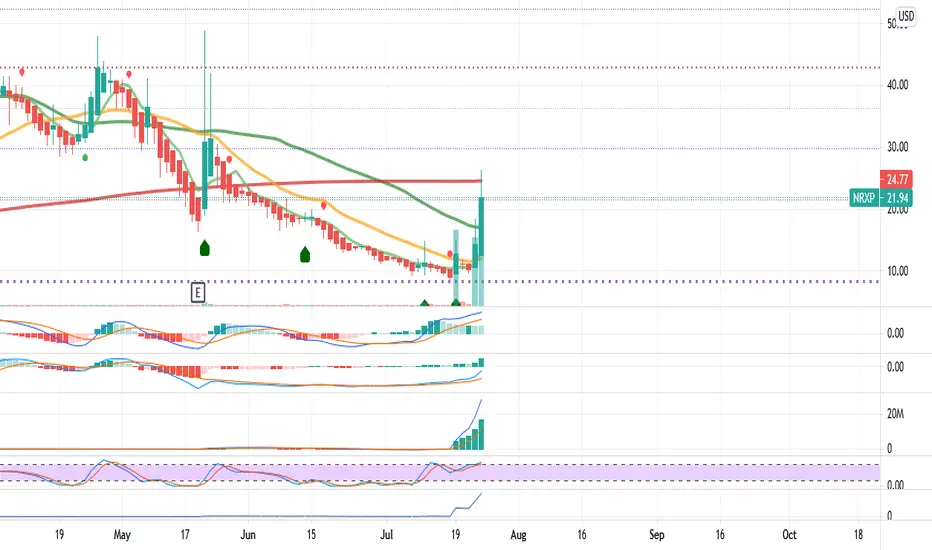
Do you have Diamond Hands? Check out NXRP's Volatile Reversal...NRXP is in for a wild & volatile ride where it may reverse & double in value or even more. Technicals support a reversal over weeks with a current strong trend on the daily.
Fundamentals are strong; F-Score is 9 & they just had some major news catalysts including a COVID-19 Treatment drug.
High risk with potentially high reward: up to a 25% drawdown and a potential 100+% gain leading to a 4:1 risk to reward ratio. With a ~30% short interest this could be a wild ride like GME or AMC.
Risk management by day trading may be possible.
Under-reported: momentum crash of 2021Pretty amazing nobody is talking about the #momentum crash that erased 3 year gains of this strategy. I guess the lesson here is as much as we like to chase things on the way up, never underestimate the power of value and reversion to the mean! $PDP $MTUM

Best Deep-Value Large-cap Growth play - Alibaba (BABA)Macro Reasons
-China has a population of 1.3billion VS US's 0.33 Billion, about 4x more
-Rising Chinese middle class with a growing disposable income
-It is estimated that China's GDP is set to overtake the US in 5-8 years
Fundamentals Reasons
-With 56% of the e-commerce market share in China and a growing e-commerce pie, Alibaba is poised for greater growth in 5-10years
-Supported by Cainiao logistics to enable efficient e-commerce delivery and Alipay to complete its transactions/funding for their merchants, it forms Alibaba's iron triangle to capture a large market share in the e-commerce related space.
-Dominant Cloud player at 40% market share, this segment just turned profitable recently and will contribute to its growth strongly like Amazon's AWS (30% margins)
Valuation
FCF: 26Bil USD per year i.e 9.6 USD per share (2.711 Billion shares outstanding)
20X multiple(Bottom valuation) : 192 USD per share
25X multiple(Bottom valuation) : 240 USD per share
Net Cash of 20 USD per share (462bil RMB Cash - 115bil RMB Debt = 347 RMB Net Cash = 54bil USD net Cash )
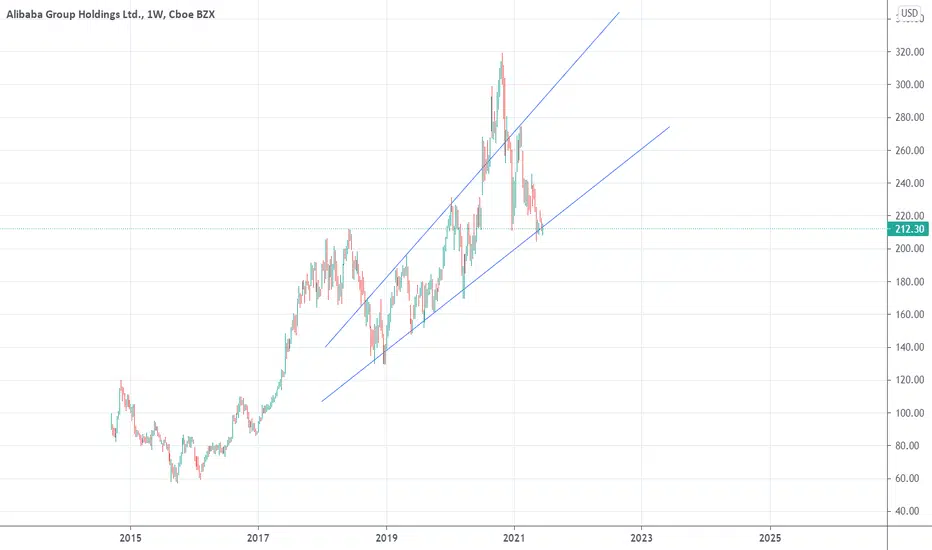
Fair Value at current conditions = 212 USD per share (20X FCF) - 260 USD per share (25X FCF)
FCF 10 years later: 9.6 USD *4.04 (15% CAGR for 10 yrs) = 38.78 USD per share
20X multiple (10% discount rate - 5% perp growth): 775 USD per share +20USD net cash =795 USD per share
795/215 (Current share price 14th June 2021) = 3.70X in 10 years* i.e 14% CAGR
*Very conservative estimate of 15% CAGR FCF & terminal multiple of 20X, also assuming all FCF are re-invested in other biz and not distributed via dividends/ buybacks
Technicals
Seems like it is at its bottom after a 30% slump in its share price, touching a very strong upward sloping support line indicating the bottom is near. Incidentally, it corresponds with the bottom valuation of 212 USD per share (20X FCF + net cash).
Addressing Risks
Risks of VIE structure & CCP risk are unfounded, one can easily exchange its ADR for the equivalent HK shares at the ratio of 1ADR:8 HK shares and Alibaba is too big to fail for the CCP. The recent USD2.8 Billion fine on BABA is only 4% of revenue and not as dramatic as the 30% slump in BABA's recent valuation (from $310 to $211 per share). Also, the CCP has recently approved Ant Group’s new license to operate Chongqing Ant Consumer Finance, in which it has a 50 per cent stake. This indicates that the CCP doesn't want to tear down Alibaba but rather work towards a more successful China together.
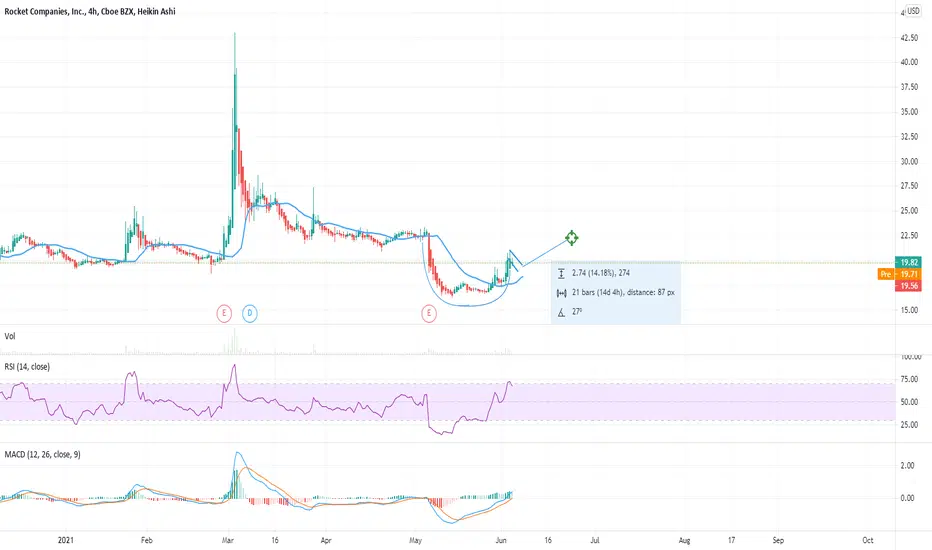
Cup & Handle Pattern Forming For RKT Cup and handles typically take 1-4 weeks to play out. 14% of the float is shorted but RKT has less than 1 days to cover. Making RKT a pretty weak short squeeze opportunity IMO . But I do like the value for RKT and the chart set up, I worry about what a rising rates environment would do to their business (higher irates less people looking for homes)
Oh RATS!! 🐀Well mice actually... 🐁
There is mouse plague going on in parts of Australia right now, and I suspect we may find the Australian Government turning to pest control companies to help get things under control. Fundamental news like this can drive prices abruptly on announcements of partnerships, larger orders, etc. I went long today on the company, SNES.
I made my decision of the Weekly chart.
What I'm seeing that I like.
Location, it is at the very bottom of its range.
There is evidence it has found a bottom by strong support over months, almost a year.
Price just accepted back in to value in the VP, and I wouldn't be surprised if we see a return to $2.50 if not higher (contrarily, the bottom could fall out and it goes to 0).
There are converging moving averages.
OBV looks great!
Huge spike of green buy volume within the last two months.
MACD is positive, and there is a bullish divergence.
It appears to be coming out of oversold.
I entered at $1.68, and because it is just a nibble (pun intended), I'm risking my position to 0. I will self half my position if and when it doubles at $3.36, and let the rest run.
Fundamentally:
Low outstanding shares 12.16M
No debt
Some Insider Own
355.22% Institutional Trans
finviz.com
You can read more about the company on their home page here:
senestech.com
NASDAQ:SNES
