RKT Value TradeRKT trading in a sideways trend.
Fundamentally strong company.
Low risk high reward entry with possibility for all time bottom
Valueinvesting

Cloud-computing vs crude oil: Lessons in a Dramatic ChartOne of the biggest events in the history of the Dow Jones Industrial Average happened last August when Salesforce.com replaced Exxon Mobil as an index member. A 21-year software company elbowed out a transnational giant tracing its origins to John D. Rockefeller and the dawn of modern capitalism.
Despite the stunning endorsement, things haven’t worked out so well for CRM since then. Its shares peaked above $280 one week later and then turned lower. (That was a giddy moment for growth stocks because Apple and Tesla had just split their shares.)
Additionally, TradeStation analytics show that CRM has gone 172 sessions without a new 52-week high. That’s the longest for any member of the Dow Jones Industrial Average. XOM, in contrast, hit a new high yesterday.
It’s a good lesson in froth and exuberance: Just when it seems things can never go wrong, it’s often a sign of the top. Other adages that could apply are "buy the rumor, sell the news," or "be fearful when others are greedy."
The chart above compares CRM to XOM since they traded places in the Dow. Notice how XOM lagged for a couple more months but then ripped higher after November 9’s vaccine news ignited the reopening trade.
Switching to CRM's candlestick chart below, some challenging patterns may have emerged. The 50-day simple moving average (SMA) slid beneath the 200-day SMA on March 22, resulting in a “death cross.” Next is the descending channel in place since the peak in early September. If that trend continues, it could imply move toward $180.
TradeStation is a pioneer in the trading industry, providing access to stocks, options, futures and cryptocurrencies. See our Overview for more.

Halliburton Squeezes Toward a Breakout as Oil RalliesEnergy is coming to life again as the economy reopens. Let’s take a look at oil-field service provider Halliburton, which has a few interesting chart patterns.
First is the downward-sloping trendline running along the highs of March and April. HAL closed above that resistance yesterday for the first time.
Second notice the tight range on the weekly chart, with a bullish inside candle last week, which it’s now escaping.
Next, HAL’s MACD crossed to positive yesterday.
Finally, consider how the stock has completed an ABC correction since March.
TradeStation is a pioneer in the trading industry, providing access to stocks, options, futures and cryptocurrencies. See our Overview for more.

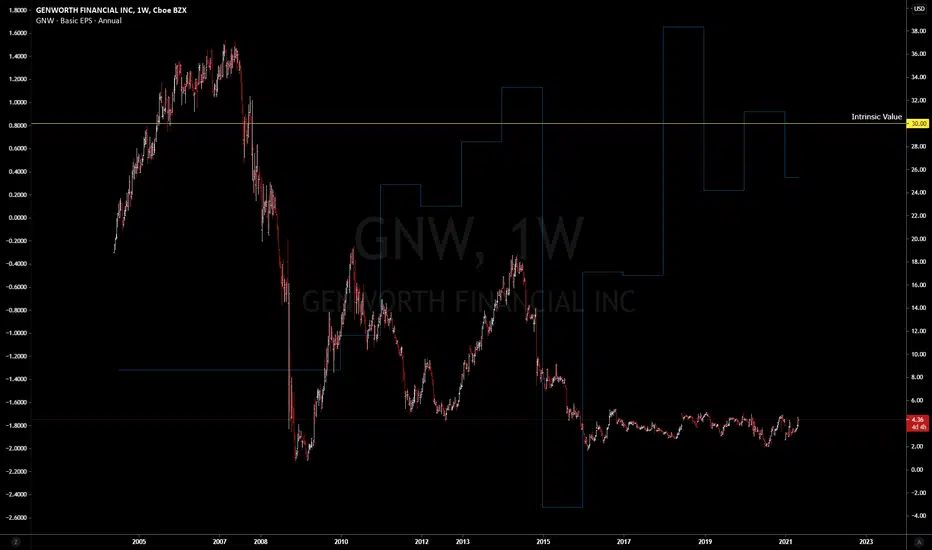
Potential for over +700% return ?! $GNW (Genworth Financial) is a stock that I purchased recently at $3.51 per share
Company has formed a flat base in the stock price in recent years but i feel its massively undervalued
The book value per share is up at $30 and we have the following data:
Free cash flow = 1.96 billion
Total cash = 3.31 billion
Total debt = 3.64 billion
So debts are perfectly manageable with the cash they have and the nice positive cash flow coming in on top of that. the net asset value of the business is nearly 10x higher so this company looks massively undervalued to me. If we are able to reach the $30 per share target that would be a return of over 700%
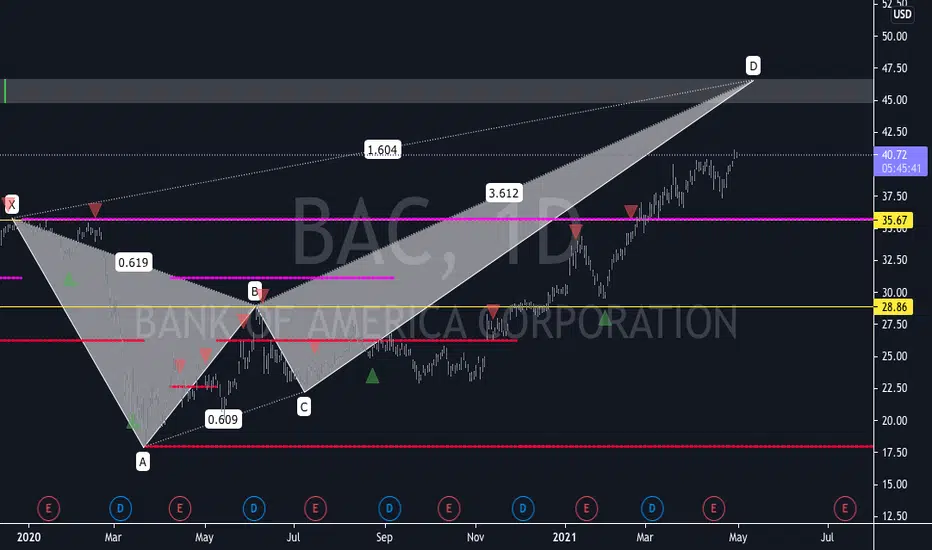
Bank of America BAC Bearish CrabBank of America (BAC)... this company is found in Warren Buffet's Portfolio and once it becomes a bargin price it will be found in mine too. I follow the advice layed out by The Oracle of Omaha. The company financials are very weak from a value investors point of view. The total revenue has been flat line at best for the past decade and when your operating income eats up 74% of your total revenue thats a problem. I always try to remember the law of depreciating return which is "you get back less than you put in." Warren Buffet always says "its easier to take 100,000 to a million than to take a billion to 100 billion. I mean the company is absoultly massive with 2 Trillion dollars in assets?!?! So, I guess the Value invstor needs to look at other things when considering Bank of America. I dont forget that major banks created these mortgage bonds back in 2008 that imploded when the real estate market crashed, so i have to dig deeper into where the assets are coming from. However their EPS has been growing at a decent rate over the past decade so thats also a plus. Their total ratio (becasue they do not report current assets and curret liabilities) is a 1.14 which if using a a current ratio thats real good (not exceptional but better than just plain "good") They are currently undervalued by the Ben Graham Formula (revised) by 61%. Which is a real good thing as well. They pay an annual dividend of 1.75%, but i am not sure if theyre an S&P aristocrat or not. Overall, based on what i have read based on Marry Buffets books and listening to videos of Warren Buffet himself i would grade BAC ( Bank of America Corp.) a C+ company which I would hold only for a few years up to 5 years max. Dont get me wrong the company is NOT going anywhere, so if youre looking to hold just to hold to sound trendy and chic amongst your friends then sure, but it is not going to be your star player, but more like your practice squad ...just a great supplemental.
the technical side is the Bearish Crab. the grey box is the PRZ with a 3.618 projection of the BC leg, a 1.618 of the XA leg and 2.0 fibo extension of the ABC legs. if youre looking for a decent bargain then wait for Price to reach the pink line which is .382 of the whole pattern and if youre looking for a great bragain then wait for the .618 of the entire pattern. Seeing how the market is flowing at the moment i would probably buy at the .382 of the retrace anything lower than that there might be mass hysteria of a market "crash" which is honestly a very much needed correction for the stock market. But a good deal is better than no deal. I dont publish often my investing ideas as my investing is vastly different than my speculation ideas.
If you guys want to know more about my investing ideas please let me know in the comments. I know value investing is not as flashy as speculating, but the longevity of investors is far greater than that of any speculator; moreover, it is of dire importance to know the difference of speculation and investing.
JPMorgan Chase Could Be Coming to LifeJPMorgan Chase has snoozed since its big November-February rally. But now it may be getting ready to move again.
The first pattern on the chart is the downward trendline running along the highs of March 18 and April 12. It’s breaking that resistance today.
Next are the series of candlesticks last week. Notice how prices tried to close at the low but each day snapped back to close at the high. This suggests buyers outnumber sellers. The fact it happened at the 50-day simple moving average (SMA) is potentially bullish.
Third, price action has been very dull for the last month. Just look at how Bollinger Band Width is holding the bottom of its longer-term range around 5 percent. That kind of consolidation above the December 2019 peaks could be turning into a high basing pattern with price acceptance in new record territory.
Finally, intermarket trends may favor JPM. Bond yields have consolidated as the economy recovers. Both situations favor banks and financials. Key ETFs tracking the sector like KBE and XLF are also trending higher. Once we get past Big Tech earnings, focus could return to value stocks like the banks.
TradeStation is a pioneer in the trading industry, providing access to stocks, options, futures and cryptocurrencies. See our Overview for more.

ET, Energy Transfer, Tickets PleaseET, monthly, energy value play: The current monthly bullish engulfing candle patter within the right ellipses appears to repeat an identical, bottom reversal candlestick pattern from 2009 (yellow+orange). Strengthened by the local Adam Eve double bottom , bullish divergence makes case for Fibs targets & the measured move validates 1.272 overhead extension. Get paid along the way. Remember this is the monthly, so the idea here is a slow and low setup with easy risk management and excellent profit exposure.

NLG/USD Awakens from Bearish Hibernation; Last stop: ValhallaThis project is one of the best kept secrets in the entire crypto space. While people chase after DOGE which has over 120B coins and very little development and only rises because of the Musk Effect, Gulden's current supply is ~0.475% of DOGE's...which makes the NLG supply *closer to BTC's supply than DOGE's supply is to Gulden's* ...yet DOGE is 4x the price of Gulden?! Think about that for a while.
In terms of "Value Investing", one might say that NLG's eventual and much-deserved appreciation will make DOGE's rise look modest by comparison, especially when you take into account NLG vs. DOGE current price per exchange volume in relation to aggregated available supply. There are folks selling dozens of millions of DOGE at 5 cent, meanwhile there are less than 5 Million NLG *that are even available to be bought from the order books*--That's how scarce NLG is since a significant percentage of the supply is locked into the Witnessing protocol that rewards holders which makes NLG objectively one of the safest, longest standing and efficient blockchains available. It just needs more promotional traction from popular influencers and a handful of fat cats to start entering the fray... and the price discovery that could occur for Gulden would (once again) bring the spotlight onto the vibrant fintech environment in which it can begin to flourish as a store of value and resume its status as one of the top merchant-centric and user-friendly cryptos available.
Green lines signify structural avenues within the incoming bull market.
Short term: look for consolidation in the 0.012-0.015 range to solidify and a break toward the recent local high of just over 2 cents.
Medium term: If it violates the 0.0225-0.025 zone and breaks noticeably back above this nearly 3 year price resistance at this level, look for another doubling effect up to 4-5ish cent range and around here another raucous consolidation hangout between the former resistance of 0.025 and 5 cent is likely. If we start flooding past 5 cents, then another doubling effect will likely occur.
Long term: 10-15 cents then becomes the next logical trading range for NLG to re-establish (since it traded in this zone for over a year between late 2016-early 2018 in the prior bull market in its early development phases, now it's way more seasoned).
Longer term: NLG Will eventually challenge prior ATH again (30x from here) and could even breeze past it the more capital inflows amplify and stay within the crypto sector, which appears likelier by the week at this point.

Another Healthy Pullback in Energy ETF?Energy is the strongest sector this year, but is down in the last month. Is it time to buy the pullback?
This chart of the SPDR Energy ETF has some interesting patterns. First are the candlesticks from March 23 and 25: an inverted hammer and then a normal hammer. Both of these are bottoming patterns, which were confirmed when prices bounced in following sessions.
Next, notice XLE’s tight range as it holds $49. That level is also interesting because it was the weekly low immediately after another bounce in early March.
Third, consider the peak around $54 last month. That matched the close on February 21, 2020, immediately before the coronavirus crash. It’s not a surprise that level would offer resistance after XLE doubled from the lows.
But now the sector could make another stab at a breakout – especially as travel resumes in coming months. Cruise and airline restrictions have already been eased. Memorial Day’s on May 31. Just two weeks after that, California reopens fully.
TradeStation is a pioneer in the trading industry, providing access to stocks, options, futures and cryptocurrencies. See our Overview for more.

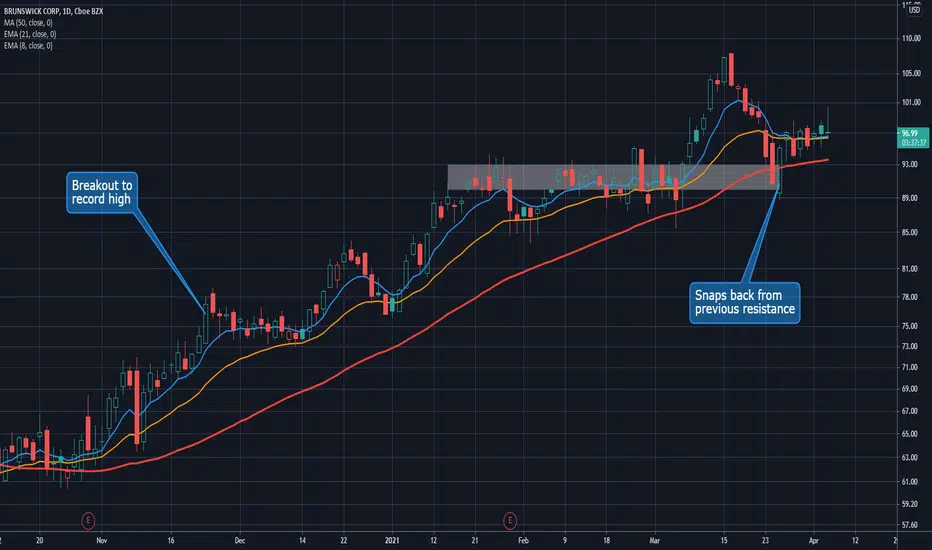
Is Brunswick Ready to Speed Higher?Speedboat maker Brunswick may not get a ton of attention. But it’s exactly the kind of leisure stock that’s zipped higher lately.
First, notice how the stock fought to get above the $90-93 area earlier this year. It broke that zone in early March, briefly probed above $100 and then pulled back.
Buyers defended the old resistance and turned it into new support in the last two weeks. The 50-day simple moving average (SMA) has also risen from below to provide support.
Third, notice now prices have more recently hugged the 8-day and 21-day exponential moving averages (EMAs) – only to close above both yesterday.
BC is also interesting fundamentally. Not only did earnings and revenue beat estimates last quarter. Demand was so strong that management announced factory expansions at three of its facilities in late January.
Given the strong backdrop, this may be the kind of smaller company that can appeal on many fronts. It has the cyclical and consumer angles. It has strong market share. It may even have takeover potential.
Earnings are due in late April. Is this BC's last pullback below triple digits?
TradeStation is a pioneer in the trading industry, providing access to stocks, options, futures and cryptocurrencies. See our Overview for more.
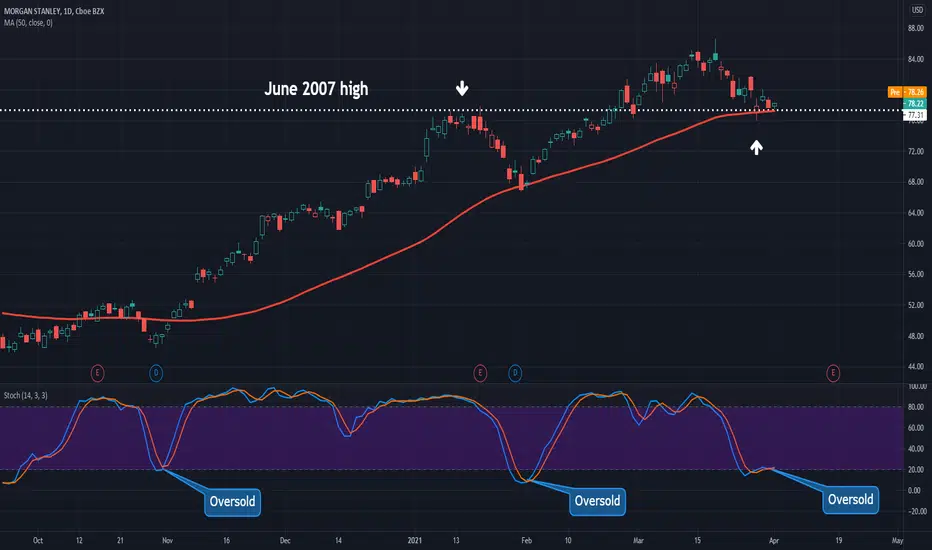
Morgan Stanley Holds Key LevelFinancials are the second-best performing sector in 2021. Now one of the biggest names has pulled back to hold some key levels: Morgan Stanley.
MS dipped on the Archegos implosion last week, but reportedly faces no significant losses.
That brought MS down to its 50-day simple moving average (SMA). It tested below that line on March 29 but has managed to close above it each day.
Second, the current level around $77 is important because it was not only a high in mid-January. It was also the investment bank’s former peak from June 2007 -- before the subprime meltdown.
Third, stochastics are oversold. The last time this happened in late January was followed by a breakout to new highs. It also anticipated the move in late October.
Finally, MS is the type of cyclical value stock that investors have recently favored as the economy recovers. Given last week’s strong non-farm payrolls and ISM manufacturing reports, there’s no reason to think that trend is finished yet.
TradeStation is a pioneer in the trading industry, providing access to stocks, options, futures and cryptocurrencies. See our Overview for more.
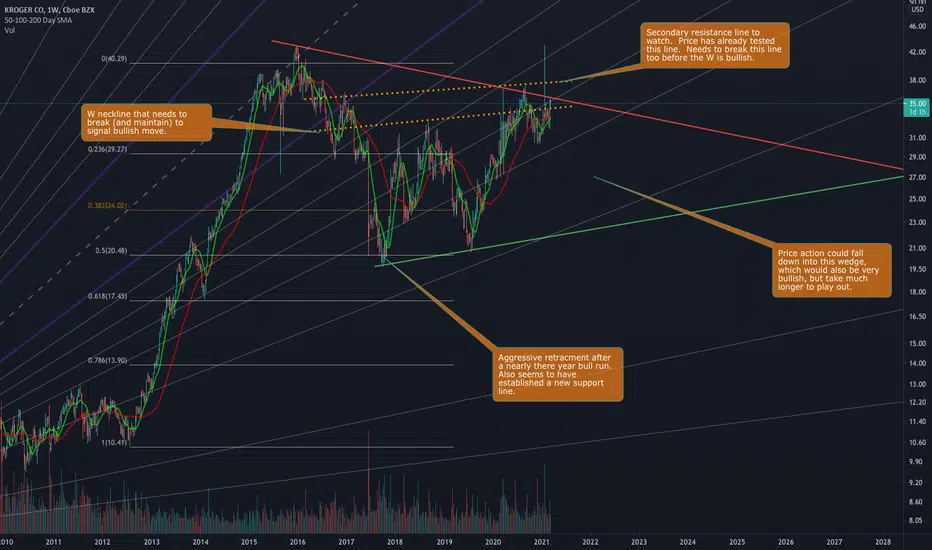
Kroger - W's Are a Happy Place
I've been looking more at value stocks (high cash flow & strong dividends)... and Kroger caught my eye.
LOOK AT THAT W!! Granted we are looking at 1 week candles over YEARS... but... I'd look at this as a buying into a long term play at the right time.
August 2012 started a massive 3.5 year bull run
Start of 2016 we see the beginning of a major retracement down to the Fib .5 line and a long term W begins to form.
August 2020 price hits and breaks the neck line but is rejected at newly established resistance line
NOW - price broke the neckline again and is on it's way to testing the other resistance line
If that second resistance line is broken, we could see the start of another strong multi year run from Kroger. If we're rejected again we could fall into a bullish pennant, which is still a strong buy, but a much longer play. If the price fell back into the pennant, you could expect price to fall back to the lower resistance line established by the bottom of the W... a strong buy opportunity if you see this as a bullish long term play.
Bullish Triangles Across Reopening StocksFrom Las Vegas Sands to Live Nation Entertainment and many other stocks, bullish triangles keep popping up in "reopening" plays.
Notice how LVS clawed to a new 52-week high above $66 in early March, stalled and then pulled back to previous highs around $60. Also notice how it briefly tested under that level, along with its 50-day simple moving average (SMA), before quickly rebounding.
That price action now resembles an ascending triangle, with a series of higher lows and resistance around $61.25. This has the potential for upside continuation.
Similar activity appears LYV. The concert operator has also formed a set of higher lows while holding its 50-day SMA:
Hoteliers Hilton Worldwide and Marriott International have danced the same jig without even touching their 50-day SMAs:
Ditto for Norwegian Cruise Line , Royal Caribbean , MGM Resorts and Caesars Entertainment :
An ascending triangle also appeared in auto-parts supplier BorgWarner . It’s not exactly a reopening stock but it is the kind of cyclical value name that investors seem to like these days.
Overall these aren’t very glamorous stocks, but they are all showing similarly bullish patterns one quarter into the new year. Will they be the leaders in Q2?
TradeStation is a pioneer in the trading industry, providing access to stocks, options, futures and cryptocurrencies. See our Overview for more.

Another Healthy Pullback in General MotorsGeneral Motors continues to push higher as investors embrace value stocks and the cyclical recovery. Once again the chart is giving some potential signals.
First, the auto maker pulled back to hold the trendline in place since the start of the year. It’s also bouncing near its 50-day simple moving average (SMA).
Second, notice the large bullish candle on Thursday, March 25. Price came within $0.12 of the 50-day SMA but couldn’t reach that level. GM has remained above that candle since – a potential sign of buyers lurking not far below the surface.
Next, GM’s 8-day exponential moving average (EMA) has remained above the 21-day EMA. That’s a sign short-term trend is still bullish.
Finally, notice that the current bounce is occurring near the $57 area where GM topped in January and February. Is old resistance becoming new support?
TradeStation is a pioneer in the trading industry, providing access to stocks, options, futures and cryptocurrencies. See our Overview for more.

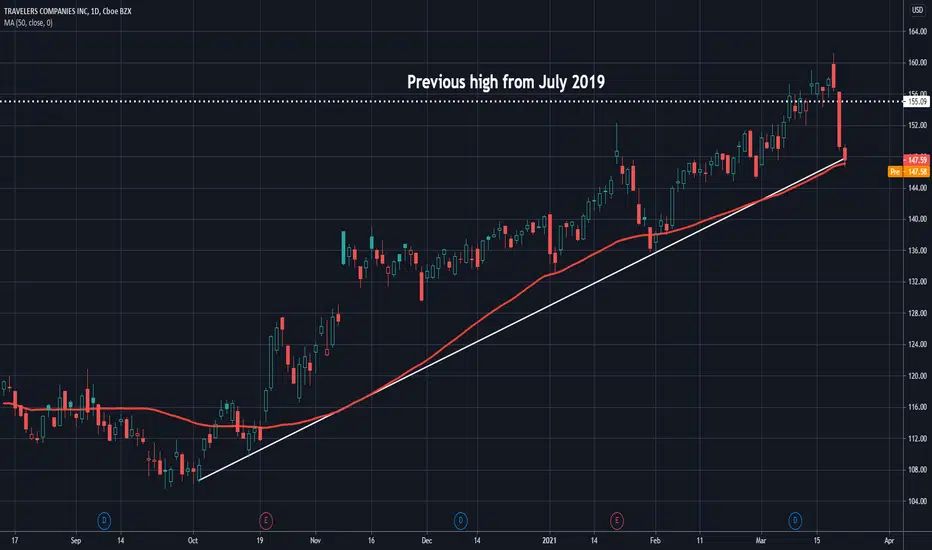
Is Travelers Going Places?Travelers doesn’t get much attention, but maybe it should.
The insurance stock trended steadily upward since October. It made a new all-time high above $160 last week when Chubb bid for Hartford. TRV quickly pulled back, creating a potential opportunity for buyers.
Notice the trend line running along the lows of late October and early February. Price held that support yesterday. The 50-day simple moving average (SMA) is almost in exactly the same place.
Next, consider the recent relative strength in the Dow Jones Industrial Average. It’s up nearly 4 percent in the last month, quadruple the gain of the S&P 500. TRV is the smallest member of the Dow, weighing in a just $37 billion. (That’s less than two-thirds of the Nasdaq-100.)
Its parent bucket, financials, is also the second-best performing sector this year. (Energy is No. 1.)
Finally, TRV falls under the “value” umbrella thanks to its trailing P/E ratio of just 14x.
TradeStation is a pioneer in the trading industry, providing access to stocks, options, futures and cryptocurrencies. See our Overview for more.
Ag Boom: People Gotta EatLooks like bottom of longer term channel, with trend just beginning to reverse. Good entry point for a long play in my opinion. Short term channel confirmed, watch the red meridians for price breakouts, but price should stay bounded within the narrow channel for the foreseeable future.

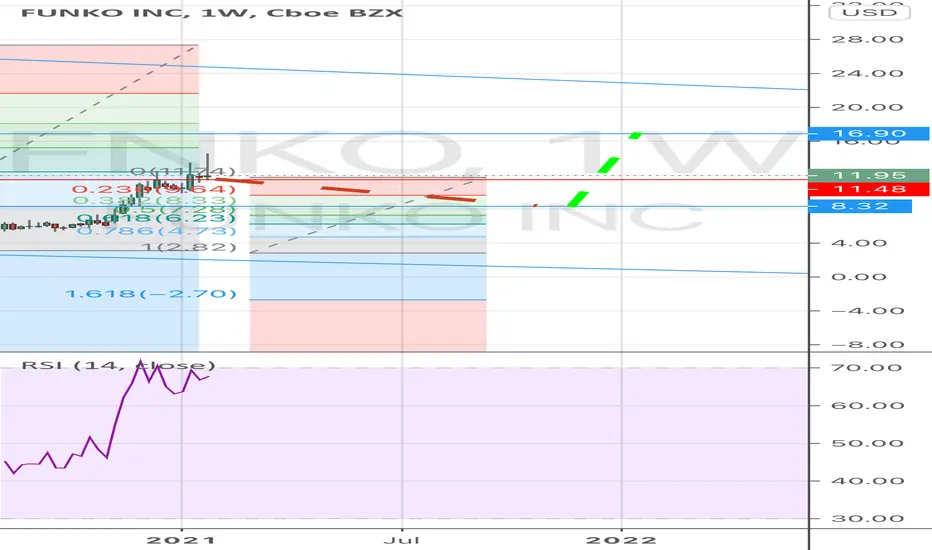
Correction to $8 before a run up to $16 following ERAttractive entry at $8 with a PT of $16. Lines up with $FNKO estimated fair value. Expect this to play out over the next 12-18 months as FNKO’s e-commerce / direct to consumer platform continues to mature + new.
I expect further value around 2022-2024 with the Marvels Phase 2.0 coupled with the (hopefully) return to steady blockbuster releases + PS5 games.
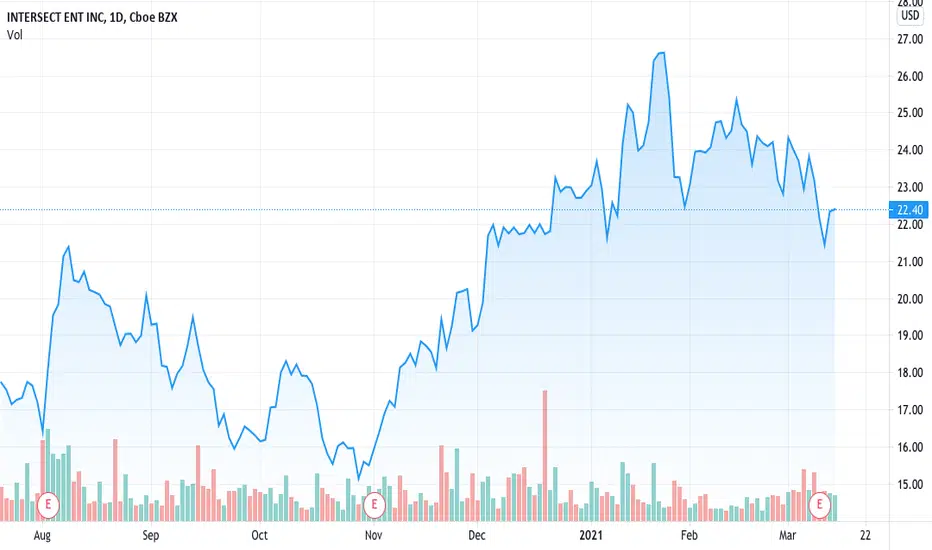
200% XENTAfter conducting the research, I invested in and made over 200% on (XTLB) & (EYES), short % of float has been reduced to less than 1% of outstanding shares short currently.
Now investing in (XENT), has a short % of float of 6x larger (6.25%), total of 1,050,000 shares short, so may see an even lager gain.
Ears, Nose, Throat Devices Market to reach $26BB, with cumulative impact of COVID-19 SARS CoV2 variants, bio-absorbable therapies such as Propel & Sinuva fastest growing segment.
(See market report below)
(XENT) capturing 5% of market realize $1.3BB in revenues/ 32MM Shares = 40$ per share in Revenue, at comp. 10X Sales= $200 per share
(XENT) Intersect ENT Inc.
- Positive 10 day & 50 day Moving Average
- Current Assets to Liabilities ratio attractive
- Enterprise Value is undervalued compared to peer group
- 5 Day Rounding Bottom chart + (Cup & Handle)
- Moving Average Convergence Divergence crossing higher.
Christopher Michael Lim, MSc. Health Sciences
Western University Medical
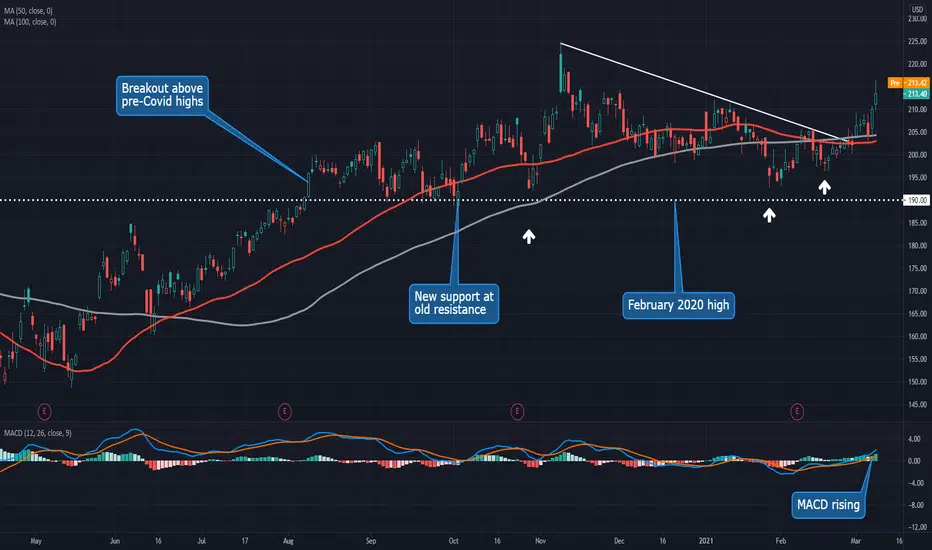
Toolmakers Have High Basing PatternsAttention is shifting toward industrials as technology and the Nasdaq struggle. Two companies in the space have potentially bullish patterns: Illinois Tool Works and Stanley Black & Decker .
ITW is the larger company with a market cap of about $68 billion. It broke out to new all-time highs in August and consolidated for the next seven months. Now the bulls may be ready to return.
First notice the high basing pattern above old resistance. It first held $190 on October 2, turning the pre-Covid peak into a new bottom. It made a slightly higher low four weeks later. ITW revisited this zone in late January, once again making a slightly higher low.
Meanwhile, a downward-sloping trend line took shape – only to be broken at the beginning of March.
Also notice how the 50- and 100-day simple moving averages flattened out and squeezed on either side of the price.
SWK shows similar patterns. It made new highs above $176 in October and spent about six months chopping on either side of that level. Like ITW, it had a descending trend line breakout and a tight squeeze between the 50- and 100-day SMAs.
The fundamental stories for these companies also appear favorable, given the improving economy and prospect of increased infrastructure spending. SWK may appeal to value investors, trading for less than 20 times forward earnings.
TradeStation is a pioneer in the trading industry, providing access to stocks, options, futures and cryptocurrencies. See our Overview for more.
HDFC LIFE - Trading Ideas - 1 month and 2 year targetsFollow me and like trading ideas for more detailed analysis.
HDFC Life recently showed us major breakout, and now we can see a sharp rise in large investor dealings followed by favourable Elliott and Gann fan trends.
According to our detailed analysis here are some trading ideas and targets to keep in mind for HDFC Life:-
Long - (Minimum target for 15th March 2022 - Next Major Top
For a short period, I am giving target for Rs. 750to Rs. 780 (Can happen with this month or Jan 2021)
This stock has strong fundamentals and good for value investing

Stunner: Oracle Breaks Out as Peers LanguishSoftware companies have lagged this year as investors focus on cyclicals like energy and financials. But one unexpected name is breaking out: Oracle.
As covered previously, strong earnings lifted ORCL to new highs in December. It then pulled back to old resistance and bounced. This week, its shares are closing above their previous all-time highs.
Two technical patterns stand out today.
First, notice how ORCL broke above $64 on February 22. The stock barely pulled back in subsequent sessions, even as the broader S&P 500 dove to a three-week low.
Second is ORCL’s relative strength compared to the broader technology sector.
Both of these trends are signs of accumulation. One positive catalyst is ORCL’s improving momentum in cloud-computing, which prompted analysts to raise price targets after last quarter. Now buyers are re-engaging with another set of numbers about two weeks away.
The company’s lower valuations may also provide some shelter against higher interest rates. ORCL trades for just 14 times forward earnings and 5 times revenue. Other big names like Salesforce.com and Adobe (which have gone half a year without hitting new highs) trade for at least 3 times more.
TradeStation is a pioneer in the trading industry, providing access to stocks, options, futures and cryptocurrencies. See our Overview for more.

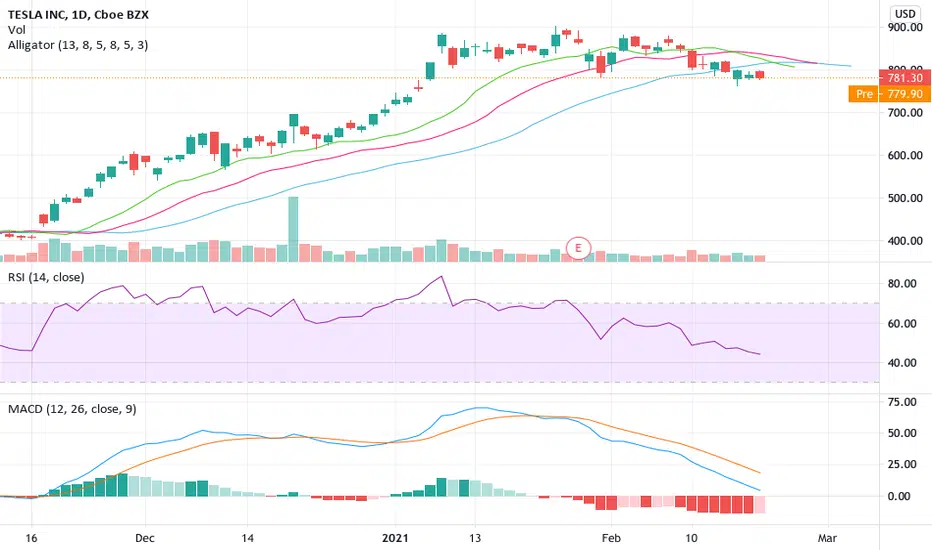
Tesla buy or sell? Bubble?Reasons to buy Tsla
Although electric cars occupy a small portion of the global automobile market, Tesla has acquired a large market share within this niche segment. Tesla has a little less then 1% marketshare worldwide which is impressive for a young car company like Tesla. Especially in the electric segment where it has 16% marketshare in 2019. The company has a strong performance adn the unique design helps the sales. For example the preorder of the Tesla Truck. Also the solar and storage deployments will probably witness significant growth aided by the positive reception of the Megapack and Powerwall products.
The delivery of Model 3 has risen significantly, which counts for a big part of the companies overall deliveries since it the best selling car of Tesla so far. Besides Model 3, Model Y is also improving Tesla’s prospects. The construction progress for Gigafactory 4 in Berlin and Gigafactory 5 in Austin are also underway, with production from both plants expected to start this year.
With China being the biggest EV market, Tesla’s ambitious production plans in the country bode well. Robust production of Model 3 from the new Gigafactory in Shanghai bode well for its future growth. The Shanghai factory is ramping up well and commands a higher market share in the Chinese EV market.
Over a multi-year horizon, Tesla anticipates achieving 50% average annual growth in vehicle deliveries. Meanwhile, low leverage of Tesla offers financial flexibility. Notably, its long-term debt-to-capital ratio stands at 0.31, lower than its industry's 0.54.
Historically, from 2016 to 2020 sales of TSLA increased in average of 45% from one year to another, with an estimate of 49% sales growth for 2021 and 33% for 2022.
The liquidity and Solvency of Tesla are both scoring good which means Tesla is able to pay of short term as long term obligations.
Reasons to sell Tesla inc
The company’s high R&D and SG&A costs do raise concerns. During the last reported quarter, R&D and SG&A costs were up both yearly and sequentially. Capex soared 138% year over year and is likely to increase this year as well, thereby affecting cash flow and margins.
Tesla's excessive reliance on credit sales remain a concern. In 2020, Tesla posted a net GAAP income of $721 million. Without the regulatory credit sales, the firm would have incurred a loss to the tune of $859 million.
Stretched valuation of Tesla is a concern. Going by the EV/EBITDA multiple, which is often used to value auto stocks, Tesla is currently trading at a trailing 12-month EV/EBITDA multiple of 187.9, considerably higher than the industry average of 52.41. The firm’s P/S ratio of 17.3 also compares unfavorably to the industry’s 3.05.
Tesla bubble?
Based on the future outlook of the industry and the company and considering all the discussion around TSLA bubble, it can be assessed which will be the fair value for the company at the moment. For this, the EPS reported for last quarter was taken and annualised which gives us 0,96$ per share. Based on recent developement and estimation, it is forecasted that Tesla will have an annual growth in earnings of 40% each year, first 5 years and 10% from year 6 to year 15.
For safety reason 15 years is the number of years we will calculate with as there is a reasonable time to recover an investment. The forecasted EPS after 15 years based on this growth is around 12,17$ per share. Multiplying these with a decent P/E ratio of 35, the fair price would be currently below 500$, while the real price is just under 800$.
Buy or not?
Although it is clear that the company is the market leader and may outperform without problem any other company from the industry for the never ending future, however, following value investing principles, the current price is out of real position and may lead to the fact that the stock is overvalued.
Thus, the stock may face a corrective action in the near future. However, it is a bit funny to observe that even in a period of instability and uncertainty and in this Covid-19 situation, where people use the cars a lot less, Tesla kept it's position, and even increased its position, without recording great losses.
This could mean that value trading as we know, may not be applicable anymore and the investors should adjust and adapt trading principles and behaviours accordingly.
If you are a value investor, like I am, then Tesla is not the right choice to invest in.
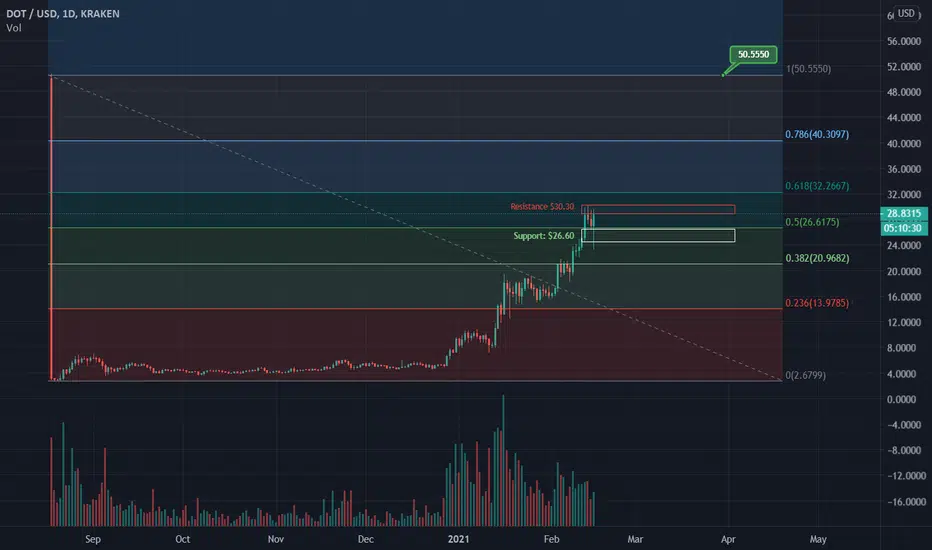
Polkadot (DOT) Still a Sleeping Giant Under $30 Polkadot is the biggest decentralized finance (DeFi) blue-chip cryptocurrency and will be taking the cryptocurrency world by storm this year. There will be an extensive amount of projects being built on top of the Polkadot network this year as Polkadot will be the incubator for the future of DeFi. Especailly when Initial Dot Offerings (IDOs) start gaining traction.
Polkadot is less than a year old with only a 25 Billion market cap. We're still in the early stages of this bull market and there will be an enormous amount of growth that will take place in Polkadot and in DeFi. This bull market will be about Bitcoin, Ethereum, DeFi, and NFTs. Rest assured that Polkadot will be leading the DeFi world in the months and years to come. The fundamentals are very sound bullish for Polkadot there's a reason why it's a top 10 cryptocurrency.
It looks like Polkadot gearing up to retest it's all time highs from the initial offering dump. Polkadot will run past $30. I expect for us to easily climb to our Fibbonacci level of 0.618 putting us at $32.20 as we work our way up to retesting a $50 dollar Polkadot in the coming weeks or months. I'm adding to my portfolio.
As always much love and peace!