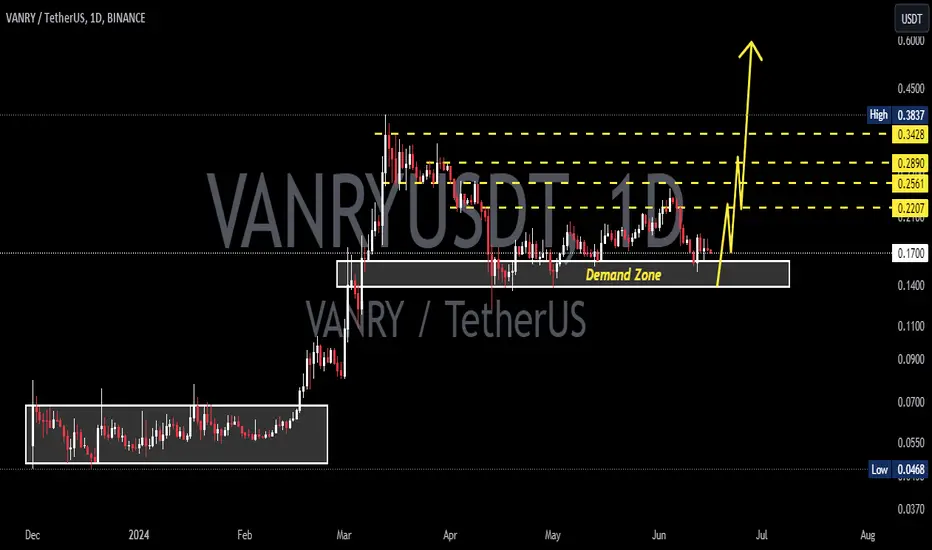
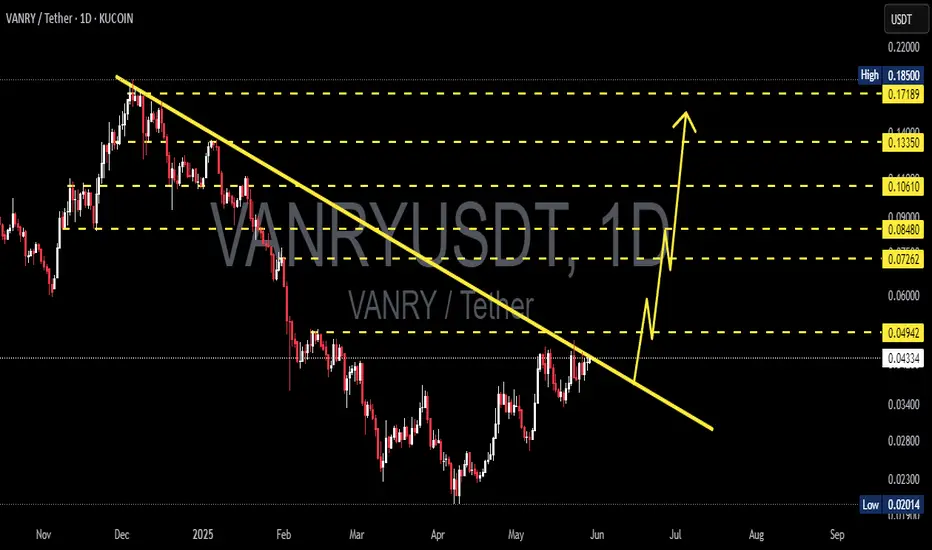
VANRY/USDT – Symmetrical Triangle, Major Breakout Approaching!🔎 Chart Overview
VANRY/USDT is currently in a consolidation phase after a prolonged downtrend since early 2025. Key observations:
Price is stuck inside the demand zone 0.028 – 0.036 USDT (yellow box), which has acted as strong support for months.
A symmetrical triangle pattern is forming, indicating accumulation before a decisive move.
The descending trendline is still pressing the price down, but the apex is approaching → a major breakout or breakdown is imminent.
---
🚀 Bullish Scenario
Trigger:
✅ Daily close above 0.036 USDT with strong volume → breakout from the triangle and descending trendline.
Potential targets:
🎯 First target: 0.040 – 0.04382 USDT (minor resistance + triangle height projection).
🎯 Next target: 0.04930 USDT (key resistance).
🎯 With strong momentum: extension toward 0.07305 USDT, and potentially 0.109 – 0.133 USDT in the mid-term.
Additional bullish confirmation:
Successful retest of 0.036 as new support after breakout.
Increased buying volume confirming buyer dominance.
---
🐻 Bearish Scenario
Trigger:
❌ Daily close below 0.030 – 0.028 USDT → breakdown of the demand zone and triangle.
Potential targets:
🎯 First target: 0.026 USDT.
🎯 Next target: 0.024 USDT (triangle breakdown projection).
🎯 If selling pressure intensifies, price may revisit the historical low at 0.02014 USDT.
Additional bearish confirmation:
Breakdown supported by high volume.
Weak or no rebound after falling below 0.028.
---
📌 Conclusion
VANRY is at a critical stage. The symmetrical triangle within the demand zone signals price compression that will soon resolve.
A breakout above 0.036 USDT could spark a strong rally.
A breakdown below 0.028 USDT could open the way toward 0.02014 USDT.
👉 Key levels to watch: 0.036 (bullish breakout) and 0.028 (bearish breakdown) with daily close and volume confirmation.
#VANRY #VANRYUSDT #CryptoAnalysis #PriceAction #SymmetricalTriangle #Breakout #CryptoTrading #AltcoinAnalysis #TechnicalAnalysis
Vanrysignals
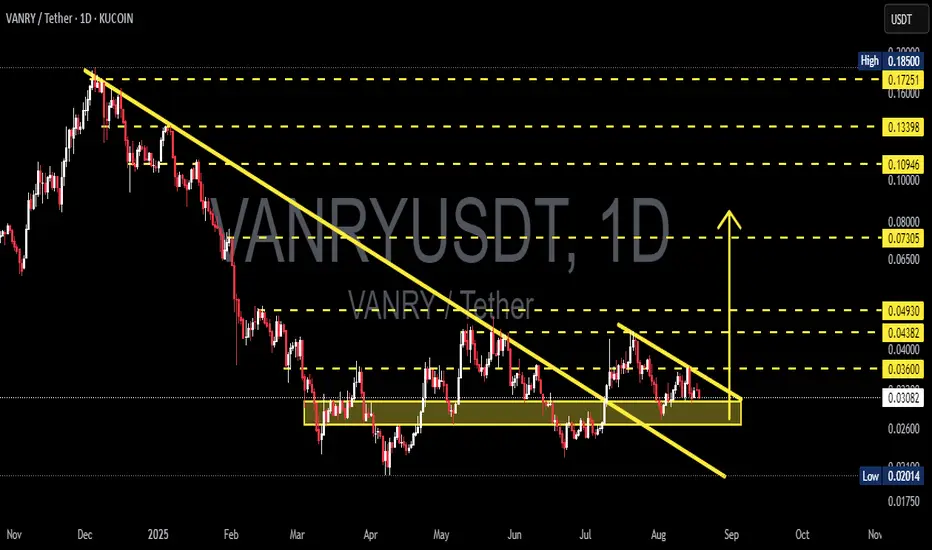
VANRY/USDT: Major Breakout from Downtrend – Is This the Start?
After months of downward pressure, VANRY/USDT has finally shown a strong technical breakout, potentially marking a shift in momentum and the beginning of a bullish phase.
📊 Technical Pattern & Market Structure
🔻 1. Descending Trendline Breakout
Price has successfully broken above a long-term descending trendline that has capped the market since November 2024. This breakout is a key signal of a potential trend reversal, suggesting the sellers are losing control.
🟨 2. Accumulation Zone Breakout
For over 3 months, the price consolidated within a clear accumulation zone between 0.02600 – 0.03300 USDT. The breakout from this zone indicates that accumulation may be complete, and price is now entering a markup phase.
🔁 3. Retest Confirmation
After the breakout, VANRY has successfully retested the previous resistance as new support (0.03300 – 0.03500), confirming the breakout as valid. This is often considered a textbook bullish setup.
✅ Bullish Scenario
As long as the price holds above the breakout zone, the bullish outlook remains intact. Key resistance levels to watch:
Target Price Level Notes
🎯 Target 1 0.04393 USDT Minor resistance
🎯 Target 2 0.04902 USDT Key psychological level
🎯 Target 3 0.07311 USDT Mid-term bullish target
🎯 Target 4 0.10610 – 0.13427 USDT Long-term rally potential
🚀 Final Target 0.17085 USDT Previous swing high
> As long as price sustains above 0.035, these targets remain highly achievable in the coming weeks.
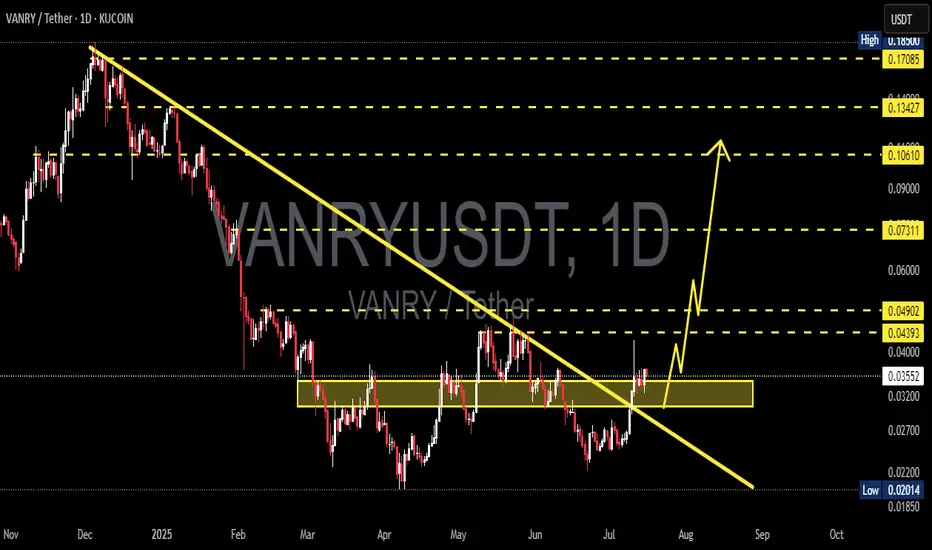
❌ Bearish Scenario
In case of a failed breakout or rejection from key resistances, the bearish case still exists:
🔻 Drop below 0.03200 could signal a failed breakout
📉 Downside targets: 0.02700 → 0.02200 → 0.02014 (strong historical support)
⚠️ Daily close below 0.03100 confirms a potential fakeout
🎯 Trading Strategy & Risk Management
Ideal Entry Zone:
→ Retest range of 0.03300 – 0.03550
Stop Loss:
→ Below 0.03100 (invalidates bullish thesis)
Take Profit Levels:
→ Scale out profits at 0.043 / 0.049 / 0.073 / 0.106 etc.
> Using a trailing stop or scaling out strategy can maximize profits as the trend develops.
🔍 Technical Summary
This is a classic Breakout + Retest setup. The combination of trendline breakout, horizontal resistance flip, and retest creates a high-probability bullish pattern.
From a Wyckoff perspective, this could be the transition from accumulation to markup phase, especially if volume increases.
📢 DISCLAIMER:
This analysis is for educational purposes only and does not constitute financial advice. Always do your own research and manage risk accordingly.
#VANRY #VANRYUSDT #CryptoBreakout #AltcoinSetup #BullishRetest #DescendingTrendlineBreakout #CryptoTechnicalAnalysis #WyckoffAccumulation #BreakoutStrategy
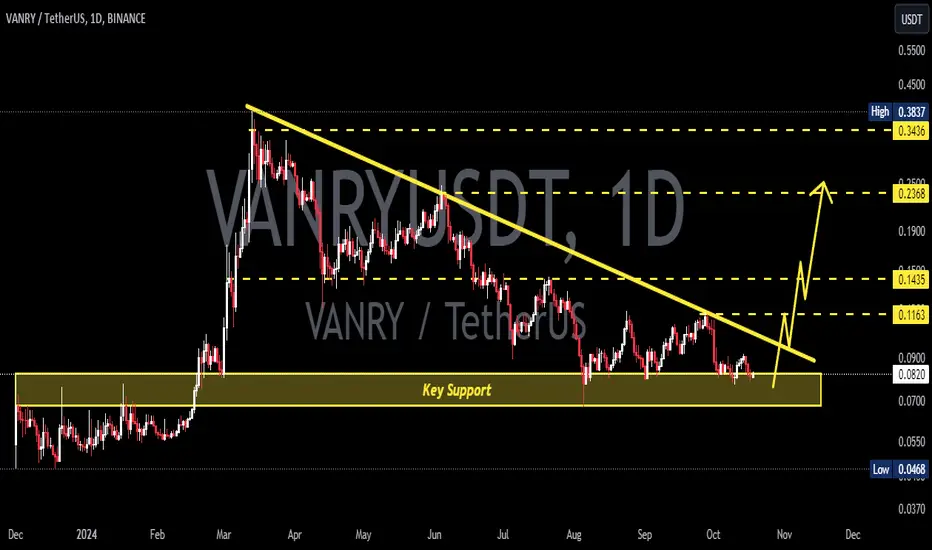
VANRYUSDT 1D AnalysisVANRY ~ 1D Analysis
#VANRY Buy back gradually from here if you still have confidence in this coin with a short term target of at least 15%++
VANRYUSDT 1D Analysis VANRY ~ 1D Analysis
#VANRY Buy gradually after successfully breaking through this resistance line with a short-term target of at least 15%+ And long term target $0.185
VANRYUSDT 1D VANRY Analysis VANRY ~ 1D Analysis
#VANRY Buy back gradually from here if you still have confidence in this coin with a short term target of at least 15%+ from here.
VANRYUSDT 1D AnalysisVANRY ~ 1D Analysis
#VANRY Buy after successfully penetrating this resistant line with a short -term target of at least 10%+ from here.
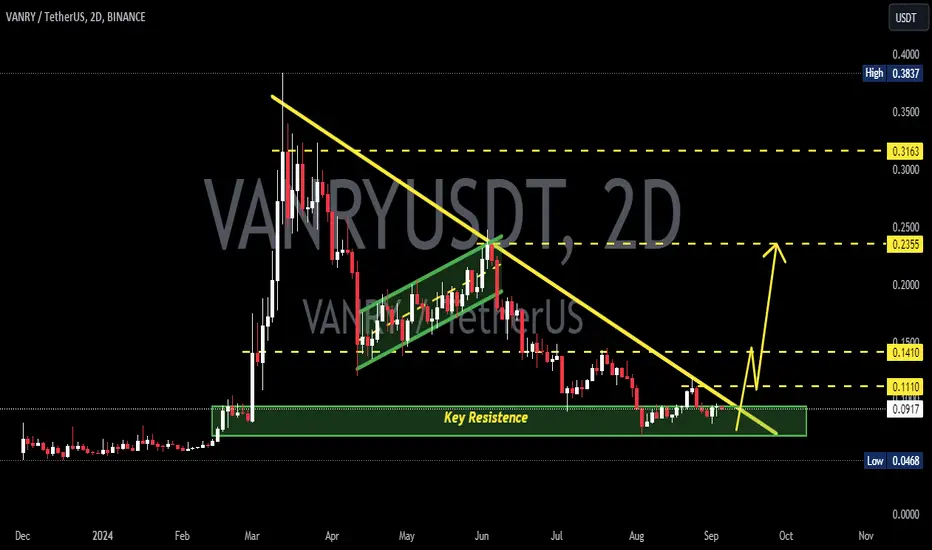
VANRYUSDT 2DVANRY ~ 2D Analysis
#VANRY on Time Frame 2D retesting this support,. buy from here if you still have Conviction on this coin. with a minimum target of 20%++

VANRYUSDTVANRY ~ 1D
#VANRY If you have Conviction on this coin. This support block is a very good price to start buying again.
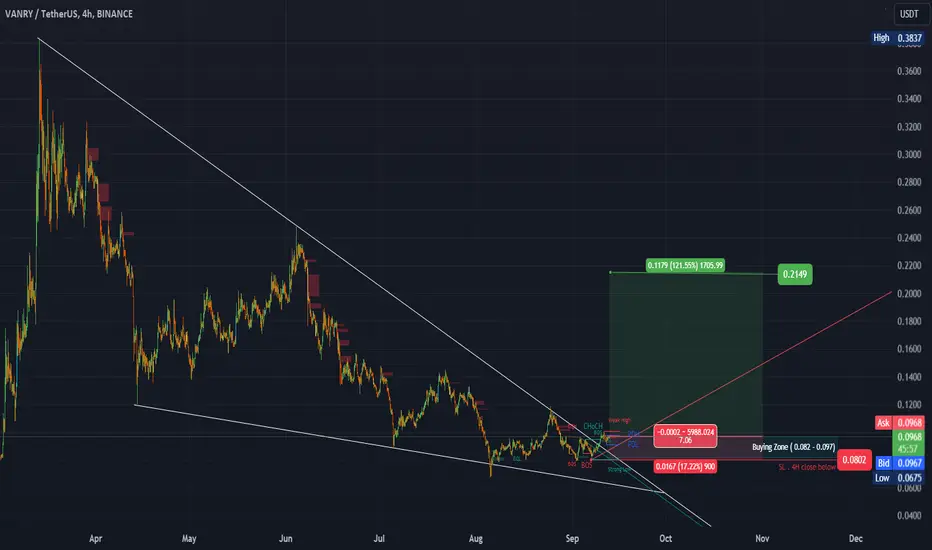
#VANRY (SPOT) entry range (0.082 - 0.097) T.(0.2149) SL (0.0802)entry range (0.082 - 0.097)
Target (0.2149)
SL .4H close below (0.0802)
*** Breakout and retest is done *****
************************************
#VANRY
#VANRYUSDT
#VANRYUSD
BINANCE:VANRYUSDT
#swingtrade
#shortterminvestment
#ALTCOIN
#Cryptotading
#cryptoinvesting
#investment
##trading
#cryptocurrencytrading
#bitcoininvestments
#Investing_Coins
#Investingcoins
#Crypto_investing
#Cryptoinvesting
**** #Manta ,#OMNI, #DYM, #AI, #IO, #XAI , #ACE #NFP #RAD #WLD #ORDI #BLUR #SUI #Voxel #AEVO #VITE #APE #RDNT #FLUX #NMR #VANRY ****
#bitcoin
#BTC
#BTCUSDT
VANRYUSDTVANRY ~ 1D
#VANRY If you have Conviction on this coin. This support block is a very good price to start buying again.
VANRYUSDT is gearing up for a big jump!!VANRYUSDT is showing strong bullish potential after successfully breaking key resistance levels and completing a healthy retracement. It’s maintaining its position above the 200 EMA, indicating a solid uptrend, supported by good trading volume. We’re expecting a significant upward movement soon. now is the time to watch this pair closely! Don't miss out on the opportunity to capitalize on this potential breakout! 📈
VANRYUSDT Currently trading at $0.11
Buy level: Above $0.109
Stop loss: Below $0.102
TP1: $0.114
TP2: $0.118
TP3: $0.13
TP4: $0.14
Max Leverage 3x
Follow Our Tradingview Account for More Technical Analysis Updates, | Like, Share and Comment Your thoughts
VANRYUSDTVANRY ~ 2D
#VANRY Do you have Conviction on this Coin. If yes, you need to pay attention to this key Support. We think it's going to be a pretty strong reversal from here.
VANRYUSD 1DVANRY ~ 1D
#VANRY Make small purchases in these demand zones. with a minimum target of 15%+