VANRY/USDT: Major Breakout from Downtrend – Is This the Start?
After months of downward pressure, VANRY/USDT has finally shown a strong technical breakout, potentially marking a shift in momentum and the beginning of a bullish phase.
📊 Technical Pattern & Market Structure
🔻 1. Descending Trendline Breakout
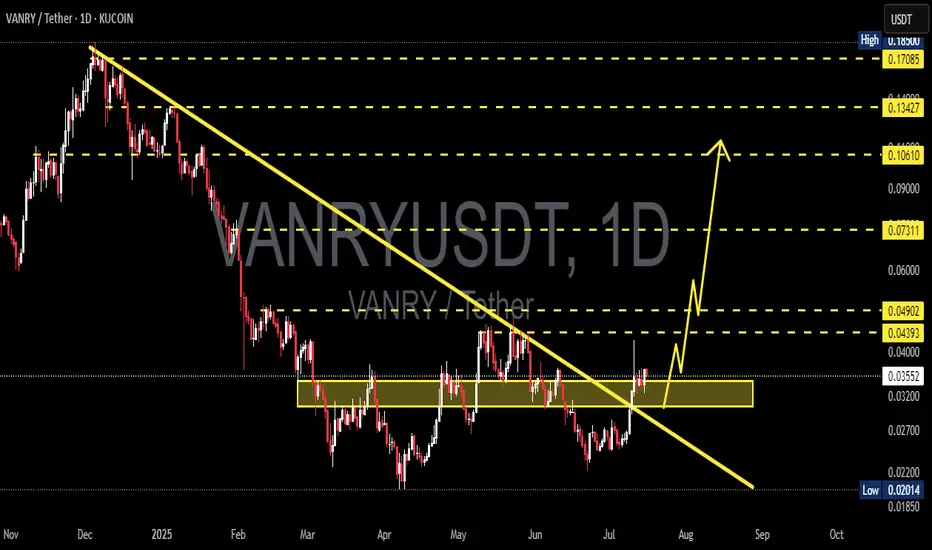
Price has successfully broken above a long-term descending trendline that has capped the market since November 2024. This breakout is a key signal of a potential trend reversal, suggesting the sellers are losing control.
🟨 2. Accumulation Zone Breakout
For over 3 months, the price consolidated within a clear accumulation zone between 0.02600 – 0.03300 USDT. The breakout from this zone indicates that accumulation may be complete, and price is now entering a markup phase.
🔁 3. Retest Confirmation
After the breakout, VANRY has successfully retested the previous resistance as new support (0.03300 – 0.03500), confirming the breakout as valid. This is often considered a textbook bullish setup.
✅ Bullish Scenario
As long as the price holds above the breakout zone, the bullish outlook remains intact. Key resistance levels to watch:
Target Price Level Notes
🎯 Target 1 0.04393 USDT Minor resistance
🎯 Target 2 0.04902 USDT Key psychological level
🎯 Target 3 0.07311 USDT Mid-term bullish target
🎯 Target 4 0.10610 – 0.13427 USDT Long-term rally potential
🚀 Final Target 0.17085 USDT Previous swing high
> As long as price sustains above 0.035, these targets remain highly achievable in the coming weeks.
❌ Bearish Scenario
In case of a failed breakout or rejection from key resistances, the bearish case still exists:
🔻 Drop below 0.03200 could signal a failed breakout
📉 Downside targets: 0.02700 → 0.02200 → 0.02014 (strong historical support)
⚠️ Daily close below 0.03100 confirms a potential fakeout
🎯 Trading Strategy & Risk Management
Ideal Entry Zone:
→ Retest range of 0.03300 – 0.03550
Stop Loss:
→ Below 0.03100 (invalidates bullish thesis)
Take Profit Levels:
→ Scale out profits at 0.043 / 0.049 / 0.073 / 0.106 etc.
> Using a trailing stop or scaling out strategy can maximize profits as the trend develops.
🔍 Technical Summary
This is a classic Breakout + Retest setup. The combination of trendline breakout, horizontal resistance flip, and retest creates a high-probability bullish pattern.
From a Wyckoff perspective, this could be the transition from accumulation to markup phase, especially if volume increases.
📢 DISCLAIMER:
This analysis is for educational purposes only and does not constitute financial advice. Always do your own research and manage risk accordingly.
#VANRY #VANRYUSDT #CryptoBreakout #AltcoinSetup #BullishRetest #DescendingTrendlineBreakout #CryptoTechnicalAnalysis #WyckoffAccumulation #BreakoutStrategy
Vanryusdlong
VANRYUSDT 1D AnalysisVANRY ~ 1D Analysis
#VANRY Buy back gradually from here if you still have confidence in this coin with a short term target of at least 15%++
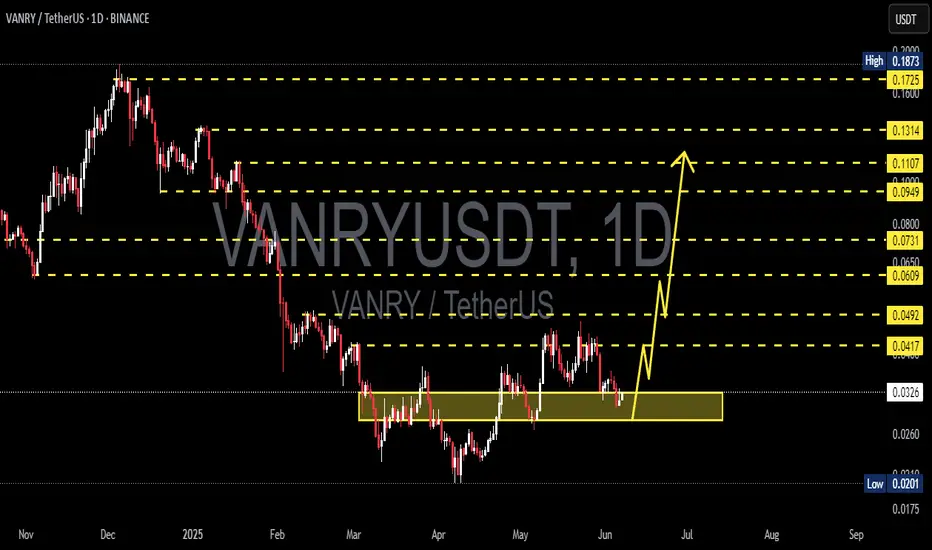
VANRYUSDT 1D Analysis VANRY ~ 1D Analysis
#VANRY Buy gradually after successfully breaking through this resistance line with a short-term target of at least 15%+ And long term target $0.185
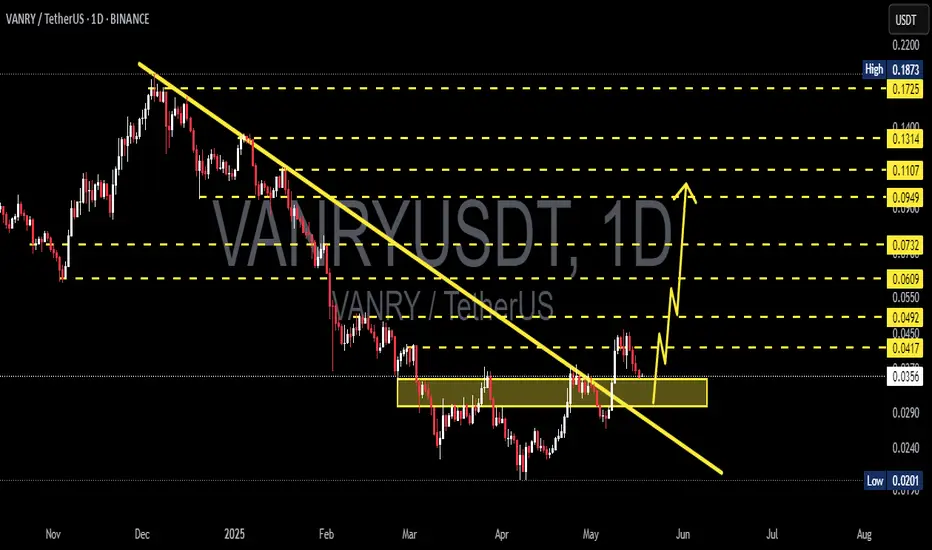
VANRYUSDT 1D VANRY Analysis VANRY ~ 1D Analysis
#VANRY Buy back gradually from here if you still have confidence in this coin with a short term target of at least 15%+ from here.
#VANRY/USDT#VANRY
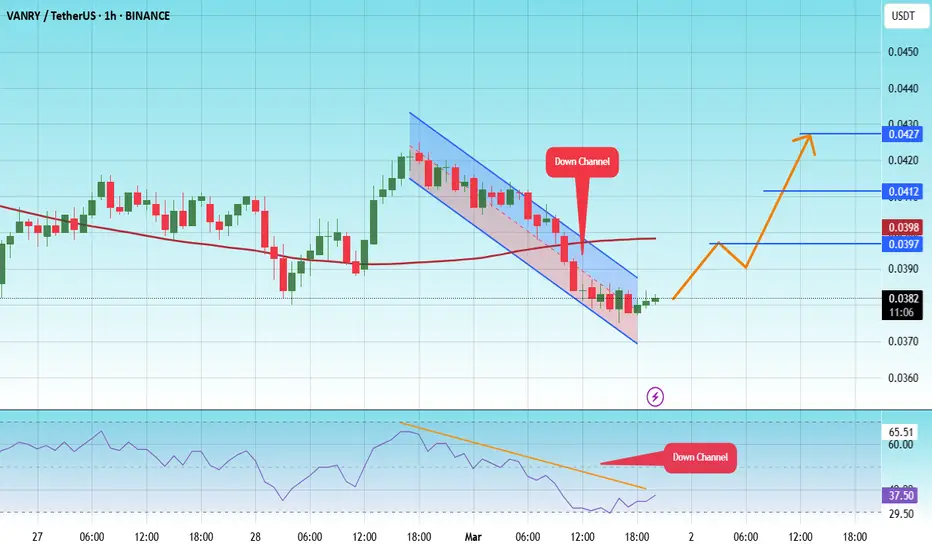
The price is moving in a descending channel on the 1-hour frame and is expected to continue upwards
We have a trend to stabilize above the moving average 100 again
We have a descending trend on the RSI indicator that supports the rise by breaking it upwards
We have a support area at the lower limit of the channel at a price of 0.0374
Entry price 0.0381
First target 0.0397
Second target 0.0412
Third target 0.0427
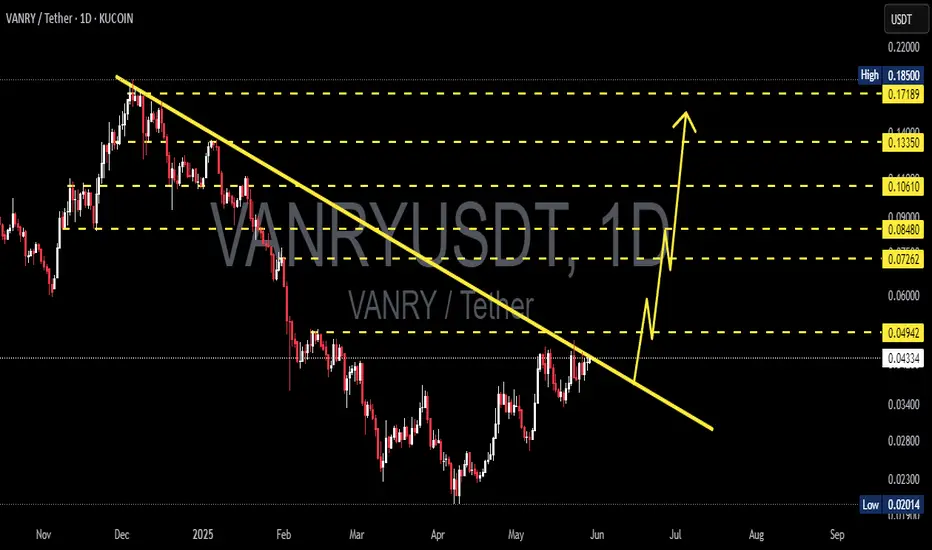
VANRYUSDT 1D AnalysisVANRY ~ 1D Analysis
#VANRY Buy after successfully penetrating this resistant line with a short -term target of at least 10%+ from here.
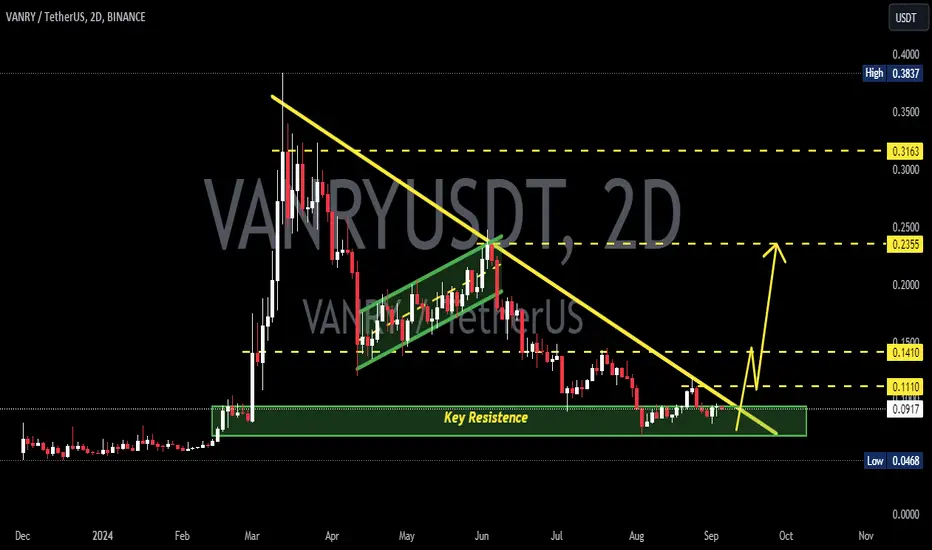
VANRYUSDT 2DVANRY ~ 2D Analysis
#VANRY on Time Frame 2D retesting this support,. buy from here if you still have Conviction on this coin. with a minimum target of 20%++

VANRYUSDTVANRY ~ 1D
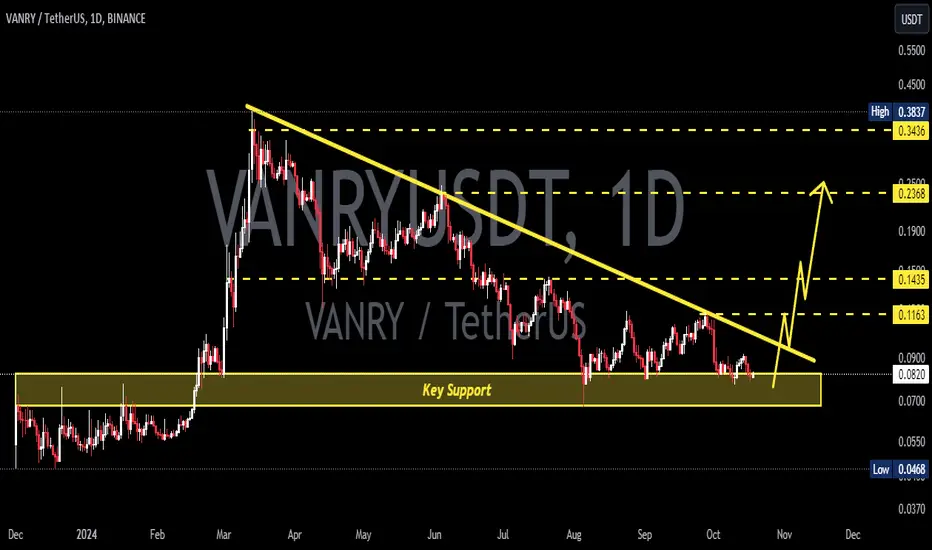
#VANRY If you have Conviction on this coin. This support block is a very good price to start buying again.
VANRYUSDTVANRY ~ 1D
#VANRY If you have Conviction on this coin. This support block is a very good price to start buying again.
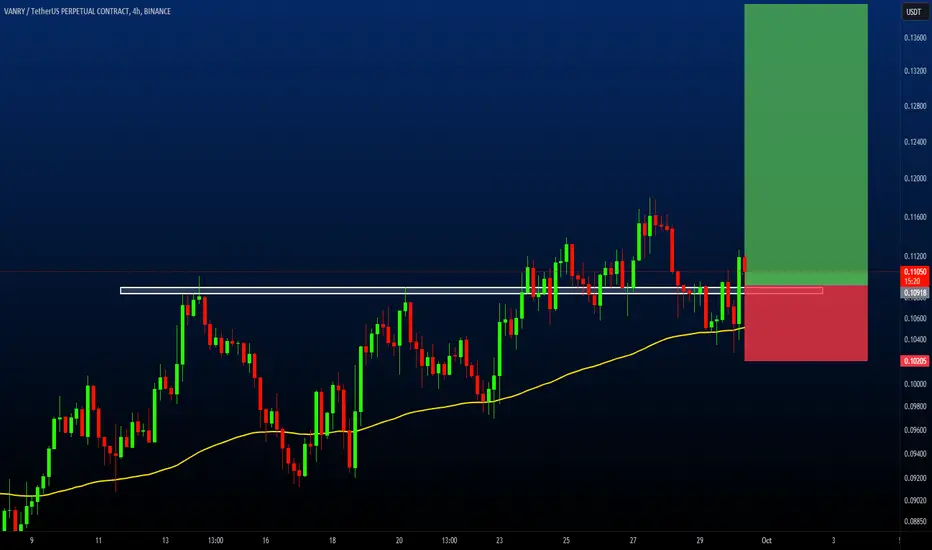
VANRYUSDT is gearing up for a big jump!!VANRYUSDT is showing strong bullish potential after successfully breaking key resistance levels and completing a healthy retracement. It’s maintaining its position above the 200 EMA, indicating a solid uptrend, supported by good trading volume. We’re expecting a significant upward movement soon. now is the time to watch this pair closely! Don't miss out on the opportunity to capitalize on this potential breakout! 📈
VANRYUSDT Currently trading at $0.11
Buy level: Above $0.109
Stop loss: Below $0.102
TP1: $0.114
TP2: $0.118
TP3: $0.13
TP4: $0.14
Max Leverage 3x
Follow Our Tradingview Account for More Technical Analysis Updates, | Like, Share and Comment Your thoughts
VANRYUSDTVANRY ~ 2D
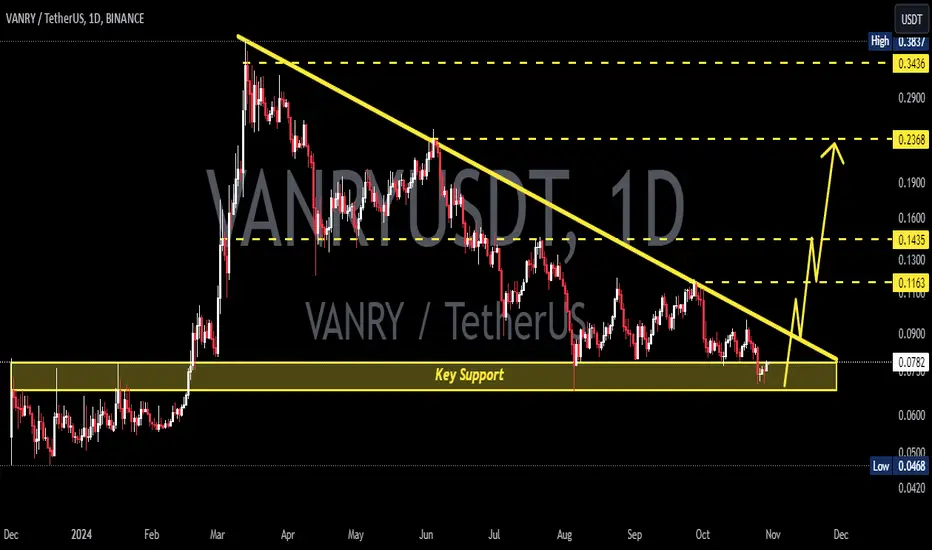
#VANRY Do you have Conviction on this Coin. If yes, you need to pay attention to this key Support. We think it's going to be a pretty strong reversal from here.
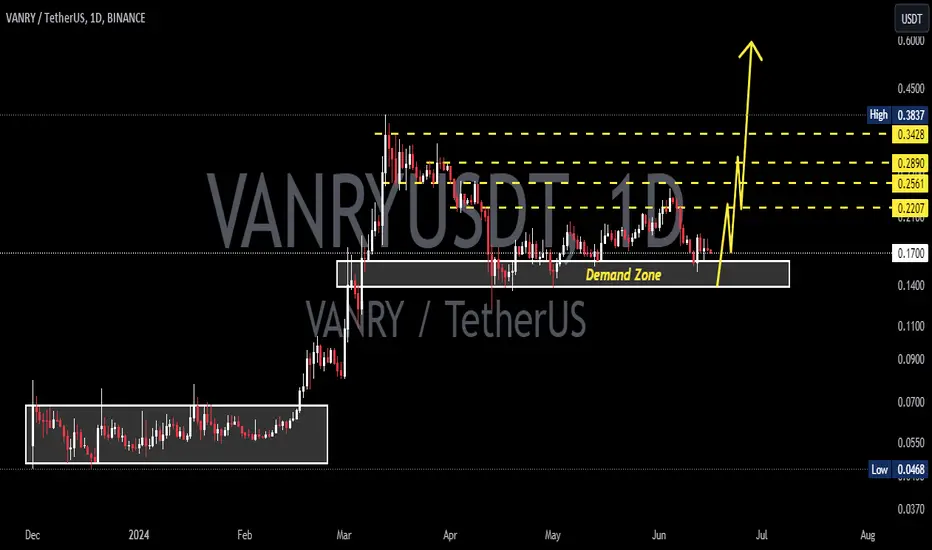
VANRYUSD 1DVANRY ~ 1D
#VANRY Make small purchases in these demand zones. with a minimum target of 15%+
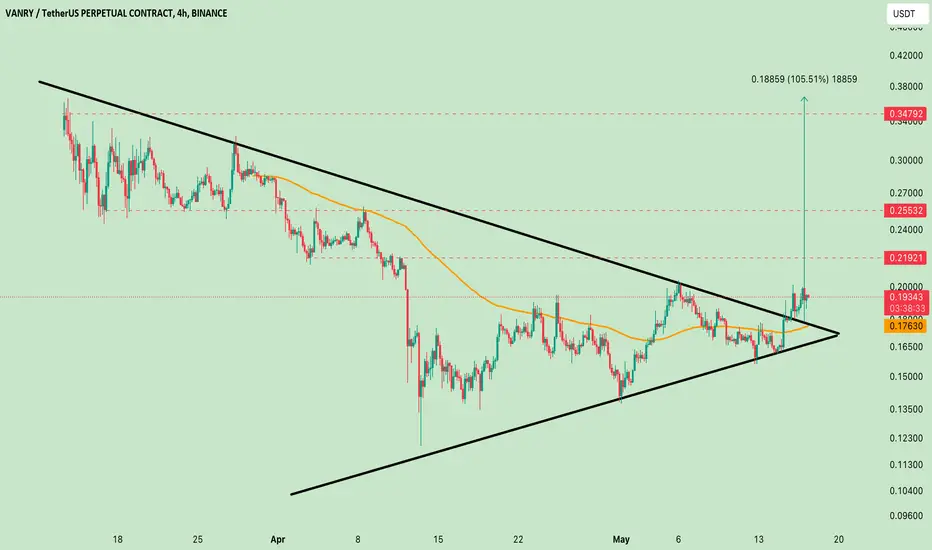
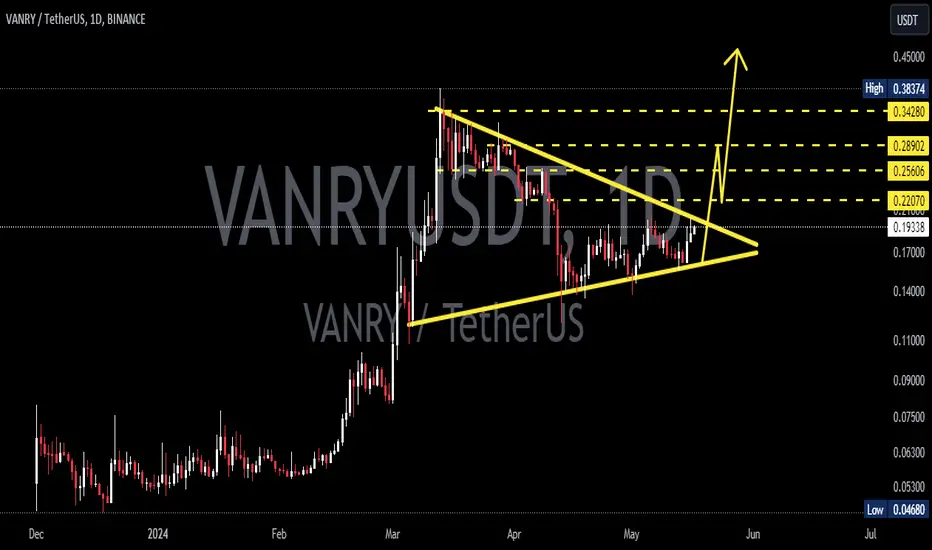
#VANRY/USDT TREAD SETUP#VANRY TRADE SETUP
VANRY breaks this symmetrical triangle pattern and correctly retests it, We anticipate a significant bounce of up to 70% to 100% following the breakout of this pattern.
Entry: CMP and add up to $0.178
DYOR, NFA
#Crypto
VANRYUSD 1DVANRY ~ 1D
#VANRY Make purchases gradually from here, or buy after successfully breaking through the resistance line of this pattern, with a minimum target of 15%+
VANRY/USDT Idea Vanry/USDT has formed a triangle pattern on the 4-hour time frame, indicating a potential breakout. If the price successfully breaks out, we could see a significant bullish rally in the Vanry price. Please note that this is not financial advice, so make sure to do your own research (DYOR) before making any investment decisions.

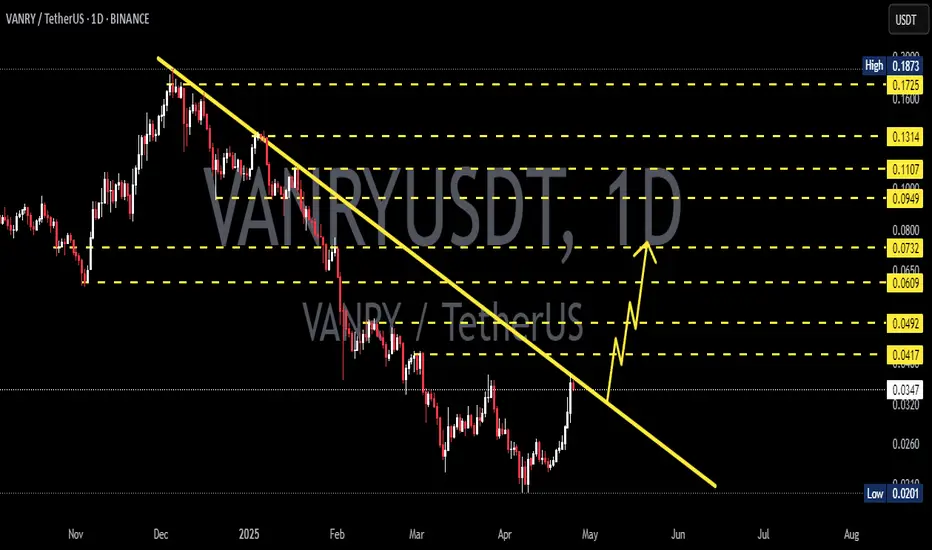
VANRYUSD completion of a two-year accumulationThe VANRY/USD pair is currently in play.
We are observing an exit from a two-year accumulation zone. In the medium term perspective, growth up to 0.5 and higher can be expected.
Levels 0.15-0.16 and 0.3 can act as resistance zones and/or intermediate targets.
