VANRYUSDT UPDATE#VANRY
UPDATE
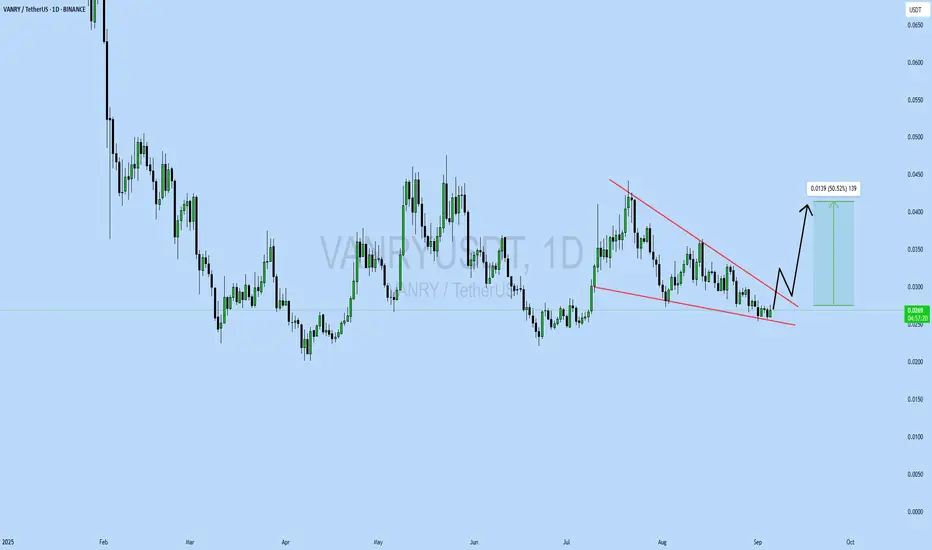
VANRY Technical Setup
Pattern : Bullish Falling Wedge Pattern
Current Price: $0.0269
Target Price: $0.041
Target % Gain: 50.52%
Technical Analysis: VANRY is consolidating within a falling wedge on the 1D chart and showing signs of a potential breakout. A move above the wedge resistance could trigger bullish momentum toward $0.041.
Time Frame: 1D
Risk Management Tip: Always use proper risk management.
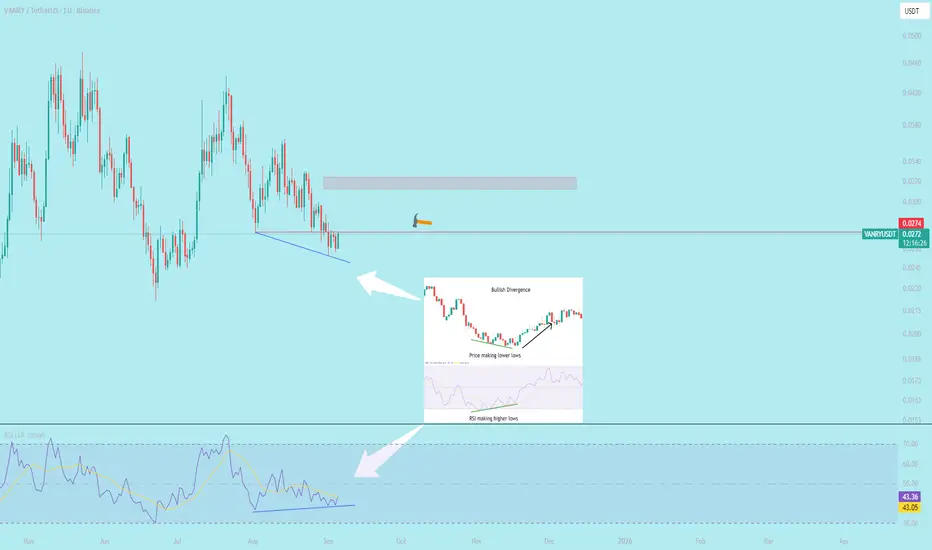
Vanryusdt
$Vanry LOOKS Bullish with (RSI) bullish divergence The Relative Strength Index (RSI) bullish divergence is a pattern in technical analysis that signals a potential upward reversal in an asset's price. It occurs when an asset's price reaches lower lows, but the RSI, a momentum oscillator, forms higher lows.
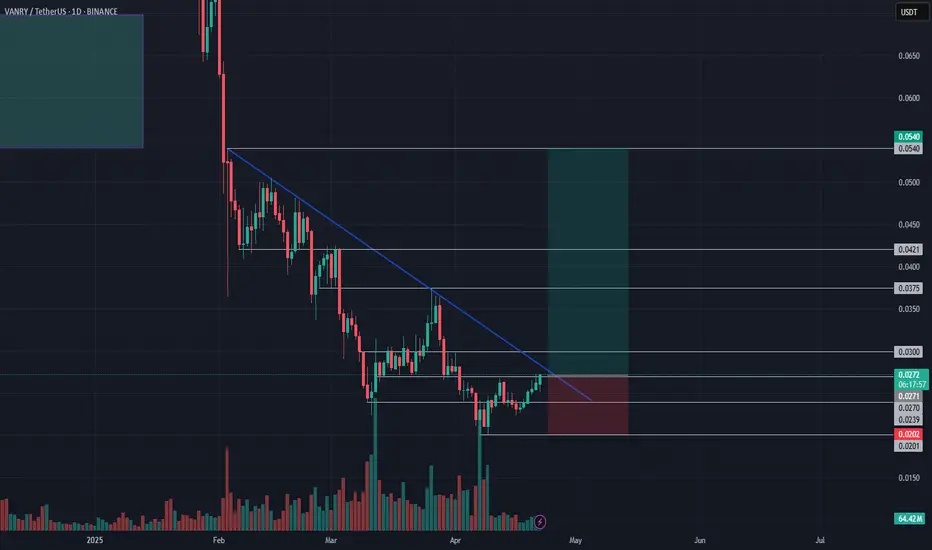
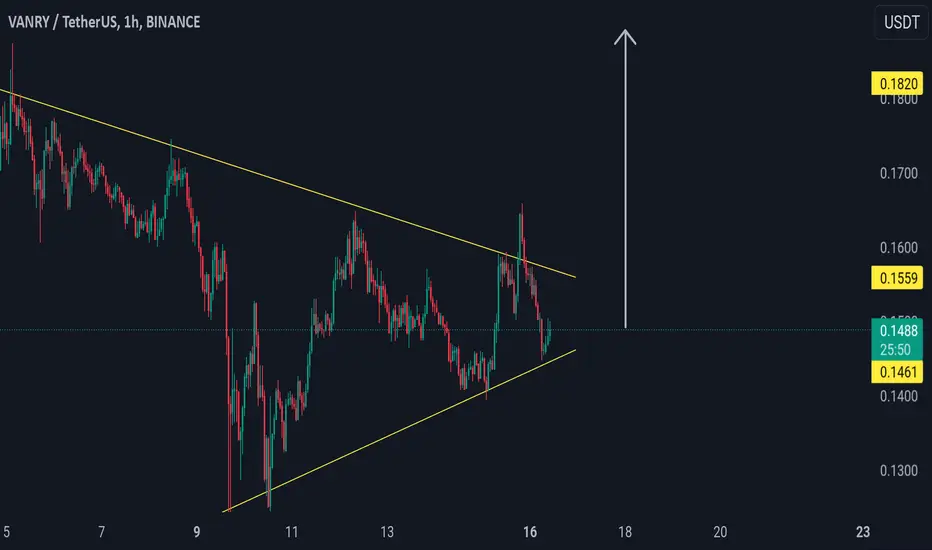
VANRY/USDT – Symmetrical Triangle, Major Breakout Approaching!🔎 Chart Overview
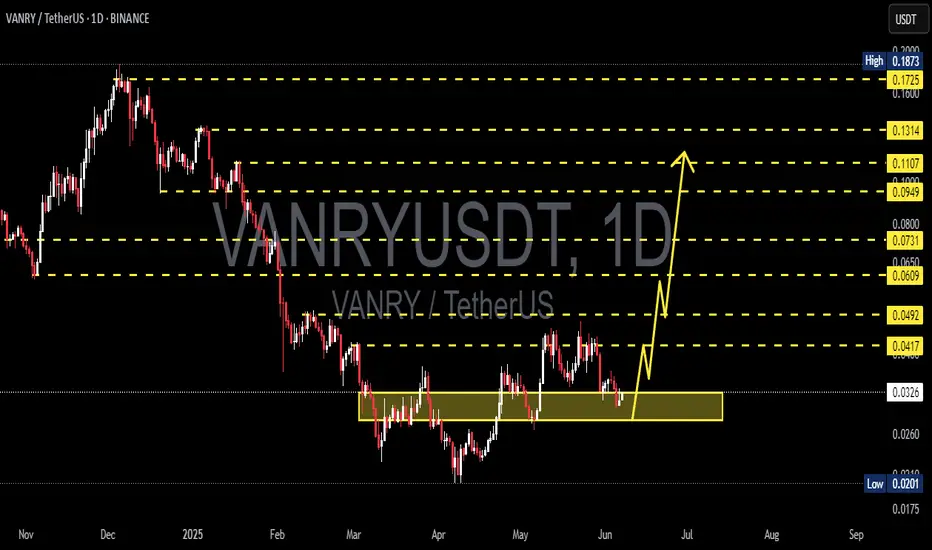
VANRY/USDT is currently in a consolidation phase after a prolonged downtrend since early 2025. Key observations:
Price is stuck inside the demand zone 0.028 – 0.036 USDT (yellow box), which has acted as strong support for months.
A symmetrical triangle pattern is forming, indicating accumulation before a decisive move.
The descending trendline is still pressing the price down, but the apex is approaching → a major breakout or breakdown is imminent.
---
🚀 Bullish Scenario
Trigger:
✅ Daily close above 0.036 USDT with strong volume → breakout from the triangle and descending trendline.
Potential targets:
🎯 First target: 0.040 – 0.04382 USDT (minor resistance + triangle height projection).
🎯 Next target: 0.04930 USDT (key resistance).
🎯 With strong momentum: extension toward 0.07305 USDT, and potentially 0.109 – 0.133 USDT in the mid-term.
Additional bullish confirmation:
Successful retest of 0.036 as new support after breakout.
Increased buying volume confirming buyer dominance.
---
🐻 Bearish Scenario
Trigger:
❌ Daily close below 0.030 – 0.028 USDT → breakdown of the demand zone and triangle.
Potential targets:
🎯 First target: 0.026 USDT.
🎯 Next target: 0.024 USDT (triangle breakdown projection).
🎯 If selling pressure intensifies, price may revisit the historical low at 0.02014 USDT.
Additional bearish confirmation:
Breakdown supported by high volume.
Weak or no rebound after falling below 0.028.
---
📌 Conclusion
VANRY is at a critical stage. The symmetrical triangle within the demand zone signals price compression that will soon resolve.
A breakout above 0.036 USDT could spark a strong rally.
A breakdown below 0.028 USDT could open the way toward 0.02014 USDT.
👉 Key levels to watch: 0.036 (bullish breakout) and 0.028 (bearish breakdown) with daily close and volume confirmation.
#VANRY #VANRYUSDT #CryptoAnalysis #PriceAction #SymmetricalTriangle #Breakout #CryptoTrading #AltcoinAnalysis #TechnicalAnalysis
VANRYUSDT Forming Potential BreakoutVANRYUSDT is currently showing a potential breakout pattern, making it one of the more exciting altcoins to keep an eye on in the short term. The price structure has tightened in recent sessions, often a precursor to explosive movement. With strong volume backing the recent price action, the possibility of an upward breakout becomes increasingly likely. Based on the technical setup and broader sentiment, an expected gain of 50% to 60%+ could be achievable in the coming weeks if momentum sustains.
Vanar Chain (VANRY) is beginning to catch the attention of investors due to its innovative blockchain infrastructure and expanding ecosystem. As the project builds utility and demonstrates consistent development, interest from both retail and strategic backers is on the rise. This growing traction is contributing to the observed increase in trading activity, further fueling the potential breakout scenario from a technical standpoint.
The current chart suggests price consolidation near a key resistance level, which, once breached, could trigger a significant upward push. Traders watching this setup may consider entering upon confirmation of the breakout with volume, targeting higher levels based on recent price history and measured move projections. This makes VANRYUSDT an attractive play for breakout traders and momentum investors.
✅ Show your support by hitting the like button and
✅ Leaving a comment below! (What is You opinion about this Coin)
Your feedback and engagement keep me inspired to share more insightful market analysis with you!

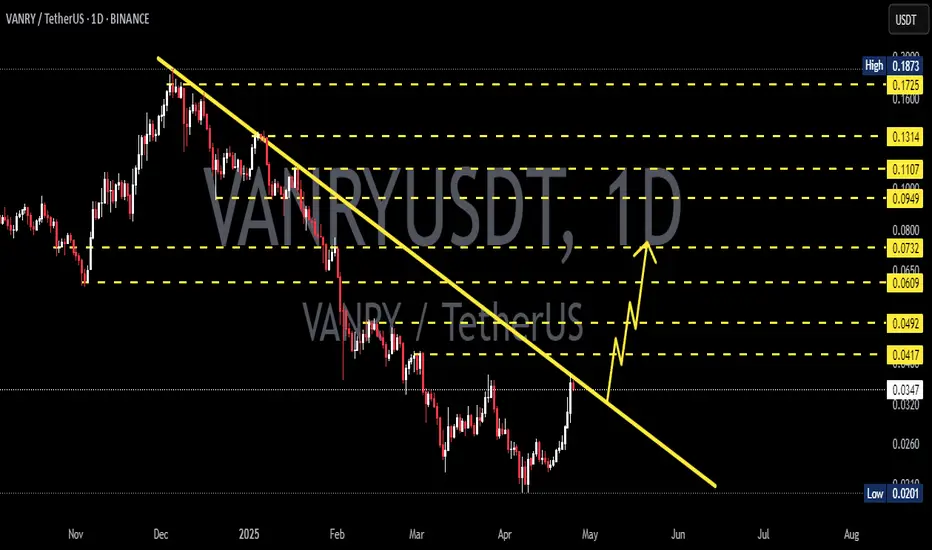
VANRY/USDT: Major Breakout from Downtrend – Is This the Start?
After months of downward pressure, VANRY/USDT has finally shown a strong technical breakout, potentially marking a shift in momentum and the beginning of a bullish phase.
📊 Technical Pattern & Market Structure
🔻 1. Descending Trendline Breakout
Price has successfully broken above a long-term descending trendline that has capped the market since November 2024. This breakout is a key signal of a potential trend reversal, suggesting the sellers are losing control.
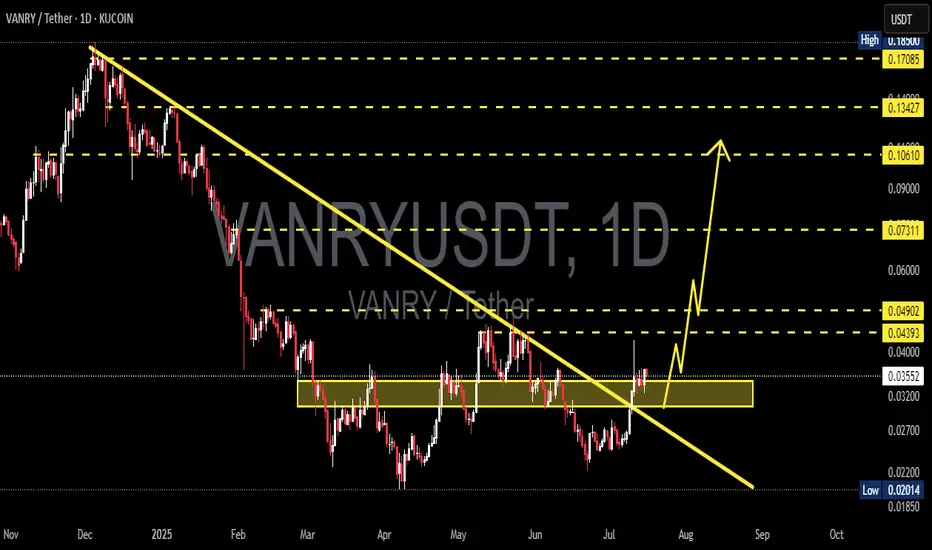
🟨 2. Accumulation Zone Breakout
For over 3 months, the price consolidated within a clear accumulation zone between 0.02600 – 0.03300 USDT. The breakout from this zone indicates that accumulation may be complete, and price is now entering a markup phase.
🔁 3. Retest Confirmation
After the breakout, VANRY has successfully retested the previous resistance as new support (0.03300 – 0.03500), confirming the breakout as valid. This is often considered a textbook bullish setup.
✅ Bullish Scenario
As long as the price holds above the breakout zone, the bullish outlook remains intact. Key resistance levels to watch:
Target Price Level Notes
🎯 Target 1 0.04393 USDT Minor resistance
🎯 Target 2 0.04902 USDT Key psychological level
🎯 Target 3 0.07311 USDT Mid-term bullish target
🎯 Target 4 0.10610 – 0.13427 USDT Long-term rally potential
🚀 Final Target 0.17085 USDT Previous swing high
> As long as price sustains above 0.035, these targets remain highly achievable in the coming weeks.
❌ Bearish Scenario
In case of a failed breakout or rejection from key resistances, the bearish case still exists:
🔻 Drop below 0.03200 could signal a failed breakout
📉 Downside targets: 0.02700 → 0.02200 → 0.02014 (strong historical support)
⚠️ Daily close below 0.03100 confirms a potential fakeout
🎯 Trading Strategy & Risk Management
Ideal Entry Zone:
→ Retest range of 0.03300 – 0.03550
Stop Loss:
→ Below 0.03100 (invalidates bullish thesis)
Take Profit Levels:
→ Scale out profits at 0.043 / 0.049 / 0.073 / 0.106 etc.
> Using a trailing stop or scaling out strategy can maximize profits as the trend develops.
🔍 Technical Summary
This is a classic Breakout + Retest setup. The combination of trendline breakout, horizontal resistance flip, and retest creates a high-probability bullish pattern.
From a Wyckoff perspective, this could be the transition from accumulation to markup phase, especially if volume increases.
📢 DISCLAIMER:
This analysis is for educational purposes only and does not constitute financial advice. Always do your own research and manage risk accordingly.
#VANRY #VANRYUSDT #CryptoBreakout #AltcoinSetup #BullishRetest #DescendingTrendlineBreakout #CryptoTechnicalAnalysis #WyckoffAccumulation #BreakoutStrategy
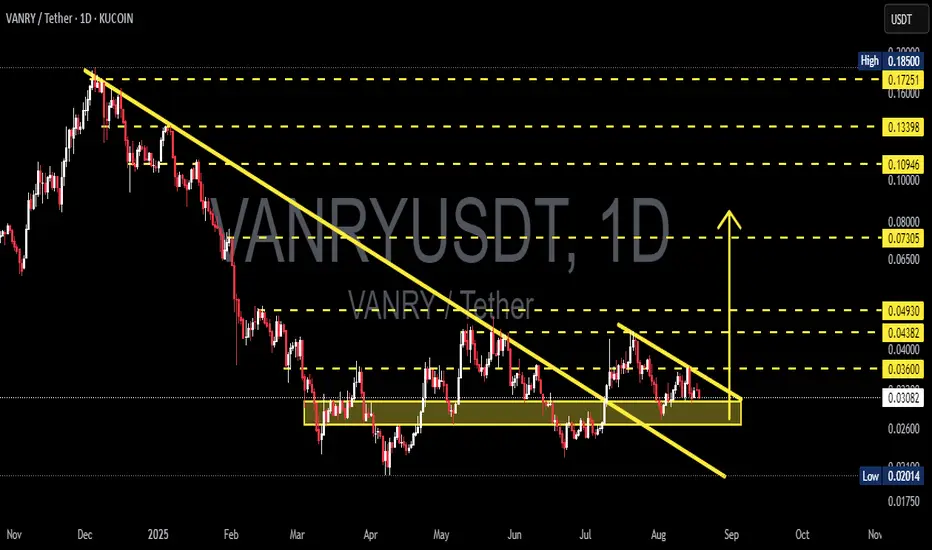
VANRYUSDT 1D AnalysisVANRY ~ 1D Analysis
#VANRY Buy back gradually from here if you still have confidence in this coin with a short term target of at least 15%++
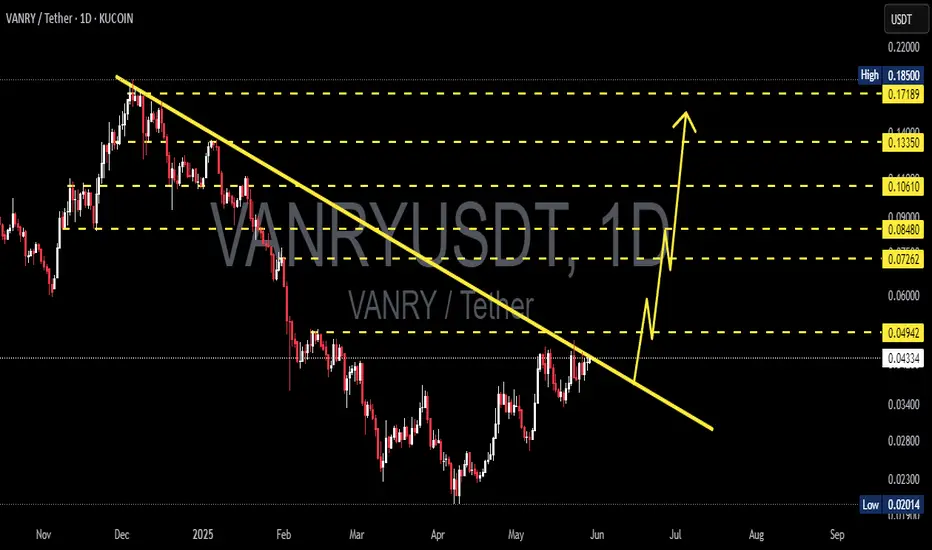
VANRYUSDT 1D Analysis VANRY ~ 1D Analysis
#VANRY Buy gradually after successfully breaking through this resistance line with a short-term target of at least 15%+ And long term target $0.185
VANRYUSDT 1D VANRY Analysis VANRY ~ 1D Analysis
#VANRY Buy back gradually from here if you still have confidence in this coin with a short term target of at least 15%+ from here.
#VANRY/USDT#VANRY
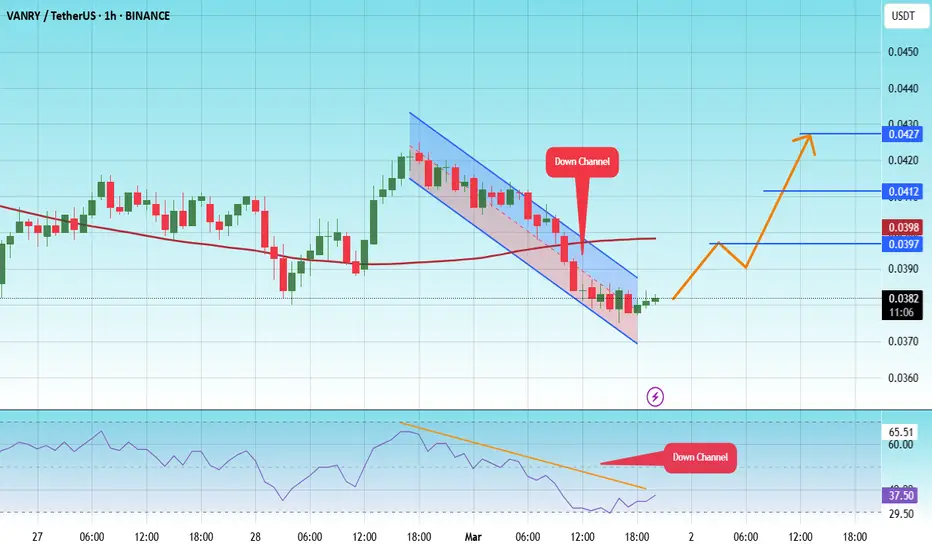
The price is moving in a descending channel on the 1-hour frame and is expected to continue upwards
We have a trend to stabilize above the moving average 100 again
We have a descending trend on the RSI indicator that supports the rise by breaking it upwards
We have a support area at the lower limit of the channel at a price of 0.0374
Entry price 0.0381
First target 0.0397
Second target 0.0412
Third target 0.0427
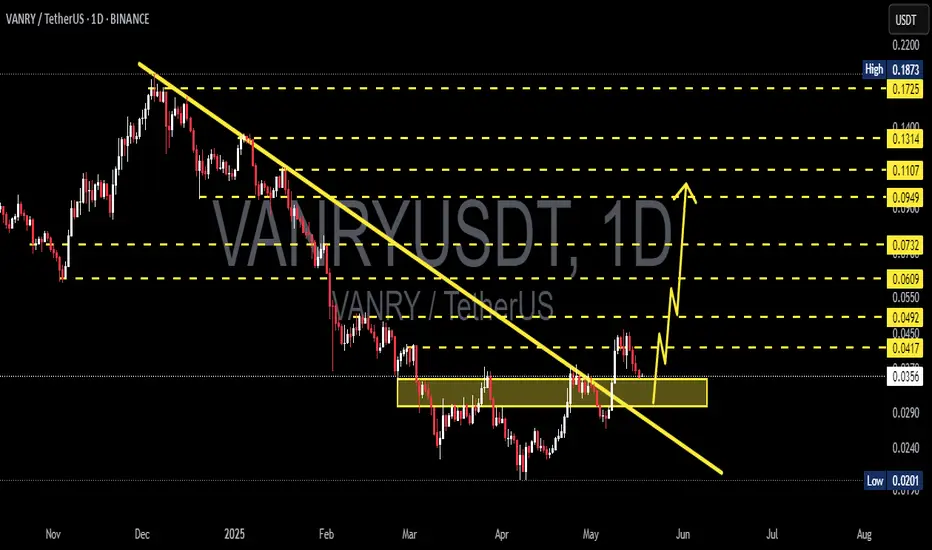
VANRYUSDT 1D AnalysisVANRY ~ 1D Analysis
#VANRY Buy after successfully penetrating this resistant line with a short -term target of at least 10%+ from here.
VANRY BREAKOUT>>> 100% pump incoming....As we see the trend, the Vanry made the bottom now is reclaimin the price slowvly but goind up. Very soon to breakout and move on for other resistances, so this is a good buy here..
Not financial adice .)
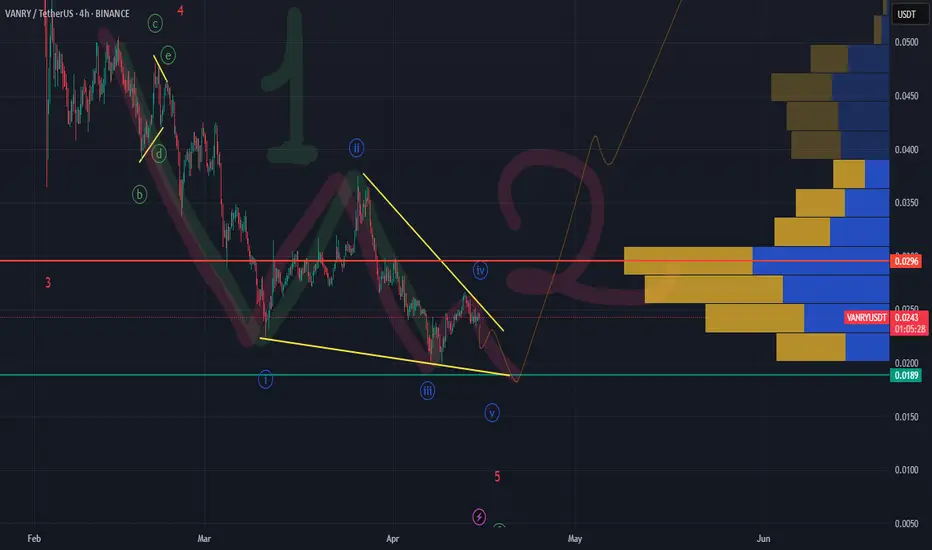
Vanar Morgulis, boizSoo, Do u think Im done?
Nooope :) Patience and cold calculation are what is needed in trading high-risk assets.
AND THIS EXPERIENCE COST ME A LOT!! I share it with you.
Anyway. I have been studying trading platforms for a long time and I am returning to the game, faster, smarter, stronger.. as it was with Daft Punk
If Im genious enough (yas IT IZ), then we have two options:
LOOK closer, folkz and don't be fooled - wave 5 of C is yet to be set , if it is ED (option 2)
Othawise, if the correction is really over, then it was ZZ and we can take Longz (option 1)
zoom out my chart and look at the Fibonacci levels - if there is a correction, it will be very little. And this is the case with almost all altcoins.
I was very surprised by the amount of sleepy memes that Binance listed through, it's real madness. But, money doesn't smell, you can trade both lead and cheese
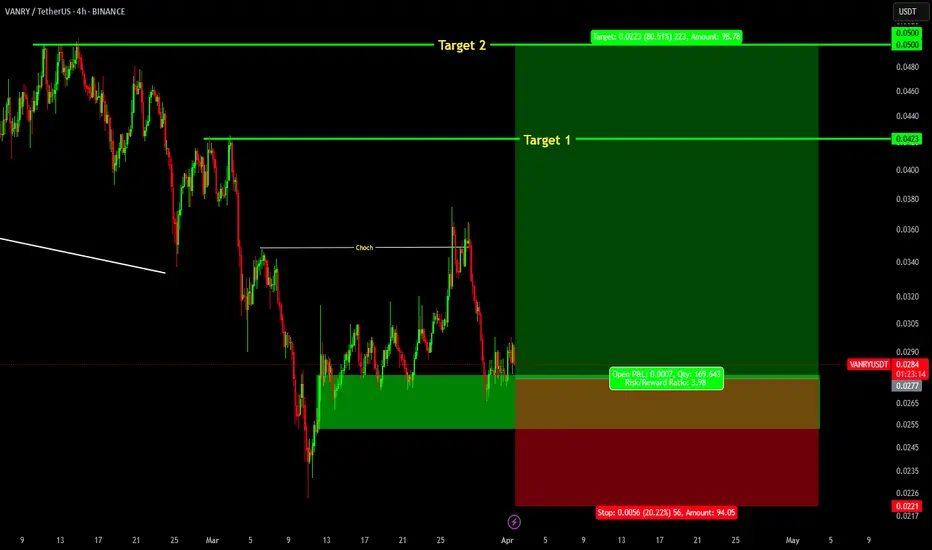
VANRY Long Trade SetupOn 4hr time frame, clean Change Of Character (ChoCh) has been observed indicating sign of strength. Price is at demand , Stoploss: 0.022, Targets: 0.0423 & 0.05
VANRYUSDT Approaching a Breakout from Falling Wedge VANRYUSDT is currently forming a falling wedge pattern, a bullish technical setup that traders are closely watching. This pattern often signals a potential breakout, and with strong volume backing the movement, the chances of a significant price surge are increasing. As the price consolidates within the wedge, buyers are gradually stepping in, indicating growing investor confidence in this project.
The market sentiment around VANRYUSDT remains positive, with investors showing increased interest in its potential. A breakout from this pattern could trigger an explosive rally, with expected gains ranging between 250% to 300%. If the price successfully breaches the resistance, it could initiate a strong uptrend, attracting even more market participants and pushing VANRYUSDT toward higher levels.
With strong volume supporting the price action, traders should keep a close watch on the key resistance level. A confirmed breakout with sustained buying pressure could validate the bullish outlook. As the crypto market remains volatile, proper risk management and technical confirmation are essential before entering a position in this promising setup.
✅ Show your support by hitting the like button and
✅ Leaving a comment below! (What is your opinion about this Coin?)
Your feedback and engagement keep me inspired to share more insightful market analysis with you!

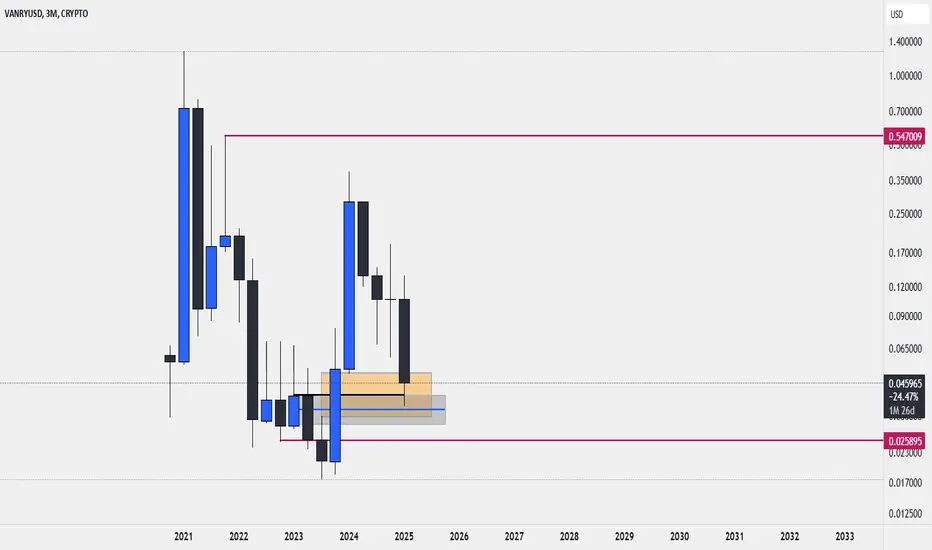
Vanry I am posting a quarterly chart for Vanry as the story becomes more clear.
Trend came back to cover the imbalance and in my opinion it will take further liquidity from the mid point of the breaker which is around 0.0350 level.
There would be some consolidation which will be reversal pattern form and then we should draw towards highs at 0.54.
Keep in mind this is 3M chart so it should take around a year or more for things to unfold.
VANRYUSDT 2DVANRY ~ 2D Analysis
#VANRY on Time Frame 2D retesting this support,. buy from here if you still have Conviction on this coin. with a minimum target of 20%++

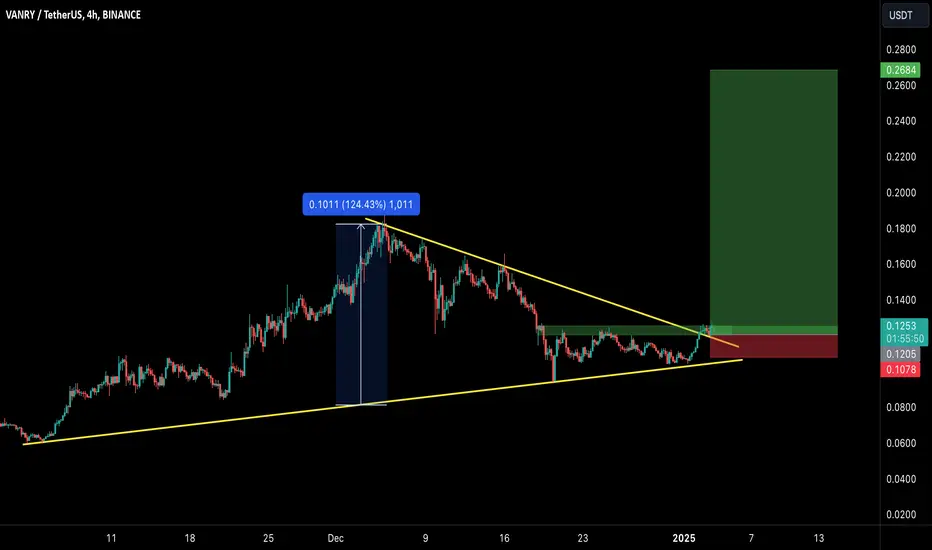
VANRY/USDT Breakout Alert: Ready for a 100%+ Rally!!🚀 Hey Traders! 👋
If this setup excites you, hit that 👍 and smash Follow for trade ideas that deliver real results! 💹🔥
VANRY: Primed for Liftoff! 🚀
VANRY is breaking out from a symmetrical triangle on the 4-hour timeframe and has successfully retested it. The chart is screaming bullish potential, and this could be the start of an explosive move!
📍 Entry Range: Current Market Price (CMP) – Add more up to $0.115
🎯 Target: 100-120% upside potential
🔒 Stop-Loss: $0.108
⚖️ Leverage: Use low leverage (Max 5x) to manage risk
💬 What’s Your Take?
Do you see the same explosive potential in VANRY? Share your analysis, strategies, or predictions in the comments below. Let’s capitalize on this opportunity together and secure those massive gains! 💰🌊
VANRY planThis is my VANRY plan, I'm expecting a bounce around the 0.75 fib level. That is where I will enter

VANRY - Potential reversal hereI'm expecting VANRY to higher from this here. After bouncing from the 0.75 fib level

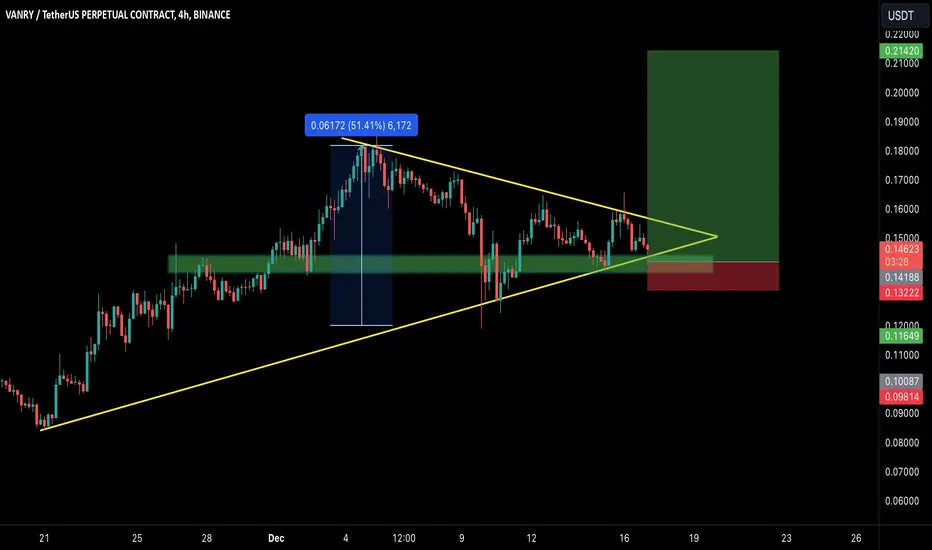
VANRY/USDT: 50% PROFIT POTENTIAL SETUP!!🚀 Hey Traders! 👋
If this analysis hits the mark for you, don’t forget to smash that 👍 and hit Follow for premium trade setups that actually deliver results! 💹🔥
VANRY Looking Strong! 📈
VANRY is forming a symmetrical triangle on the 4-hour time frame and is holding the lower trendline like a champ. A solid bounce looks imminent from here. This could be your chance to catch a big move early! 🚀
📌 Trade Setup:
Entry Range: CMP and add more up to $0.138
Targets: $0.16 / $0.178 / $0.192 / $0.214 🎯
Stop Loss: $0.132 (Keep risk in check)
Leverage: Low leverage only (Max 5x)
💬 What’s Your Take?
Are you seeing the same breakout potential? Drop your thoughts, analysis, or predictions in the comments—let’s strategize and ride this wave together for massive profits! 🌊💰
👉 Stay tuned for more winning setups! 🚀💹
VANRY/USDT:Preparing for a Breakout After Reboundng from supportVANRY/USDT: Preparing for a Breakout After Rebounding from Trendline Support
VANRY/USDT is showing promising signs 📈 as it bounces off a strong trendline support and makes its way toward a critical resistance zone 📊. The pair is setting up a potential breakout scenario 💥, which could ignite a powerful bullish rally 🚀. Stay alert and wait for confirmation before taking action 👀.
Key Insights:
1. Trendline rebound: VANRY/USDT has successfully held its ground at a key trendline support, showing strong buyer interest at this level.
2. Approaching resistance: The price is now nearing a significant trendline resistance. A breakout above this zone could lead to substantial bullish momentum.
3. Bullish signals: Momentum indicators such as RSI and MACD are recovering and aligning with a bullish outlook ⚡.
Steps to Confirm the Breakout:
Monitor the resistance zone: Watch for a 4H or daily candle closing above the trendline resistance 📍.
Check trading volume: A noticeable surge in volume during the breakout is critical to confirm strong buyer activity 🔥.
Look for a retest: A successful retest of the broken resistance as new support can validate the breakout ✅.
Beware of fake-outs: Keep an eye on sharp reversals or wicks above the trendline that can indicate false breakouts ⚠️.
Risk Management Strategies:
Use stop-loss orders below the trendline support to limit potential losses 🔒.
Position sizing should be aligned with your overall trading plan to manage risk effectively 🎯.
Outlook:
If the breakout occurs, VANRY/USDT could kickstart a significant bullish rally, providing excellent trading opportunities for those who plan their entries wisely.
This analysis is for educational purposes only and not financial advice. Always conduct your own research (DYOR) 🔍 before making investment decisions.
VANRYUSDT Bullish Breakout or Bearish Collapse? Crucial LevelsYello, Paradisers! Is #VANRYUSDT primed for a bullish breakout or a looming downside? Here's the detailed analysis:
💎#VANRY could set up for a perfect bullish move if it successfully breaks the descending resistance trendline. Currently, the price is expected to test the support zone around $0.082 to $0.078. On the hourly chart, an *Inverse Head and Shoulders (IHNS)* pattern is forming, accompanied by a *three white soldiers* candlestick pattern—both strong bullish indicators. This suggests a high probability of a rebound from support, potentially pushing the price back up to challenge the descending resistance trendline. A successful breakout could lead to a significant move toward the key resistance at $0.113.
💎This $0.113 level is crucial; if VANRY breaks above it, we could see continued upward momentum toward the major resistance zone. However, if the price faces rejection at this key resistance, it could reverse and head downward.
💎The concerning scenario emerges if VANRY fails to rebound from the initial support zone and breaks down further. This could lead to a retest of the major support area. Historically, this zone has held strong, leading to significant rebounds.
💎For the bullish scenario to remain intact, a rebound from this level and a reclaim of the $0.062 support are necessary. If VANRY breaks below the major support with a daily close under it, it would confirm a bearish shift, potentially triggering deeper price declines.
🎖Stay disciplined and patient, Paradisers! Remember, long-term success relies on strategic trades and careful observation of key levels. Trade smart and be ready for the next big move!
MyCryptoParadise
iFeel the success🌴

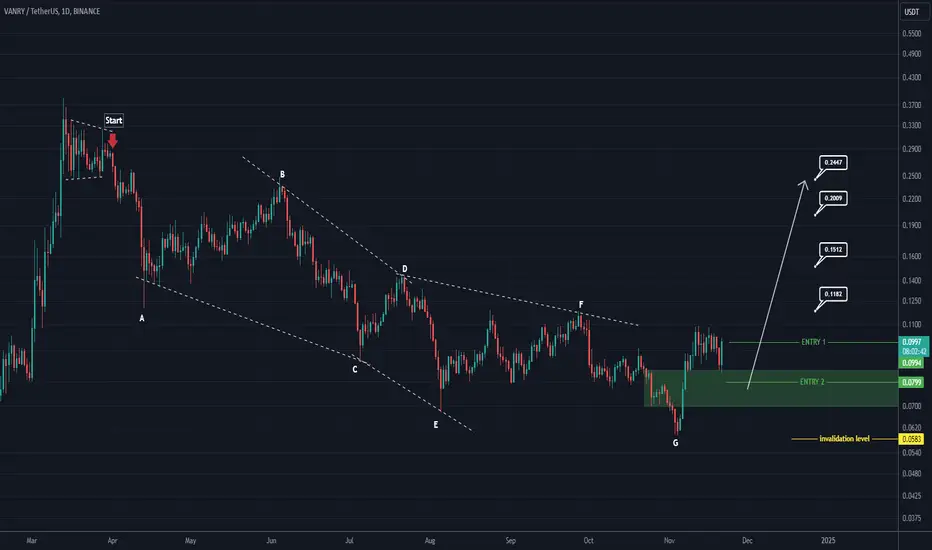
VANRY looks bullish (1D)VANRY correction has started from the place where we have placed the red arrow on the chart.
This correction looks like a diametric as we are now at the end of the G wave.
We have identified two entry points for VANRY.
The targets are also marked on the chart.
Closing a daily candle below the invalidation level will violate this analysis.
For risk management, please don't forget stop loss and capital management
Comment if you have any questions
Thank You