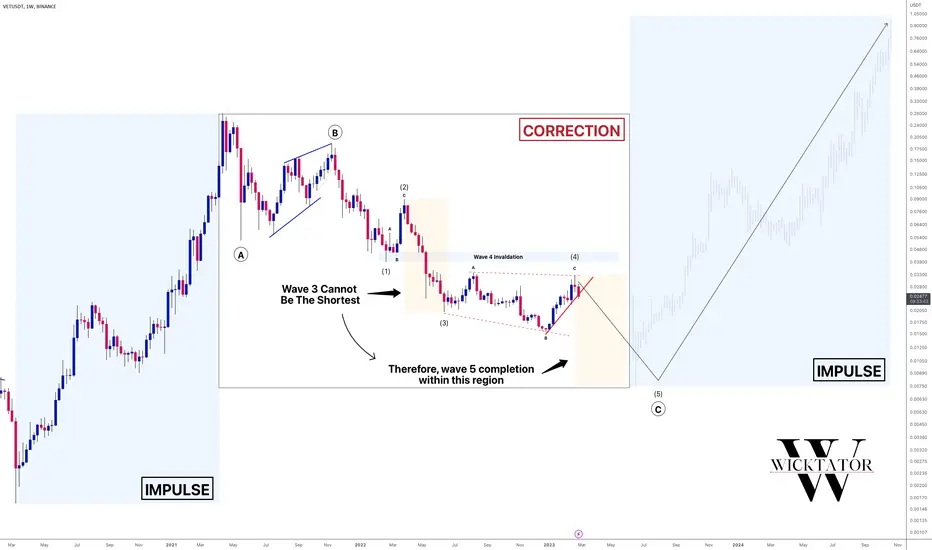
VECHAIN - Important Update!From looking at Vechain on a log chart, we can see that we're still within the ABC correction.
in every ABC correction, C wave is almost always 5 waves, which follows the impulsive schematic.
We are now in wave 5 and we're expecting to see 5 clear waves down.
An important thing to note is that in Elliott waves , wave 3 can never be the shortest. At the moment, wave 1 is longer than wave 3. Therefore it is highly likely that wave 5 will be shorter than wave 3. This gives us a clear zone to look at for LONG orders.
Trade Idea:
- For experienced traders, count 5 waves down for wave 5 and enter on the breakout of the 5th wave
- For less experienced traders, watch for 5 waves down and draw a descending trendline and enter on break of trendline
- Targets: 0.1, 0.23, HODL the rest and manually close
Goodluck and as always, trade safe!
VETUSDT
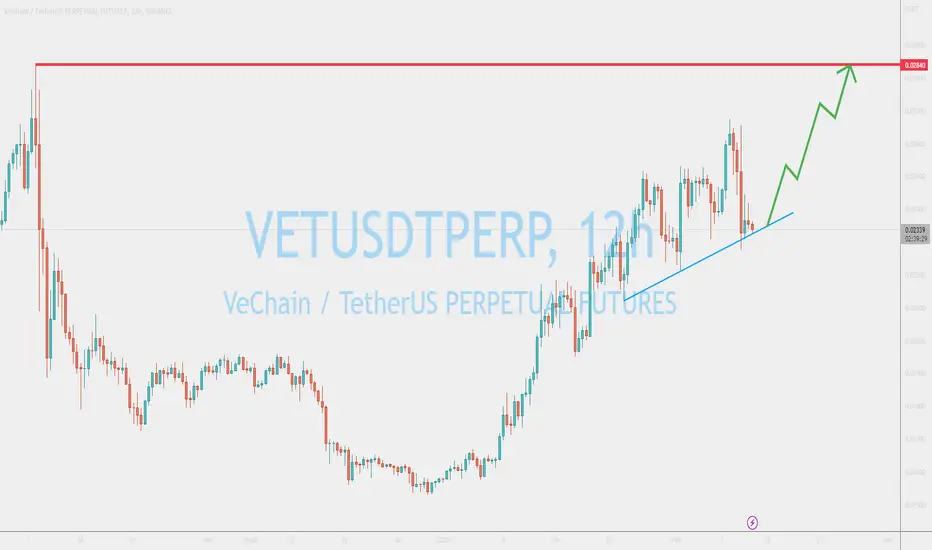
VETUSDT on daily support and may head up for 0.02918VETUSDT is trading inside daily support zone. It is likely that the price will trade higher and aim towards daily resistance. The expected movement has been depicted in three steps L1, S2, L3. The step L3 may go till 0.02918 as depicted on the chart. But this sequence of paths will be followed only if the price does not lose the daily support.

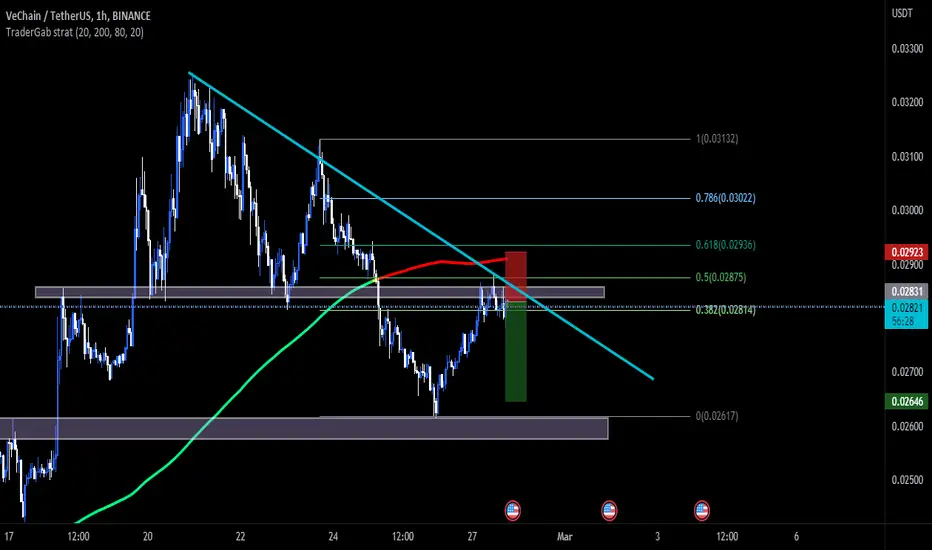
VETUSDT Short TradeConfluence for Short Trade
1. Respected Downward Trend line
2. Below 200EMA
3. At Fibo Golden Zone
4. Candle Rejections
5. Rejected the Level of Resistance
Trade at your own risk my analysis might not work all the time make sure you review also the market and analyze by your self 😊😊
Happy trading trading everyone✨✨
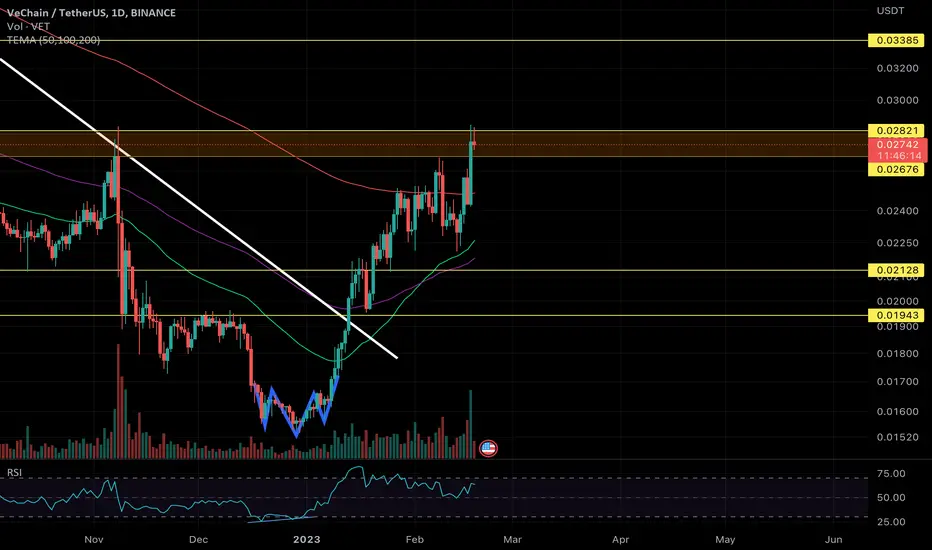
VET is still very bullish!Hey guys, if you followed my previous TA you made a lot of profits. Congrats with that. So whats next for VET?
- VET is still on a higher timeframes in a uptrend. Remember that the trend is your friend.
- We finally managed to break the 200 EMA.
- Plus were moving in my Brown box with decent volume.
- We didnt break out of the Brown box. But eventually we will…
- After that we could move to the next resistance at 0,03385.
Greet times and profit ahead! Leave me a like and follow me to keep updated!
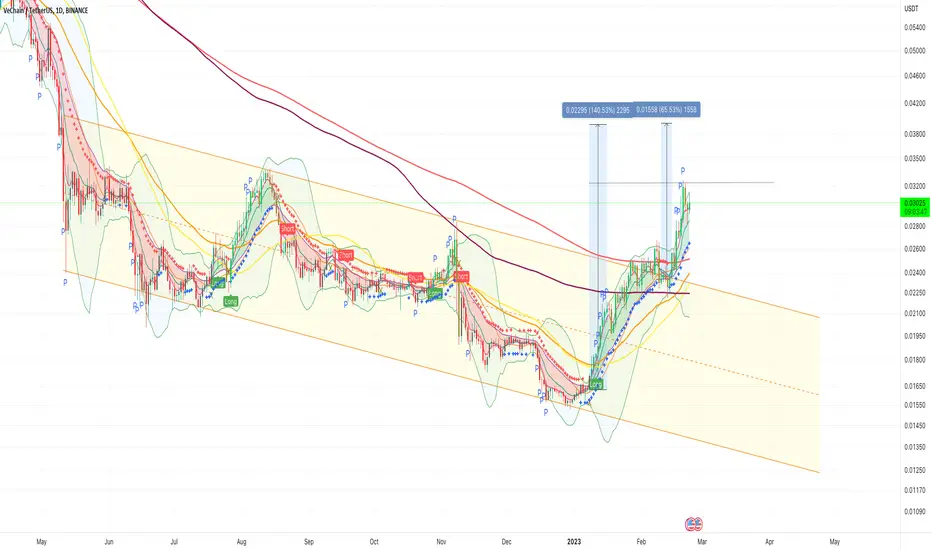
VeChain (VET) - already 97% performance, more to come!#VET / USDT TA Update:-
$VET currently trading at $0.030
Our CTT (Coinlion Trend Trader) Indicator told us to enter VET at $0.01811.
VET broke the descending channel (since may 2022) around $0.02451 and give us then a 65% growth potential.
We still have 23% growth potential.
Our entry point (01/11/2023) : $0.01811
Target point : $0.039 (140% profit)
What do you think ?
Please click LIKE button and Appreciate my work.
Coinlion Trend Trader indicator tells me
- When to enter short or long
- When to exit and take profit :-)
- You can see it in action if you want
If you want it or my SL indicator or My Liquidity Support and Resistance Indicator, let me know.
Thank you.
VET VeChain Crazy Cup & Handle Pattern FractalI think this one's out there but so interesting...
A cup and handle that's proved to have happened inside a much bigger cup & handle that's setting out to happen in the next bull run. Time-wise the PA must reach close to ATH this year and then it's game on.
There's so much going in the chart. The target for the cup & handle falls on the backwards 0.618 fib level, which is one more strong confluence. I could go on about all the confluences but I need the crazy side of me tamed this fine monday morning.
This is not financial advice. I'm a monkey with a TV membership.

VETUSDT rally beginsThis is the time and moment when cryptos are going to get wild, get ready for the ride, VETUSDT looks super bullish!
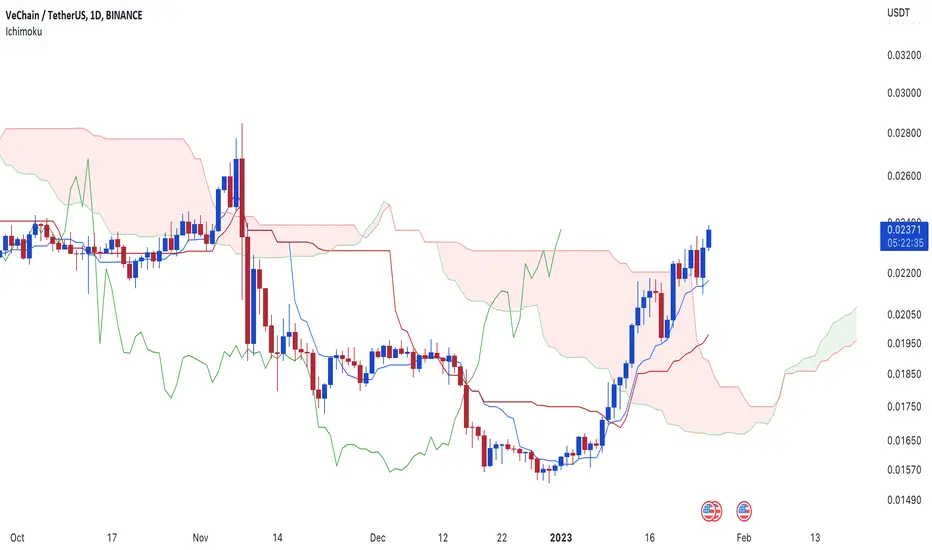
$VET/#USDT [#VeChain]: Resistance_BreakoutHey traders, we've identified a Resistance Breakout on the $VET / $USDT chart. The price has broken above a key resistance level, which can indicate a potential bullish trend. Taking in consideration the next resistance key levels are at 0.02593 | 0.02829 | 0.03221 and the major support zones are respectively at 0.02201 | 0.02045 | 0.01653. It is a bullish indication and we may consider entering at the current price zone at 0.02546 and targetting higher levels.
Technical Metrics :
Current price: 0.02546
24H Volume: 13,255,198.8164 ₮
24H Price change: 8.433%
- Pivot Points - Levels :
Resistance: 0.02593 | 0.02829 | 0.03221
Support: 0.02201 | 0.02045 | 0.01653
Indicators recommandation :
Oscillators: SELL
Moving Averages: STRONG_BUY
Technical Indicators Summary : BUY
- In-depth VETUSDT technical analysis on > Tradingview TA page
What do you think of this analysis? Share your insights and let's discuss in the comments below. Your like, follow and support would be greatly appreciated!
Welcome to the home of charting big: TradingView
Benefit from a ton of financial analysis features, instruments and data. Have a look around, and if you do choose to go with an upgraded plan, you'll get up to $30.
Discover it here
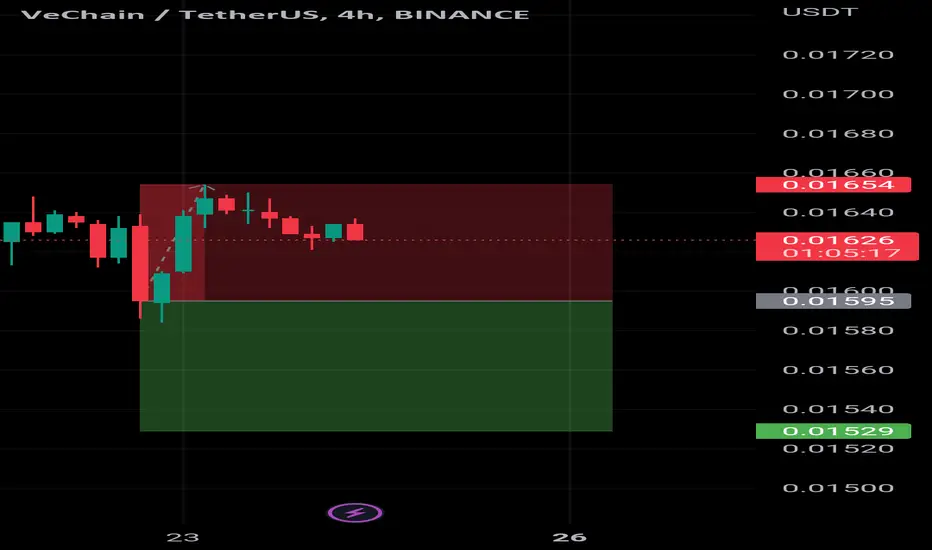
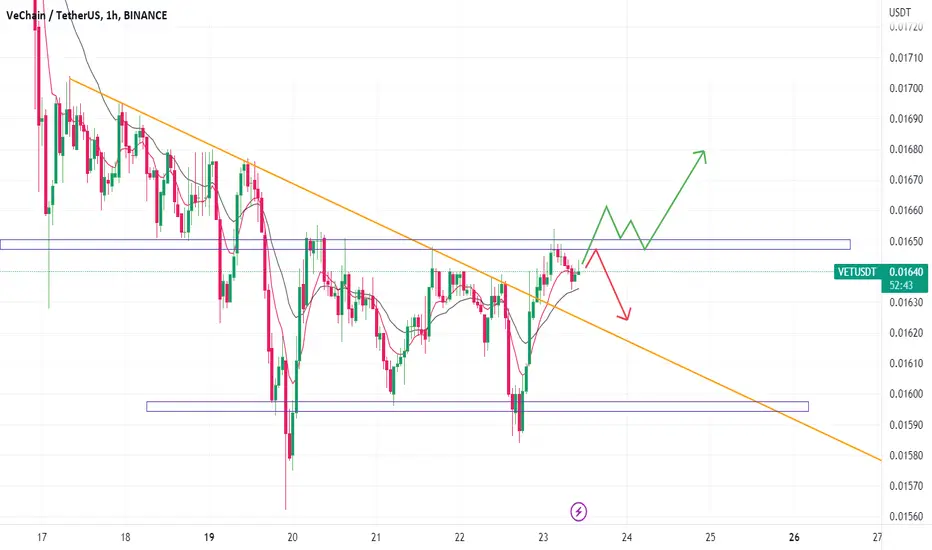
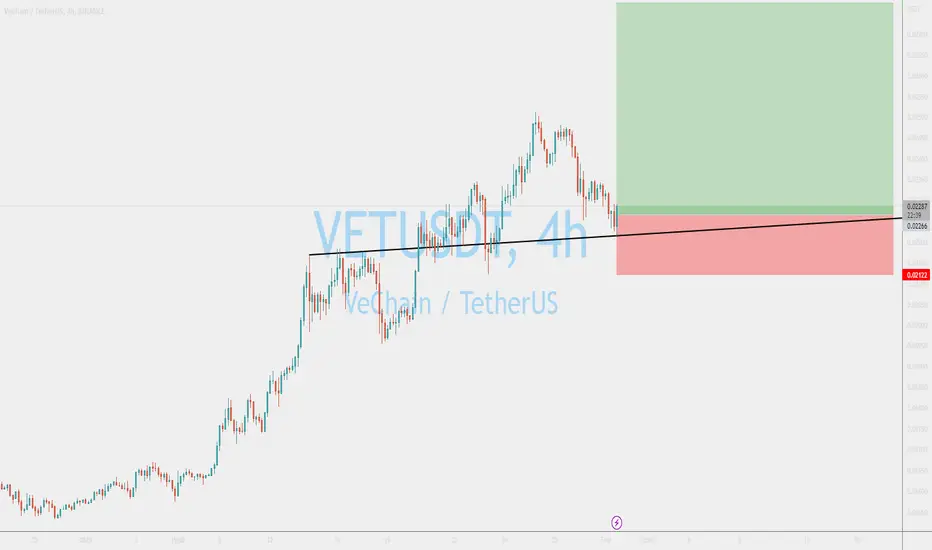
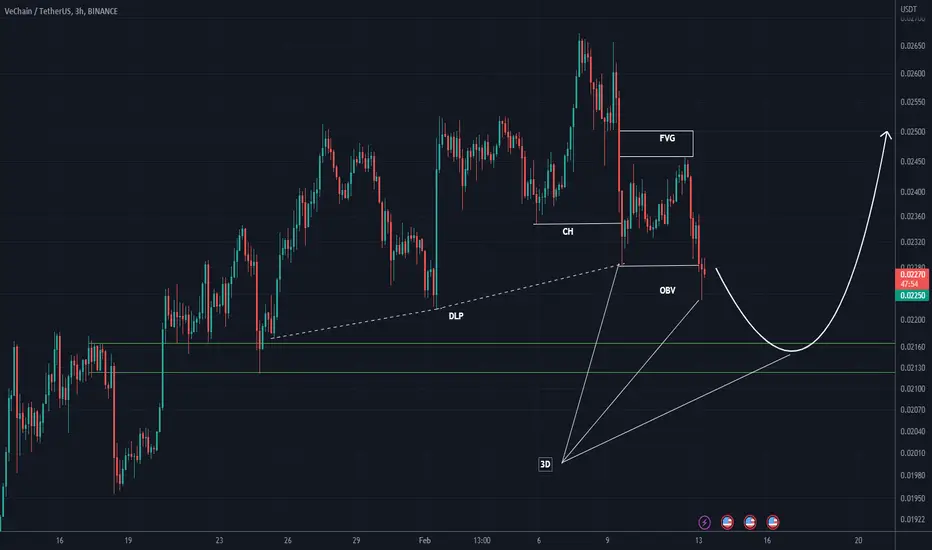
VETUSDT at the supportVETUSDT continues to look bullish and while the price holds the trendline we should see the continuation of the uptrend.
VET LONG SETUPHi, dear traders. how are you ? Today we have a viewpoint to BUY/LONG the VET symbol.
For risk management, please don't forget stop loss and capital management
When we reach the first target, save some profit and then change the stop to entry
Comment if you have any questions
Thank You
Vet $LongAvg: 0.0257
9;29 PM 2/9/23
Purchased above this key resistance turned to support. I could see the continuation of this pattern play out with all the technicals on Bitcoin as well as the price action between the both.
Not the ideal entry I do admit, but we’re only investing what we can afford to lose. Scared money don’t make no money.
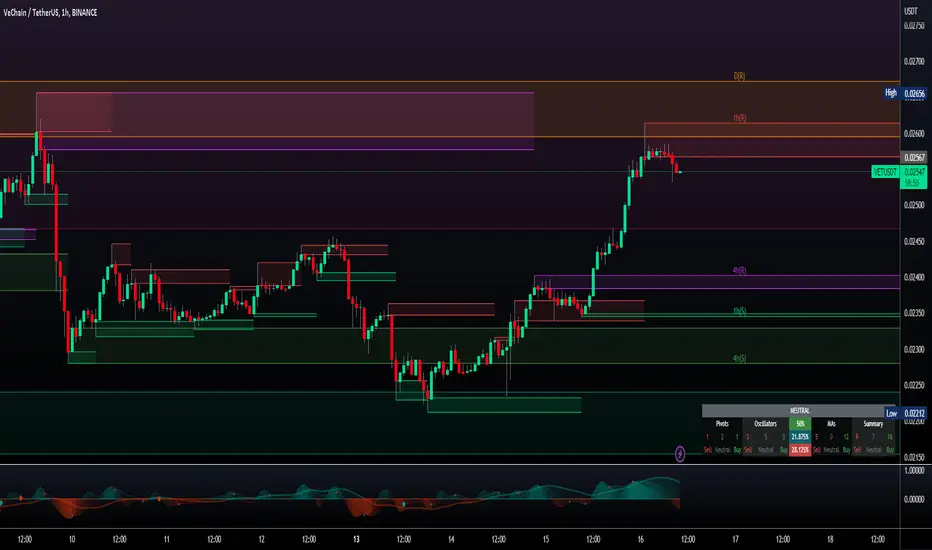
$VET/#USDT [#VeChain]: ResistanceBreakout+ConfirmationWe've detected a Resistance Breakout and Confirmation on the $VET/$USDT chart. The price has broken above a key resistance level and has been confirmed by a strong candle, indicating a potential bullish trend. The next resistance key levels are at 0.02607 | 0.02756 | 0.03147 and the major support zones are respectively at 0.02216 | 0.01974 | 0.01583. We may consider entering a trade at the current price zone at 0.02484 and targetting higher level.
- Technical Metrics Index:
-- Current price: 0.02484
-- 24H Volume: 15,102,230.6324 USDT
-- 24H Price change: 10.449%
- Pivot Points - Levels:
-- Resistance: 0.02607 | 0.02756 | 0.03147
-- Support:0.02216 | 0.01974 | 0.01583
- Indicators recommandations:
-- Oscillators: NEUTRAL
-- Moving Averages: STRONG_BUY
-- Summary: BUY

I'm Bearish in short termVeChain has pumped well this month. I think there may be a bearish wave in february.

Confirmation Breakout!! 🚀Vechain has finally made a breakthrough out of all ranges.. expect some big things in price action 🎬

it all comes down to this.....Its been nearly a year of solid down trend and we have a breakout with a significant buy signal.... let's see what happens!!
Want the indicator? DM ME! :D
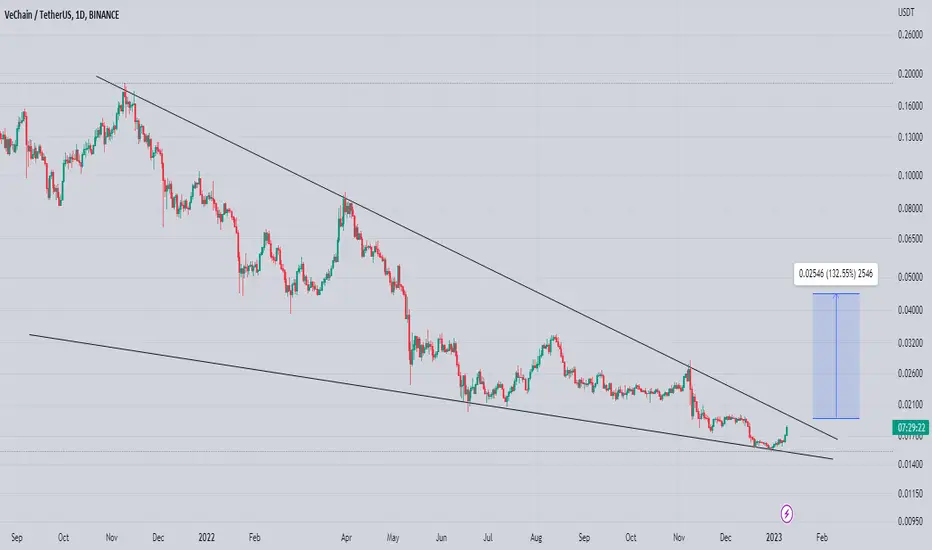
Vetusdt Formed Falling Wedge In Daily Timeframe
Incase Of Breakout Expecting 200 to 220% Bulish Move
Entry Would Be Only Valid After Breakout (Keep In mind Vet will Remain Bearish Until Its Breaks Falling Wedge)
Safe Stoploss Area Would Be Below Falling Wedge
Vechain | Breaking out of Falling Wedge..!!
VeChain is Breaking out of Falling Wedge in HTF Chart.
Seems like Correction phase almost Done & Ready for Bounce Back..📈
I have Already Bought a Heavy Bag of $VET for the Midterm..
Expecting 3x Bullish Rally Soon.
Patience is KEY and will be Rewarded. ✍️
Please like the idea for Support & Subscribe for More ideas like this and share your ideas and charts in Comments Section..!!
Thanks for Your Love & Support..!!

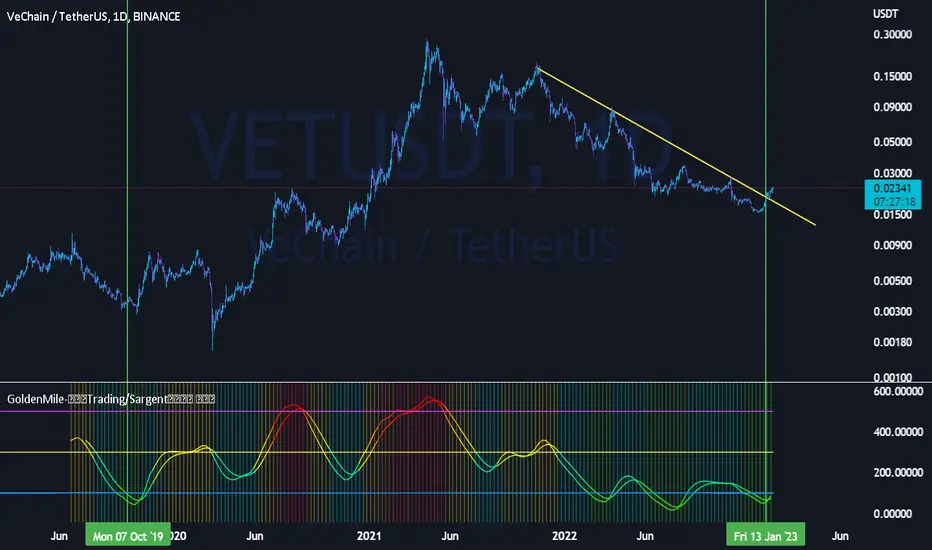
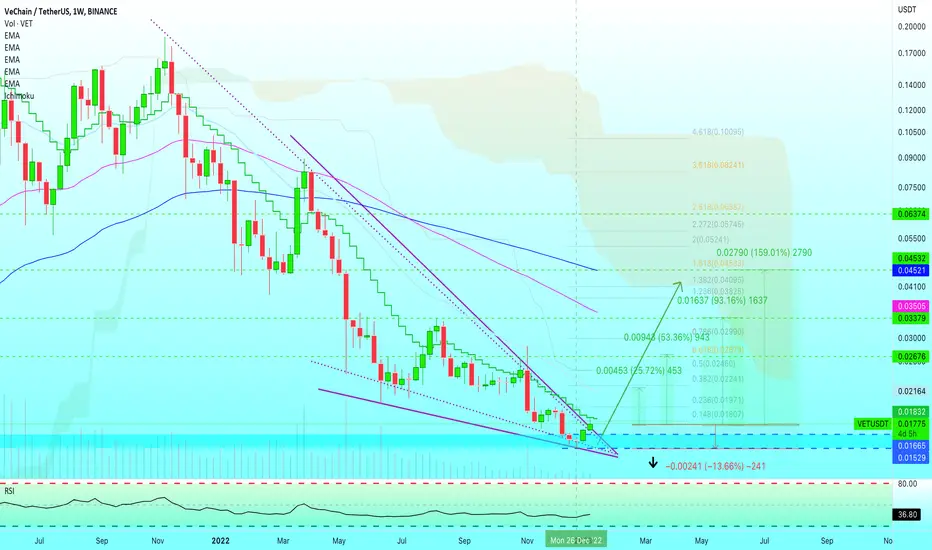
✴️ VeChain Falling Wedge Opens 159% Potential Mid-TermThere are so many reversal signals here that it is hard to choose where to start...
Ok. Late December VeChain (VETUSDT) printed a DragonFly Doji candlestick.
This is the one with a small real body and a long lower wick/shadow.
When this candle shows up at new lows/support, it can be read as a strong reversal signal.
The fact that it is followed by a full green candle the next week, gives confirmation.
This current week also starting green gives additional strength.
This is a strong bullish reversal bias based on candlestick reading from the last three weekly candle.
The RSI hit a low and is now curving upwards.
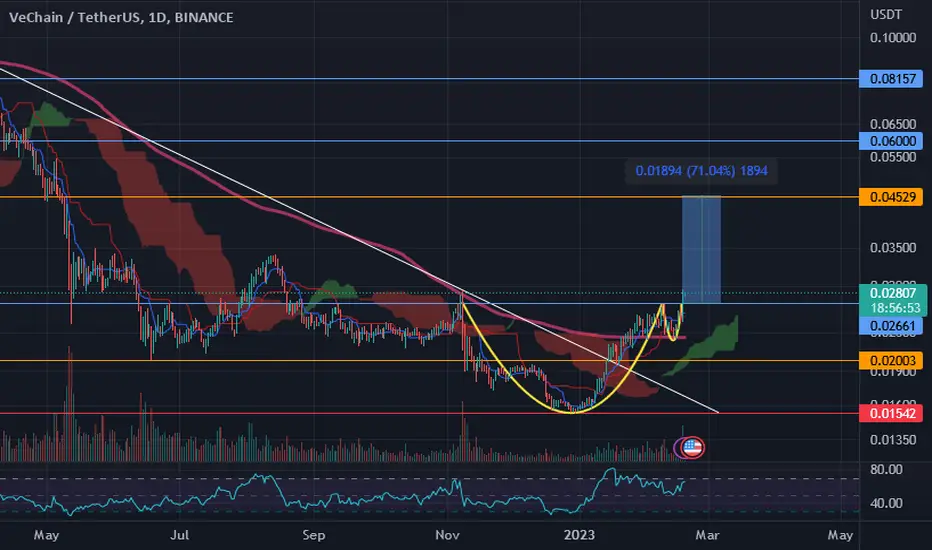
We have very big falling wedge pattern breaking bullish.
The Red Ichimoku cloud is on top and prices are normally attracted to this cloud.
After years of bearish action, the resistance levels turned support need to be tested and thus we come to the following conclusion:
VeChain is set to move up.
First stop/target will be EMA21 or 0.382 Fib. extension at 0.02150-0.02240 for 25%.
Second stop/target for 53% will be 0.02679.
Third target almost reaching EMA50 at 0.03333 for a nice, ~90%.
Fourth and last target is the 1.618 Fib. extension level matching the weekly EMA100 blue line or 0.04530 for a great 159%.
That's the potential, now the risk.
The stop-loss can be used as a manual stop-loss, our preferred method, when an entire session closes below 0.01500. If this criteria takes place a buy can be closed.
Very low risk...
High potential for rewards.
Namaste.
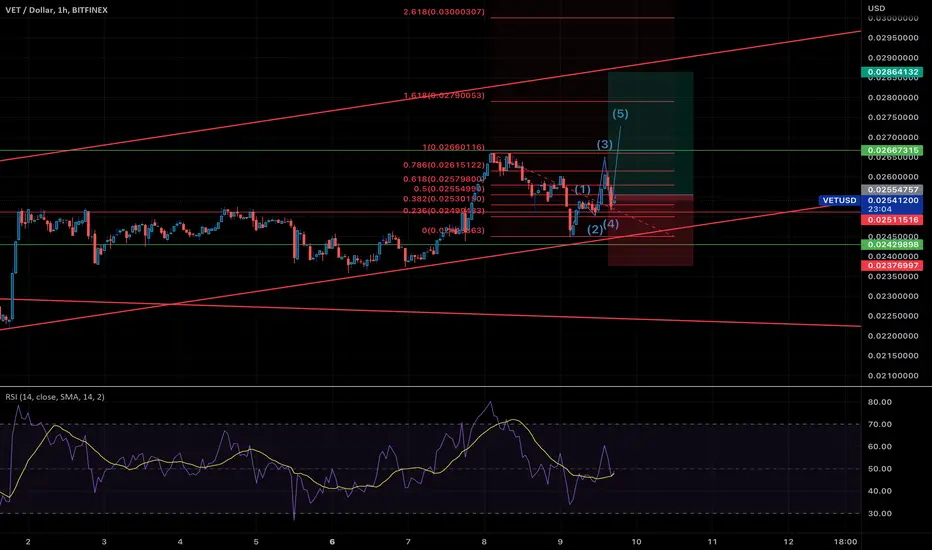
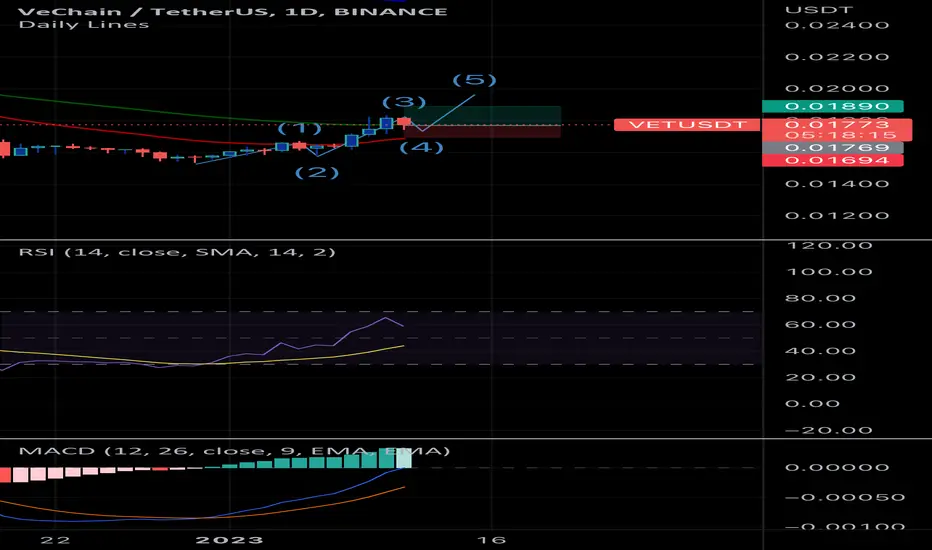
1-5 potential Potential 1-5 Elliot wave theory is playing out. Confirmation is the retest of previous support into resistance on wave 4 into 5.
Sell Trade Set Up on VETUSDTVet will go down to as mentioned target . Use Leverage X3 as maximum with strict stoploss . This is not the financial advice.