VET/USDT – Golden Pocket Retest After Breakout!🧠 Overview: Is VeChain About to Flip Bullish?
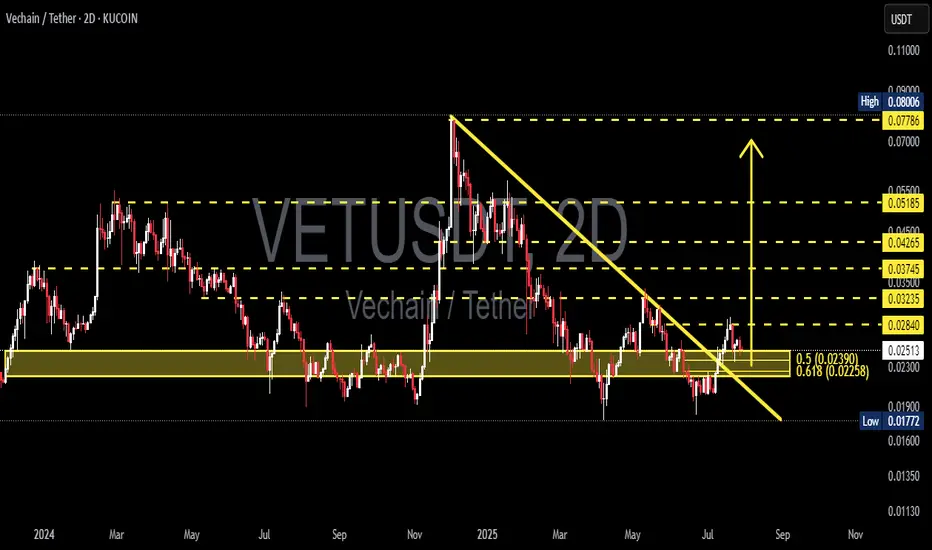
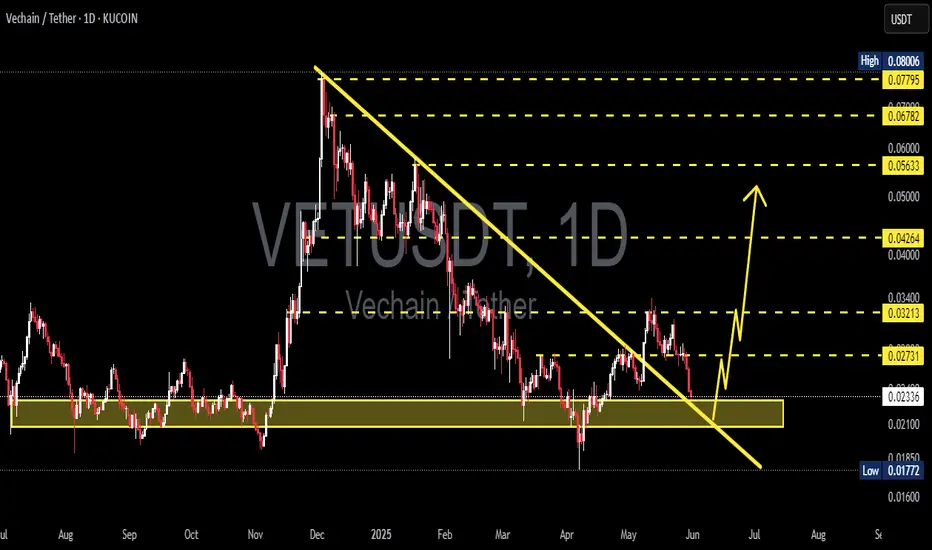
The 2D VET/USDT chart (KuCoin) is presenting a high-potential setup. After months of downward pressure, VET has finally broken above a long-standing descending trendline, which has been intact since early 2025.
Now, price is retesting a major support zone—which also happens to be the Golden Pocket of the Fibonacci retracement (0.5–0.618). This area is crucial for confirming whether this is a real trend reversal or just another fakeout.
---
🧩 Technical Structure & Key Levels
📍 Descending Trendline (Broken)
A clear breakout from the downtrend that started in February 2025.
First signal of a potential trend reversal.
📍 Critical Support Zone – Golden Pocket
Range: 0.02258 – 0.02390 USDT
Aligns with Fibonacci 0.5–0.618 retracement from recent swing low to high.
Acts as a historically strong horizontal support — now being retested after the breakout.
📍 Fibonacci Resistance Levels (Upside Targets)
Level Price (USDT)
Resistance 1 0.02840
Resistance 2 0.03235
Resistance 3 0.03745
Resistance 4 0.04265
Resistance 5 0.05185
Extended High 0.07786 – 0.08006
📍 Major Support (Last Line of Defense)
0.01772 USDT, the lowest level seen since late 2023.
---
✅ Bullish Scenario – Valid Retest & Reversal
If the Golden Pocket zone holds, we could see:
Continuation of bullish momentum
Gradual move toward:
🎯 0.02840 as the first resistance
🎯 0.03235 – 0.03745 as mid-term targets
🎯 0.04265 – 0.05185 if momentum strengthens
Potential formation of an Inverse Head & Shoulders pattern, signaling a strong reversal base
---
❌ Bearish Scenario – Failed Retest
If price fails to hold the 0.02258–0.02390 support zone:
We may see a move back down toward 0.01772 USDT
This would invalidate the bullish breakout (false breakout scenario)
The longer-term downtrend could resume
> ⚠️ Beware of a potential bull trap around 0.025–0.026 — price rejection here could signal a failed breakout.
---
🧠 Current Price Action Pattern
✅ Descending Trendline Breakout → early bullish signal
🔁 Golden Pocket Retest → now in progress, critical for direction confirmation
📈 Reversal Potential → watching for Inverse Head & Shoulders formation
---
💡 Conclusion
VET/USDT is at a make-or-break level. The breakout above the descending trendline is promising, but the current retest of the Golden Pocket zone is the real test for bulls. If this level holds, we could be witnessing the early stages of a trend reversal with multiple upside targets in play.
#VETUSDT #VeChain #CryptoBreakout #FibonacciLevels #GoldenPocket #AltcoinAnalysis #InverseHeadAndShoulders #TrendReversal #CryptoTechnicalAnalysis #SupportResistance #CryptoSignals
Vetusdtidea
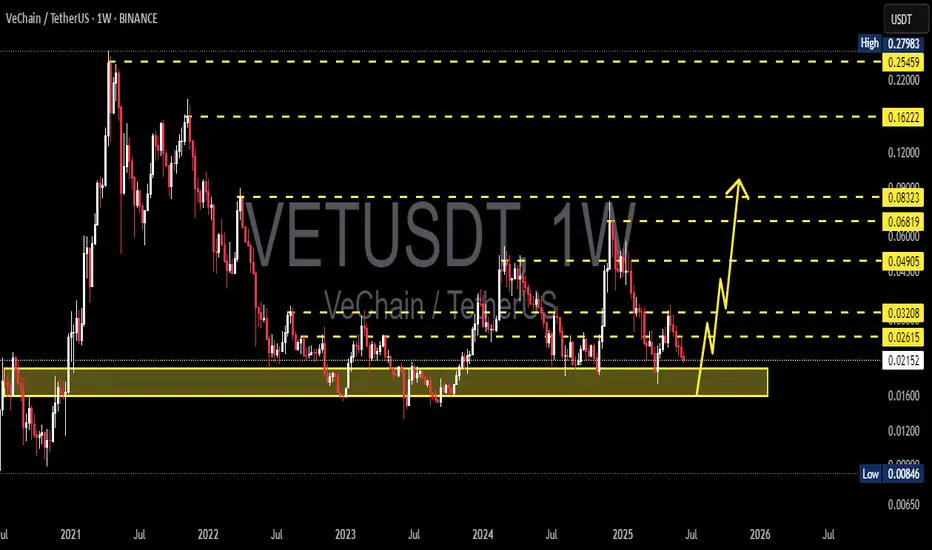
VETUSDT 1W AnalysisVET ~ 1W Analysis
#VET Buy back gradually from here if you still have confidence in this coin with a short term target of at least 20%+ from here.
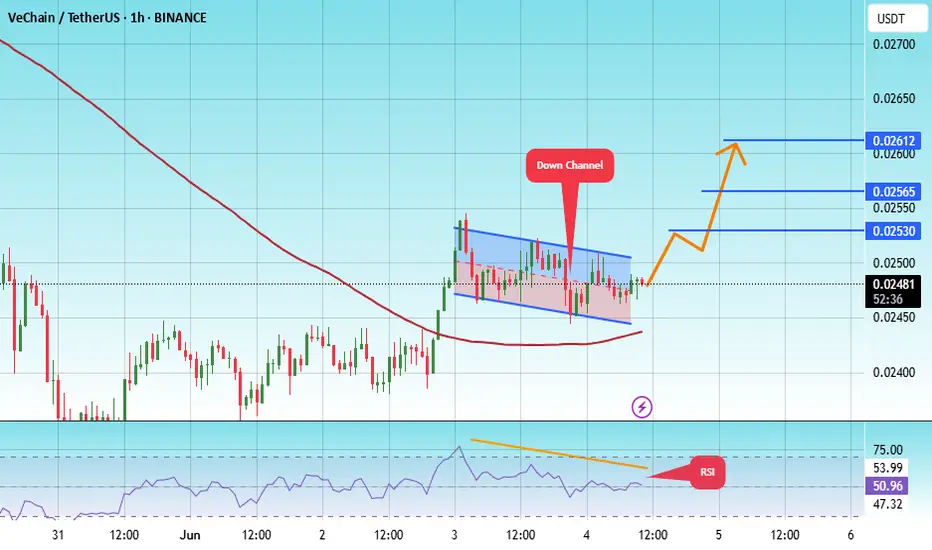
#VET/USDT#VET
The price is moving within a descending channel on the 1-hour frame, adhering well to it, and is heading towards a strong breakout and retest.
We are experiencing a rebound from the lower boundary of the descending channel. This support is at 0.02456.
We are experiencing a downtrend on the RSI indicator, which is about to break and retest, supporting the upward trend.
We are heading towards stability above the 100 Moving Average.
Entry price: 0.02480
First target: 0.02530
Second target: 0.02565
Third target: 0.02612
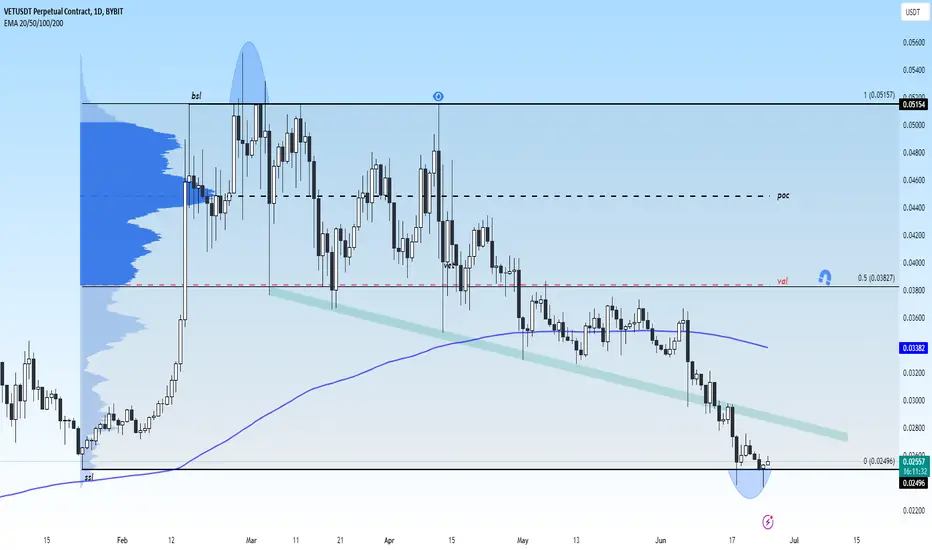
VETUSDT 1D Analysis VET ~ 1D Analysis
#VET This support block might be something you can start considering to start buying back from here with a short-term target of at least 10%++
VETUSDT 1D AnalysisVET ~ 1D Analysis
#VET Buy after successfully penetrating this resistant line with a short -term target of at least 10%+ from here.

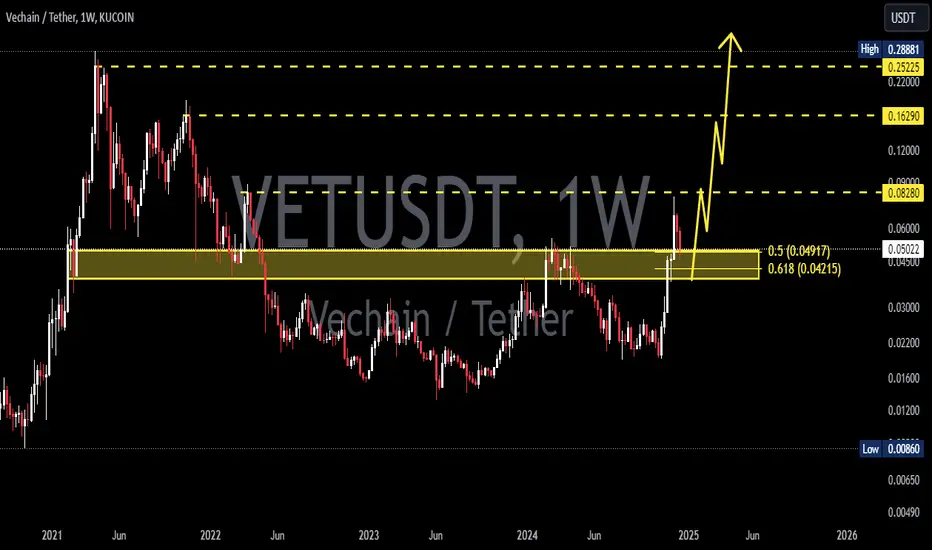
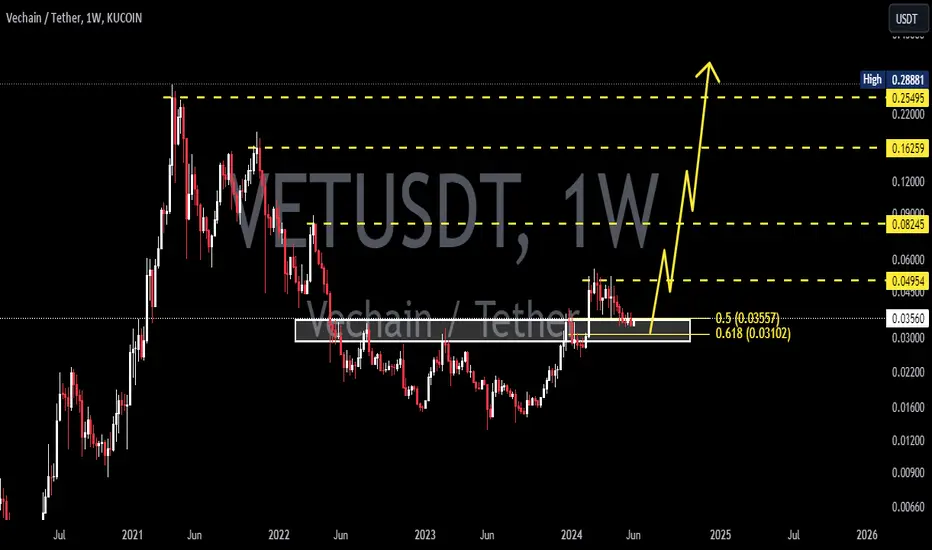
VETUSDT 1WVET ~ 1W Analysis
#VET Buy gradually from here if you still have a Conviction on this coin with a short -term target of at least 20%+.
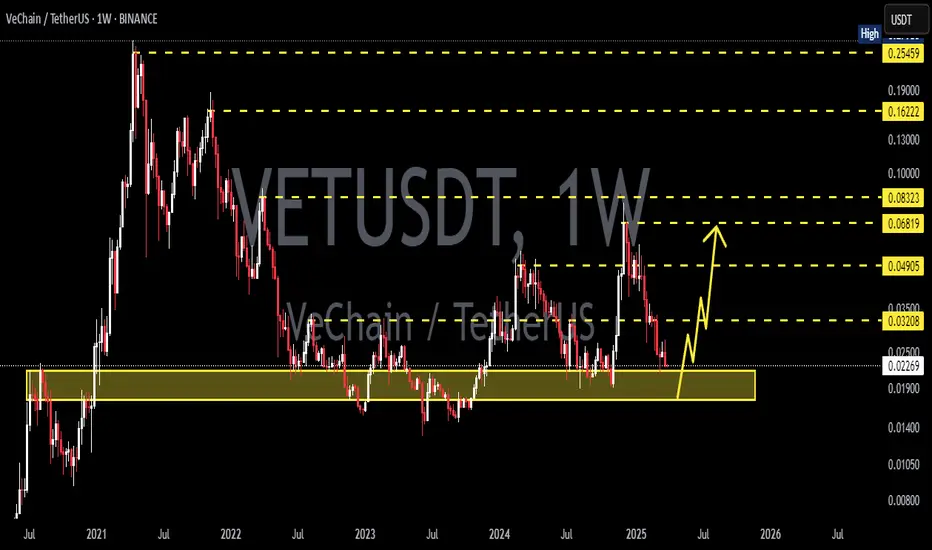
VETUSDT 1WVET ~ 1W Analysis
#VET Buy gradually from here if you still have a Conviction on this coin with a short -term target of at least 20%+.
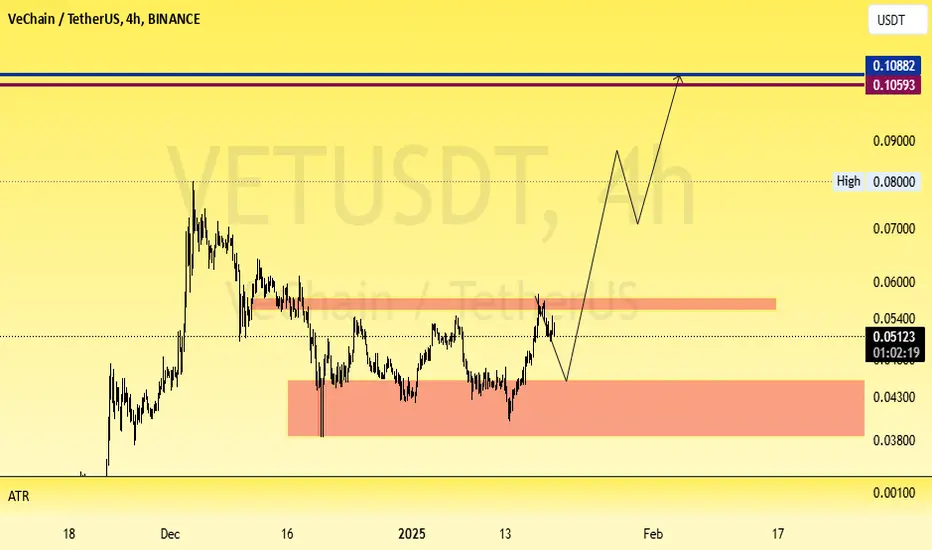
VETUSDT Wave AnalysisHello Friendes. According the chart of VETUSDT I expected to this movement and 0.105$ . This Way possible by cottrction but see that price.
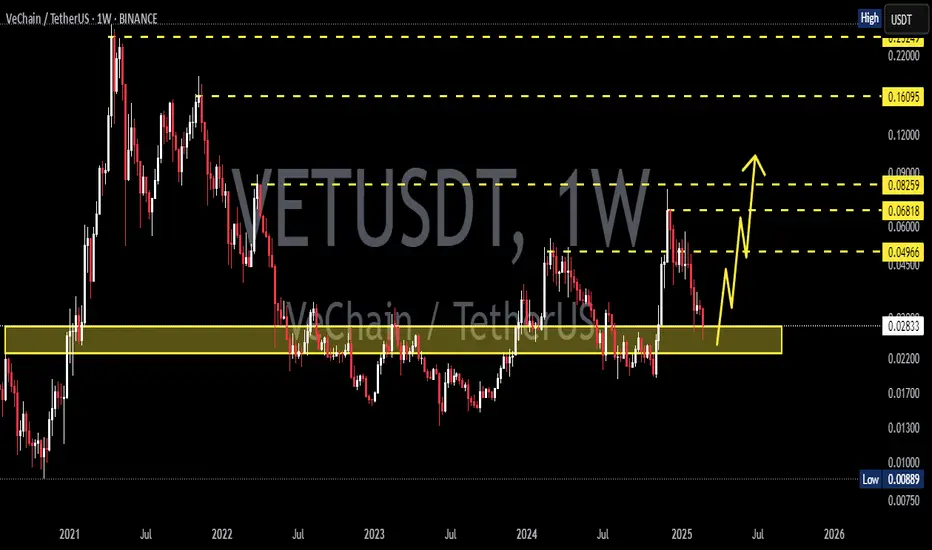
VETUSDT 1WVET Update ~ 1W
#VET If you still have Conviction on this coin,. Buy gradually within this support block,. This coin is still in a very bullish trend.
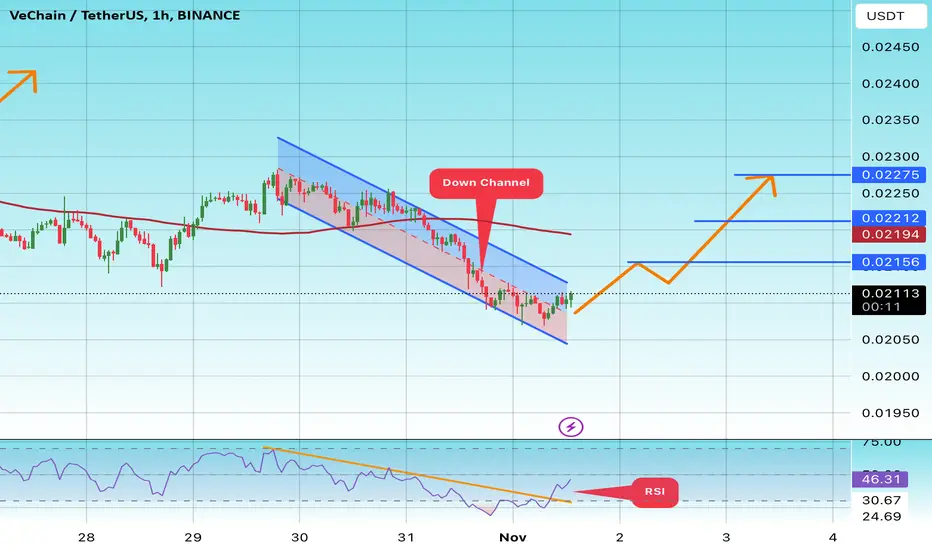
#VET/USDT#VET
The price is moving in a descending channel on the 1-hour frame upwards and is expected to continue
We have a trend to stabilize above the moving average 100 again
We have a downtrend on the RSI indicator that supports the rise by breaking it upwards
We have a support area at the lower limit of the channel at a price of 0.02070
Entry price 0.02110
First target 0.02156
Second target 0.02212
Third target 0.02275
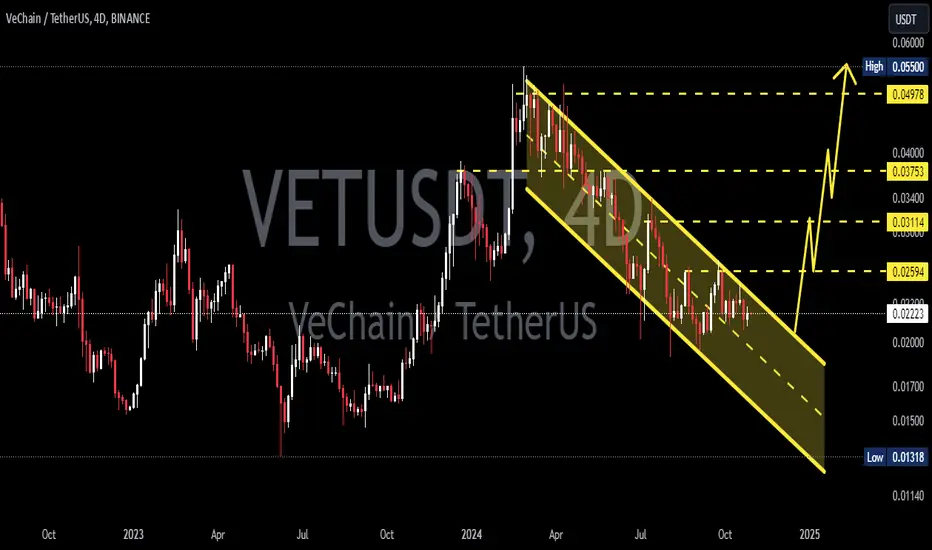
VETUSDTVET ~ 4D
#VET If you still have Conviction on this coin,. Wait for this descending pattern to be successfully broken out and start buying gradually afterward. Target 20%++
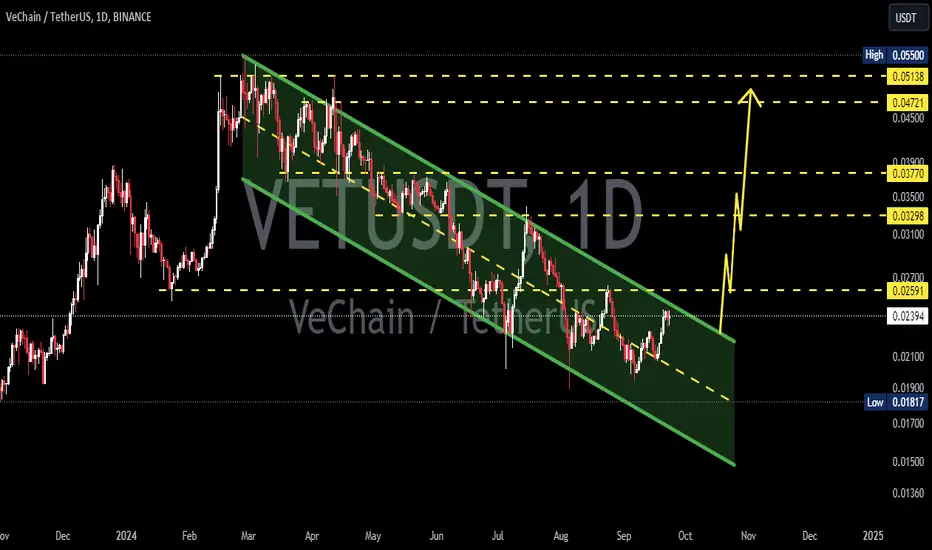
VETUSDTVET ~ 1D ✅
In 1D Time Frame,. #VET Moves in this descending pattern. The best way for now. Make purchases gradually after successfully breaking through the resistance line of this descending pattern.
VET longVET looks good to long...
Let's wait for retest of BTC and market for a better entry...
No hurry... Respect the risk...
VETUSD 1WNYSE:VET ~ 1W
#VET Make purchases gradually on this support block. with a minimum target of 20%++
Big movement incoming for VET!!!VECHAIN Nice Buy zone
First target TP 0.03800 BINANCE:VETUSDT.P
Prive DM more targets

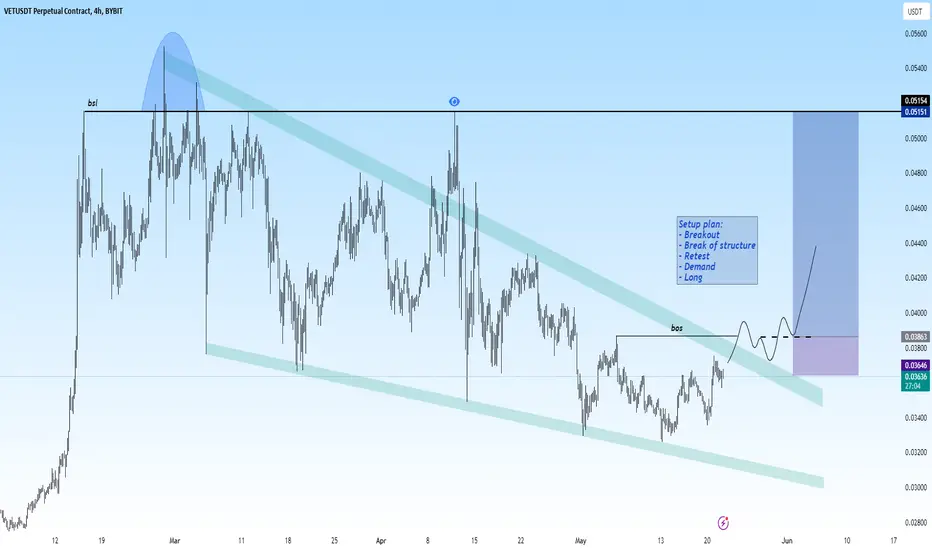
VET long setupNYSE:VET trade setup...
Wait for:
➡️ BOS
➡️ Break out
➡️ Retest
➡️ Demand
#trading #VeChain
@vechainofficial
VeChain to much higherVeChain is setting up potential long term trade similar to the trades we took in SOL, AVAX, WOO, Theta etc.
I will be accumulating during pull backs to my buy zone of 0.03910 to 0.04010.
VeChain is setting up multi time frame squeezes and I'm expecting explosive moves to much higher prices. This is a weekly chart so this move will take some time to play out.
My price targets for VET is as follows:
PT1: 0.06480
PT2: 0.09226
PT3: 0.1069
PT4: 0.1490

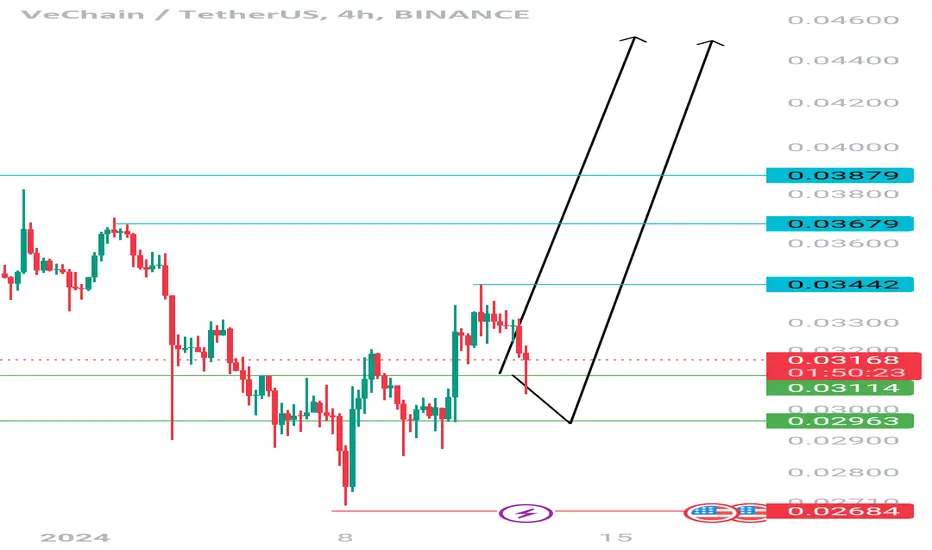
🐮💹🚀 Vet/Usdt Trading Idea 🚀💹🐮
Vet/Usdt is currently showing bullish signs 📈. The market structure has turned into a bullish pattern, and the price is retracing to test a new demand area 🔄. This could signify a potential upward movement. I anticipate a rise in price from this point, potentially ranging between 15-30% 📈🔥.
Remember, this analysis is not financial advice ❌📉. Always conduct your own research (DYOR) and make informed decisions. Happy trading! 💪💰📊
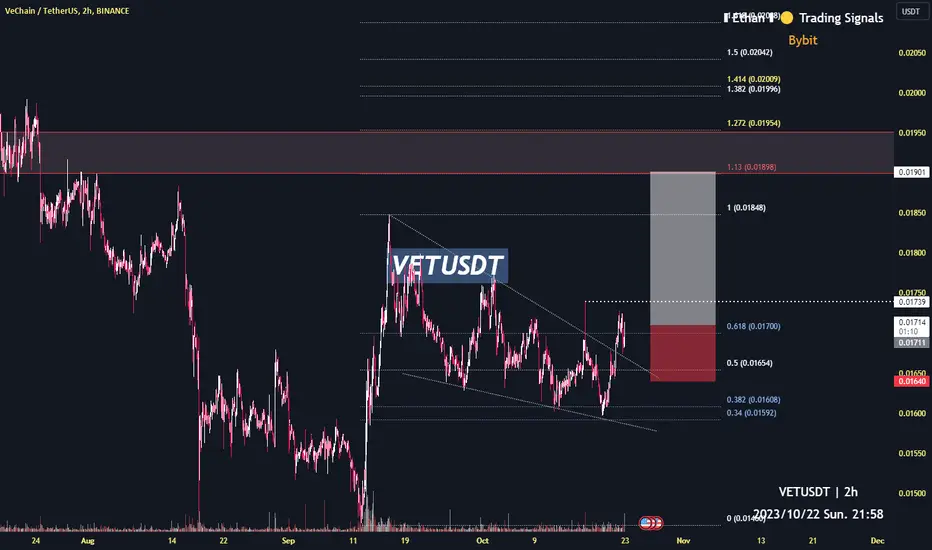
VET target 0.192h time frame
-
VET broke and retested the falling wedge structure, it also got support at 0.618 Fibonacci Retracement, which is good to accumulate momentum. Last step VET need to maintain pumping momentum is to go above 0.0174. With breaking above previous high, this wedge could be regarded as continuation structure, and targets as below.
TP: 0.019~0.0195 / 0.0198
SL: 0.0164
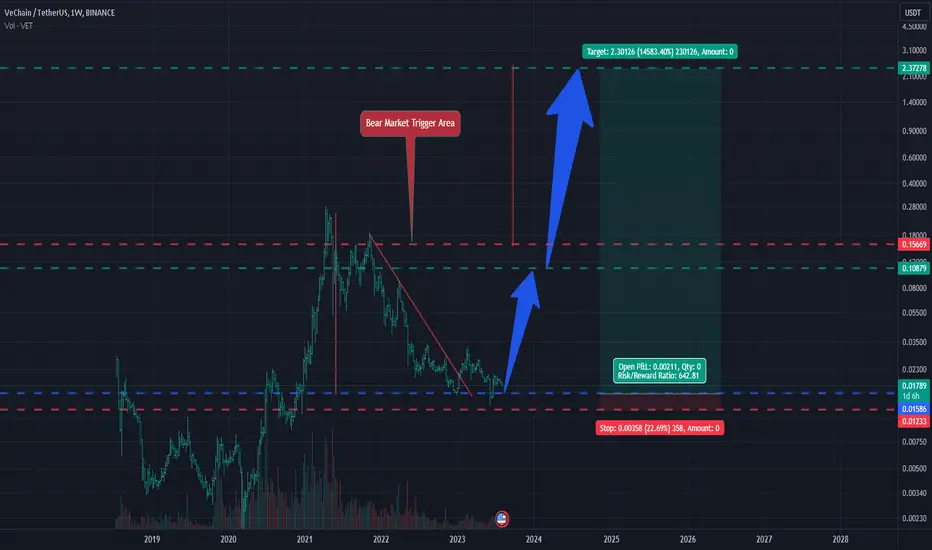
VET and the Impressive 640 risk to reward opportunity Hi Everyone;
today we have one of the best risk to reward Investment opportunity
it is more than 640 times the risk and the chart is look very promising.
I expect breaking the previous bear market key point will clear the way to the final target
VETUSDT on daily support and may head up for 0.02918VETUSDT is trading inside daily support zone. It is likely that the price will trade higher and aim towards daily resistance. The expected movement has been depicted in three steps L1, S2, L3. The step L3 may go till 0.02918 as depicted on the chart. But this sequence of paths will be followed only if the price does not lose the daily support.

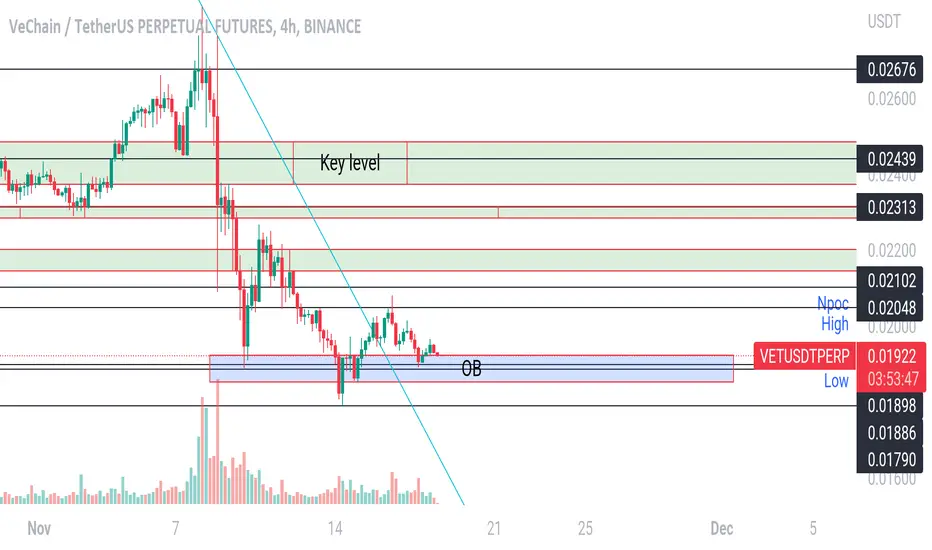
VetusdtVetusdt
Broken hourly channel resistance
Npoc marked if rejected will go back for retest if flipped can test key levels
Ob is order block possible area to retest and gain bullish momentum
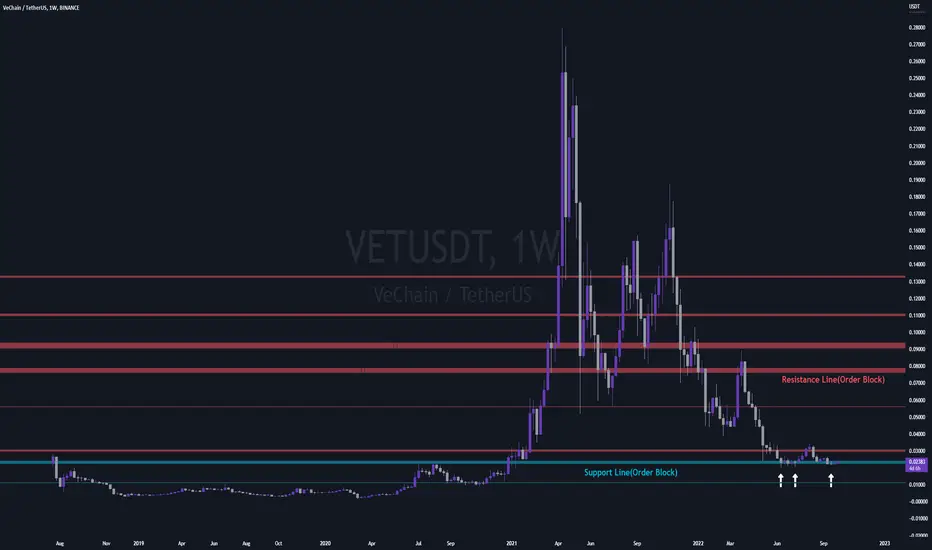
VETUSDT 1W LONG ANALYSISHi, friends. Nice to meet you
The chart we're going to analyze is the VETUSDT PERP chart
We're right above the very important support order block right now, and we've gathered all our strength to climb, so we're judging that it's going to go up
Please refer to your friends and have a good TRADING