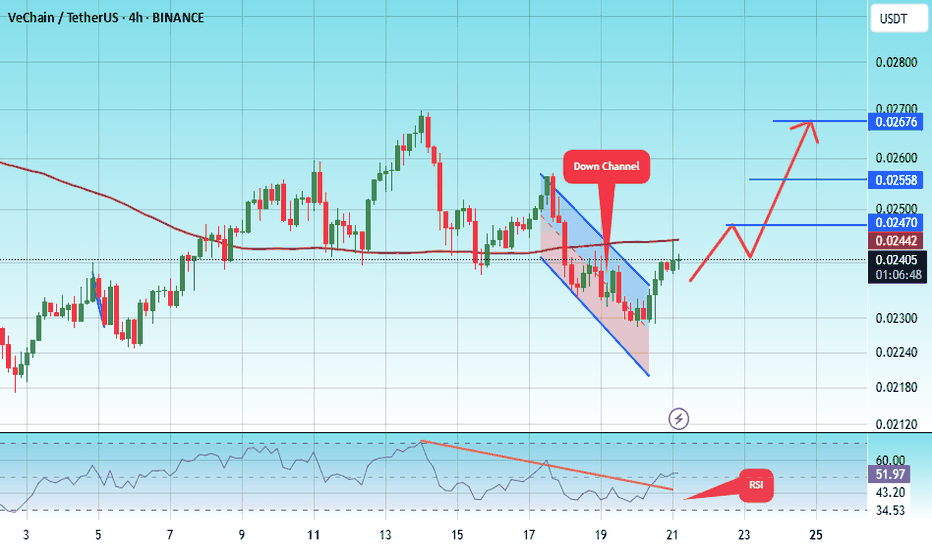
#VET Traders watch VeChain 20% upside targeting 0.02676 soon#VET
The price is moving in an ascending channel on the 1-hour frame, adhering well to it, and is heading for a strong breakout and retest.
0.02228
We have a bearish trend on the RSI indicator that is about to be broken and retested, supporting the upside.
There is a major support area in green at 0.02205, which represents a strong basis for the upside.
Don't forget a simple thing: ease and capital.
When you reach the first target, save some money and then change your stop-loss order to an entry order.
For inquiries, please leave a comment.
We have a trend to hold above the 100 Moving Average.
Entry price: 0.02406
First target: 0.02470
Second target: 0.02558
Third target: 0.02676
Don't forget a simple thing: ease and capital.
When you reach the first target, save some money and then change your stop-loss order to an entry order.
For inquiries, please leave a comment.
Thank you.
VETUSDTPERP
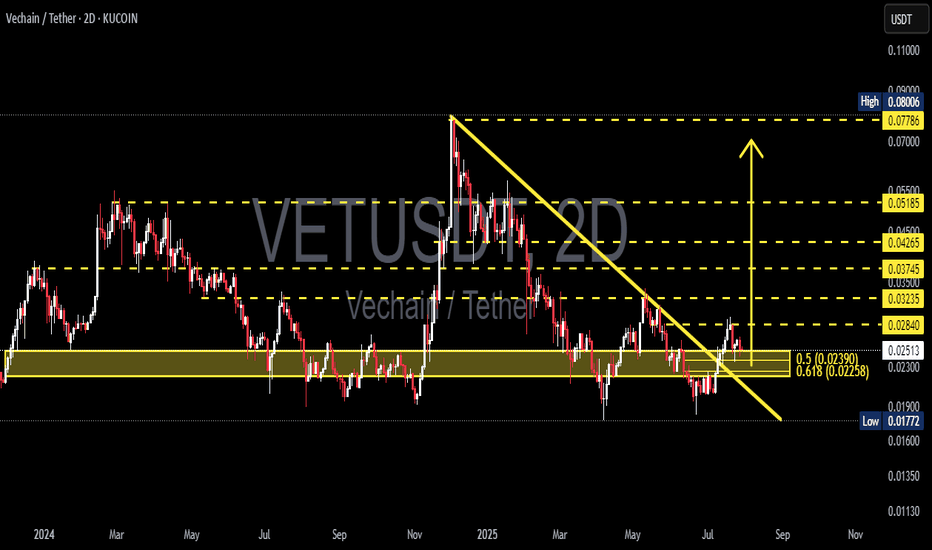
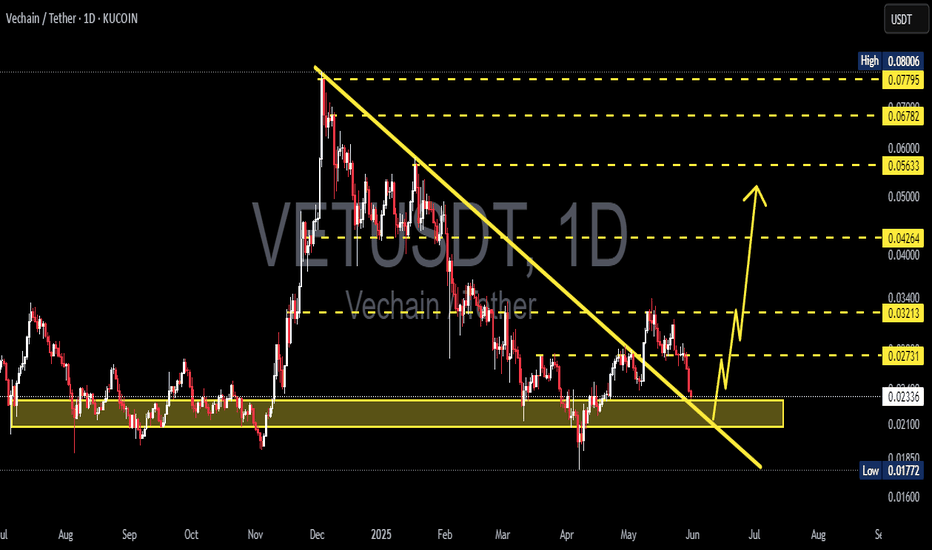
VET/USDT – Golden Pocket Retest After Breakout!🧠 Overview: Is VeChain About to Flip Bullish?
The 2D VET/USDT chart (KuCoin) is presenting a high-potential setup. After months of downward pressure, VET has finally broken above a long-standing descending trendline, which has been intact since early 2025.
Now, price is retesting a major support zone—which also happens to be the Golden Pocket of the Fibonacci retracement (0.5–0.618). This area is crucial for confirming whether this is a real trend reversal or just another fakeout.
---
🧩 Technical Structure & Key Levels
📍 Descending Trendline (Broken)
A clear breakout from the downtrend that started in February 2025.
First signal of a potential trend reversal.
📍 Critical Support Zone – Golden Pocket
Range: 0.02258 – 0.02390 USDT
Aligns with Fibonacci 0.5–0.618 retracement from recent swing low to high.
Acts as a historically strong horizontal support — now being retested after the breakout.
📍 Fibonacci Resistance Levels (Upside Targets)
Level Price (USDT)
Resistance 1 0.02840
Resistance 2 0.03235
Resistance 3 0.03745
Resistance 4 0.04265
Resistance 5 0.05185
Extended High 0.07786 – 0.08006
📍 Major Support (Last Line of Defense)
0.01772 USDT, the lowest level seen since late 2023.
---
✅ Bullish Scenario – Valid Retest & Reversal
If the Golden Pocket zone holds, we could see:
Continuation of bullish momentum
Gradual move toward:
🎯 0.02840 as the first resistance
🎯 0.03235 – 0.03745 as mid-term targets
🎯 0.04265 – 0.05185 if momentum strengthens
Potential formation of an Inverse Head & Shoulders pattern, signaling a strong reversal base
---
❌ Bearish Scenario – Failed Retest
If price fails to hold the 0.02258–0.02390 support zone:
We may see a move back down toward 0.01772 USDT
This would invalidate the bullish breakout (false breakout scenario)
The longer-term downtrend could resume
> ⚠️ Beware of a potential bull trap around 0.025–0.026 — price rejection here could signal a failed breakout.
---
🧠 Current Price Action Pattern
✅ Descending Trendline Breakout → early bullish signal
🔁 Golden Pocket Retest → now in progress, critical for direction confirmation
📈 Reversal Potential → watching for Inverse Head & Shoulders formation
---
💡 Conclusion
VET/USDT is at a make-or-break level. The breakout above the descending trendline is promising, but the current retest of the Golden Pocket zone is the real test for bulls. If this level holds, we could be witnessing the early stages of a trend reversal with multiple upside targets in play.
#VETUSDT #VeChain #CryptoBreakout #FibonacciLevels #GoldenPocket #AltcoinAnalysis #InverseHeadAndShoulders #TrendReversal #CryptoTechnicalAnalysis #SupportResistance #CryptoSignals
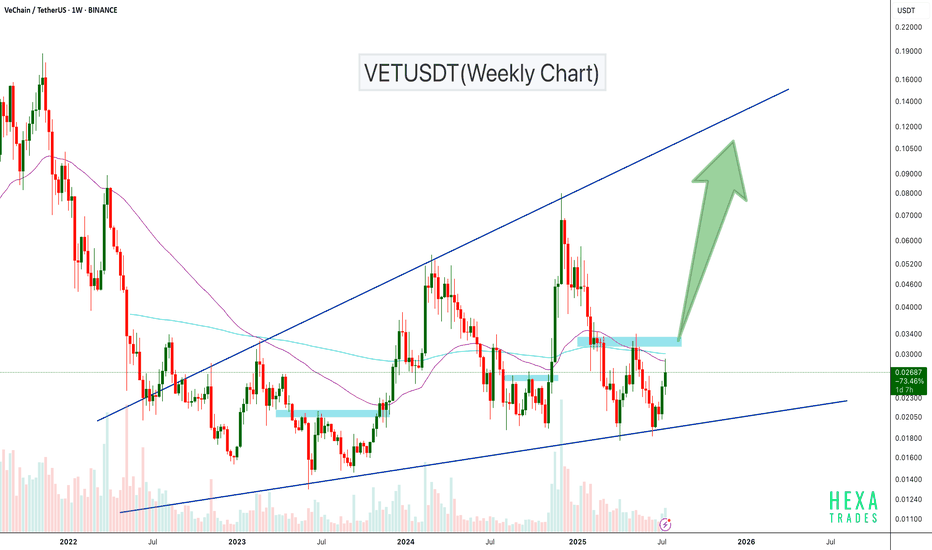
VETUSDT Ascending Broadening WedgeVETUSDT is trading inside a long-term ascending broadening wedge on the weekly chart, with price currently bouncing off major trendline support. After holding this support zone, VET is showing strength and approaching a critical resistance area around $0.033–$0.035.
A breakout above this zone could trigger a strong bullish rally, with potential upside targets in the $0.06–$0.10 range, and even higher toward the wedge top.
Cheers
Hexa
BINANCE:VETUSD NYSE:VET
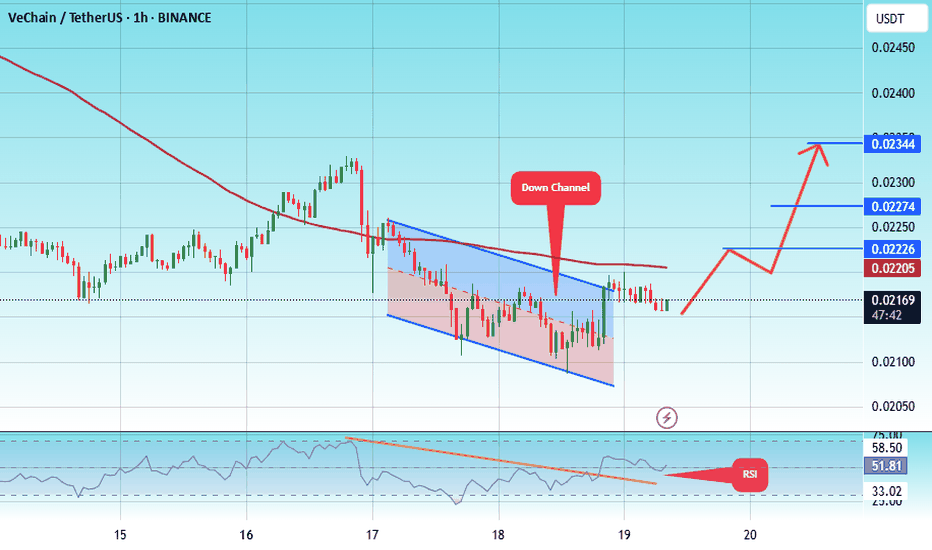
#VET/USDT#VET
The price is moving within a descending channel on the 1-hour frame, adhering well to it, and is heading towards a strong breakout and retest.
We are experiencing a rebound from the lower boundary of the descending channel. This support is at 0.02086.
We are experiencing a downtrend on the RSI indicator, which is about to break and retest, supporting the upward trend.
We are heading towards stability above the 100 Moving Average.
Entry price: 0.02160
First target: 0.02226
Second target: 0.02274
Third target: 0.02344
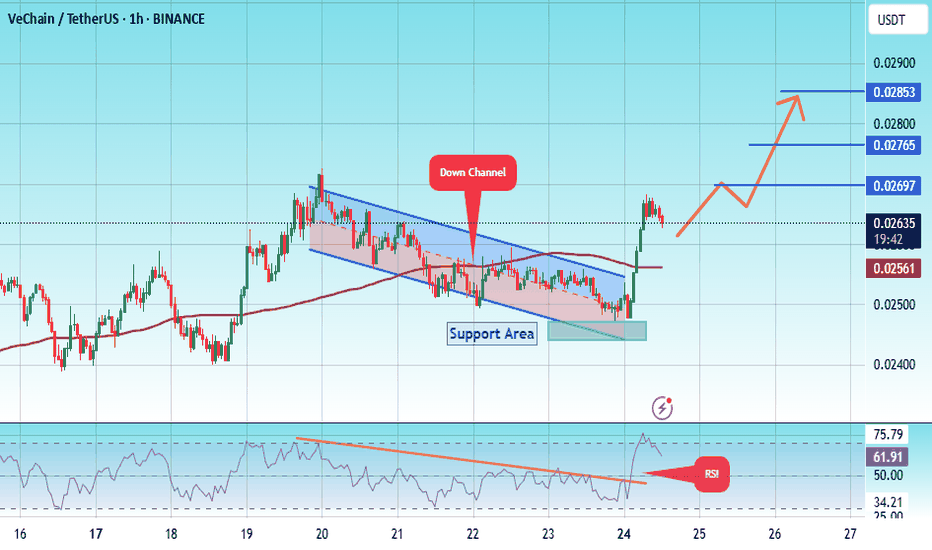
#VET/USDT#VET
The price is moving within a descending channel on the 1-hour frame, adhering well to it, and is on its way to breaking it strongly upwards and retesting it.
We are seeing a bounce from the lower boundary of the descending channel, this support at 0.02460.
We have a downtrend on the RSI indicator that is about to break and retest, supporting the upward trend.
We are looking for stability above the 100 moving average.
Entry price: 0.02620
First target: 0.02700
Second target: 0.02765
Third target: 0.02853
#VET/USDT#VET
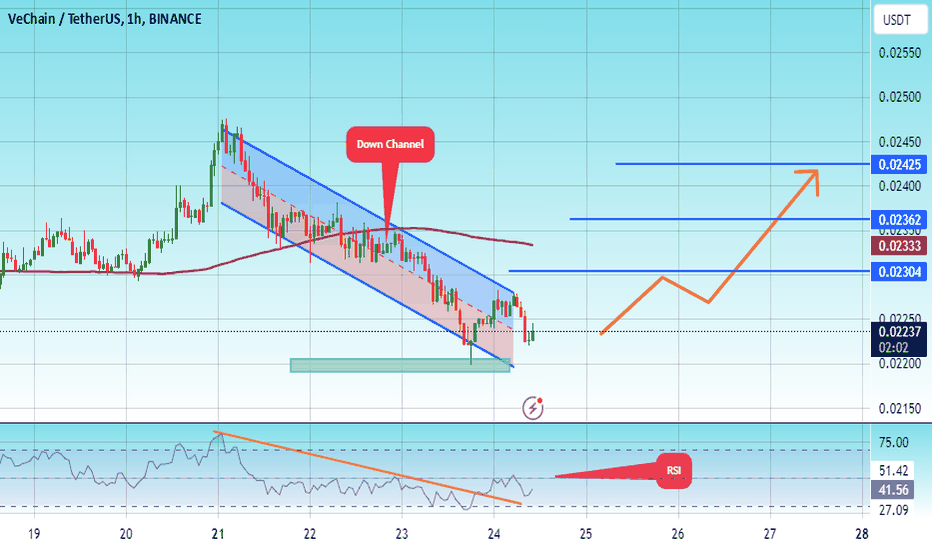
The price is moving in a descending channel on the 1-hour frame and sticking to it well
We have a bounce from the lower limit of the descending channel and we are now touching this support at a price of 0.02200
We have a downtrend on the RSI indicator that is about to be broken, which supports the rise
We have a trend to stabilize above the moving average 100
Entry price 0.02430
First target 0.02300
Second target 0.02362
Third target 0.02425
#VET/USDT#VET
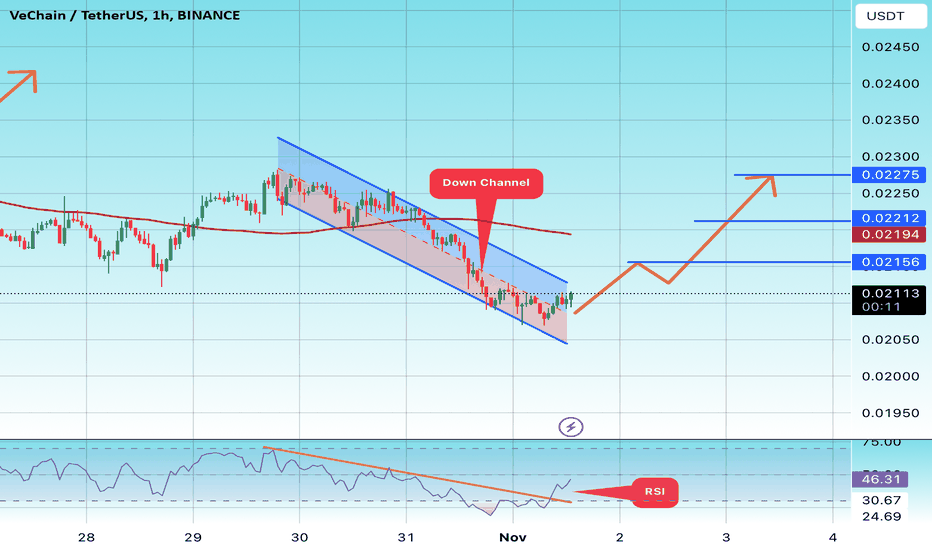
The price is moving in a descending channel on the 1-hour frame upwards and is expected to continue
We have a trend to stabilize above the moving average 100 again
We have a downtrend on the RSI indicator that supports the rise by breaking it upwards
We have a support area at the lower limit of the channel at a price of 0.02070
Entry price 0.02110
First target 0.02156
Second target 0.02212
Third target 0.02275
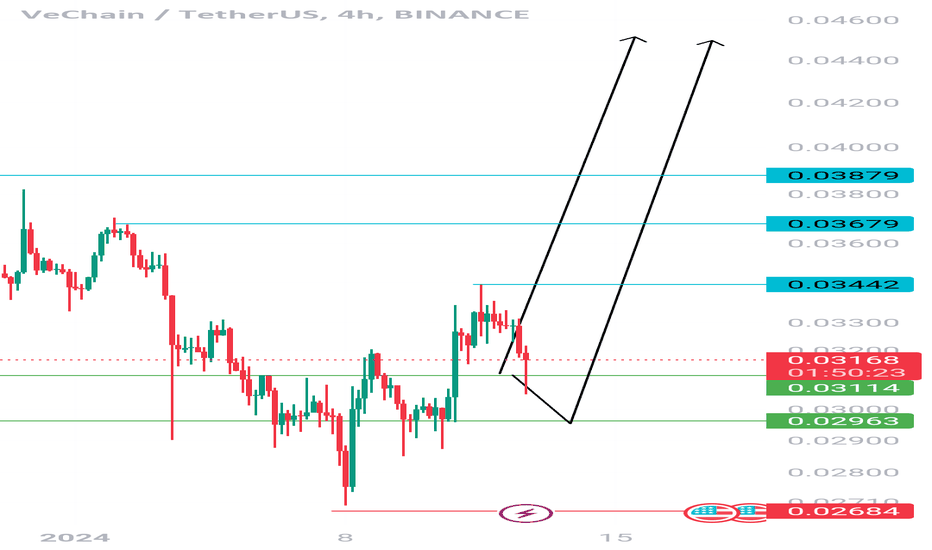
🐮💹🚀 Vet/Usdt Trading Idea 🚀💹🐮
Vet/Usdt is currently showing bullish signs 📈. The market structure has turned into a bullish pattern, and the price is retracing to test a new demand area 🔄. This could signify a potential upward movement. I anticipate a rise in price from this point, potentially ranging between 15-30% 📈🔥.
Remember, this analysis is not financial advice ❌📉. Always conduct your own research (DYOR) and make informed decisions. Happy trading! 💪💰📊
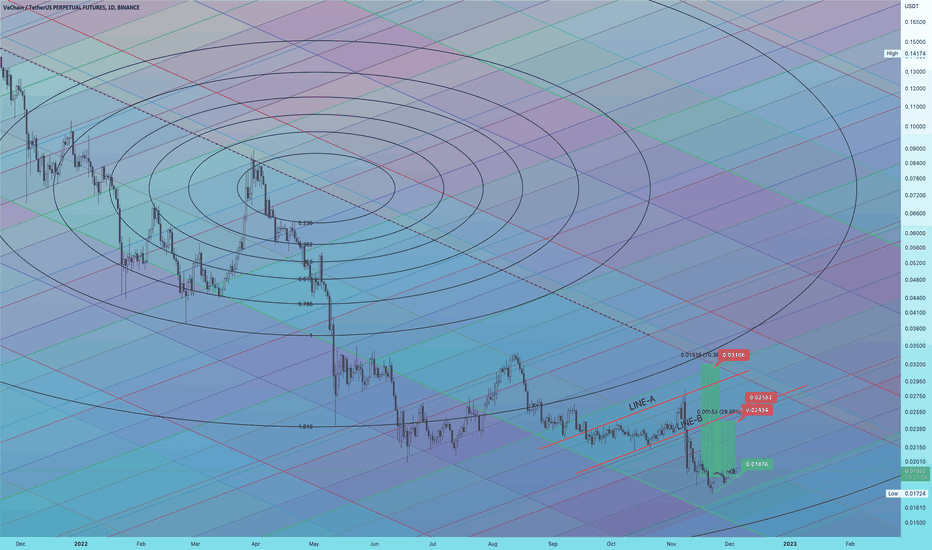
VET short termHello Birdies,
We have successfully plotted another coin on new strategy we are using. Let's get to the point.
As usual Green to buy and Red to Short as per price action.
Line-A is highly unlikely to be breached as there is still alot of liquidity at LINE-B.
If an only if line-B is breached we can see 70%-80% otherwise settle down at 30%.
VeChain VET price are holding up well, what are growth prospect?VeChain (VET) is a blockchain platform for logistics management.
The idea behind VeChain is to increase the efficiency, traceability, and transparency of supply chains while reducing costs and putting more control in the hands of individual users.
Maximally logistics optimization is very important in the current difficult times.
Launched in June 2016, VeChain is now one of the oldest specialized blockchain-based logistics platforms.
VET is a token used for transactions and other activities, while VTHO provides commission payment, similar to how Gas works for Ethereum (ETH) transactions.
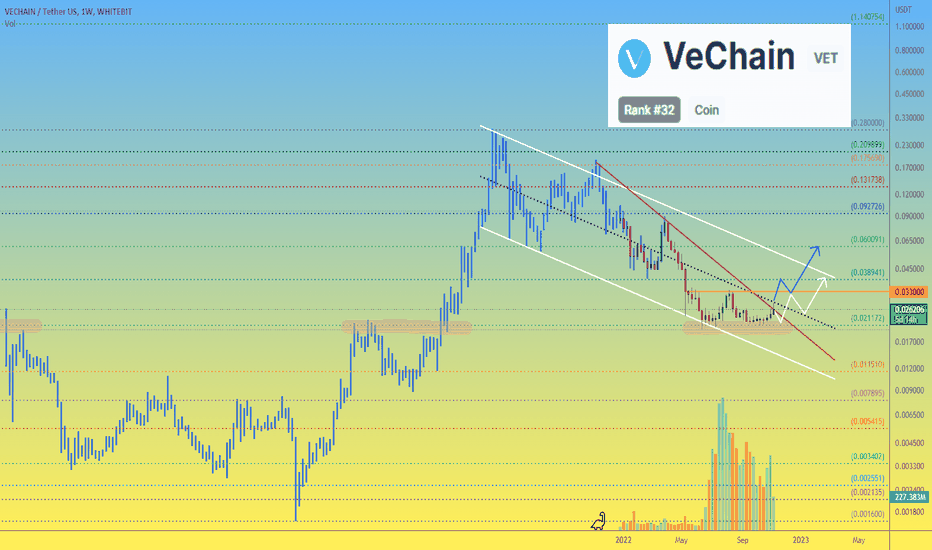
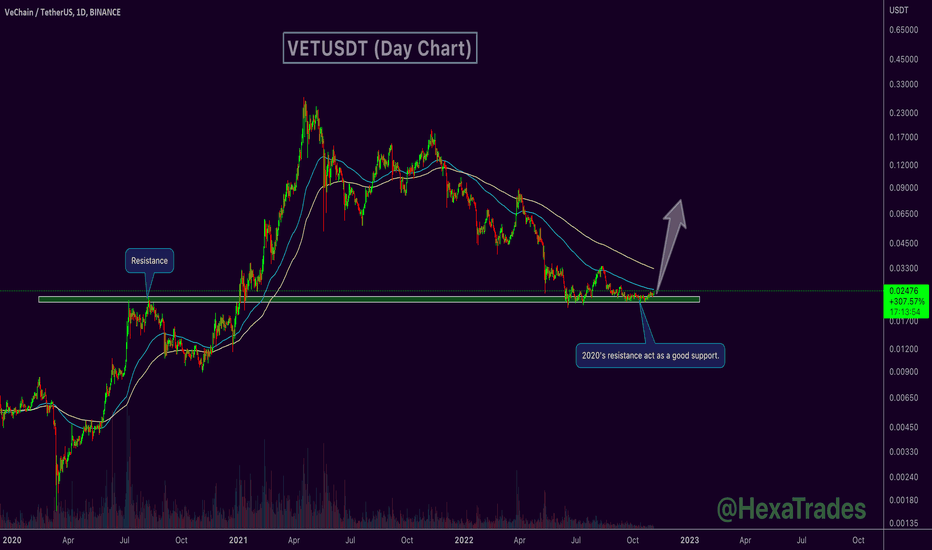
If we look at the chart with weekly candlesticks, we can see that for the last six months the price of VETUSDT has been trading above a strongly mirrored level.
The liquidity zone of $0.02-0.022 in 2018, 2020-2021 and now skillfully played the role of resistance and support alternately for a long period of time.
In case of a positive phase in the cryptocurrency market, $0.039 per VET should be an easy target in the coming weeks.
The medium-term target is $0.06 according to the blue scenario.
If the negative background and "wars" behind the scenes of the crypto market will continue (in particular, we described them in yesterday's FTTUSDT idea)
Then the development of the white scenario can also be considered positive)
The main thing is that buyers of VETUSD keep the price above the liquidity zone of $0.02-0.022 and then everything will be fine for VET in the medium and long term.
_____________________
Did you like our analysis? Leave a comment, like, and follow to get more
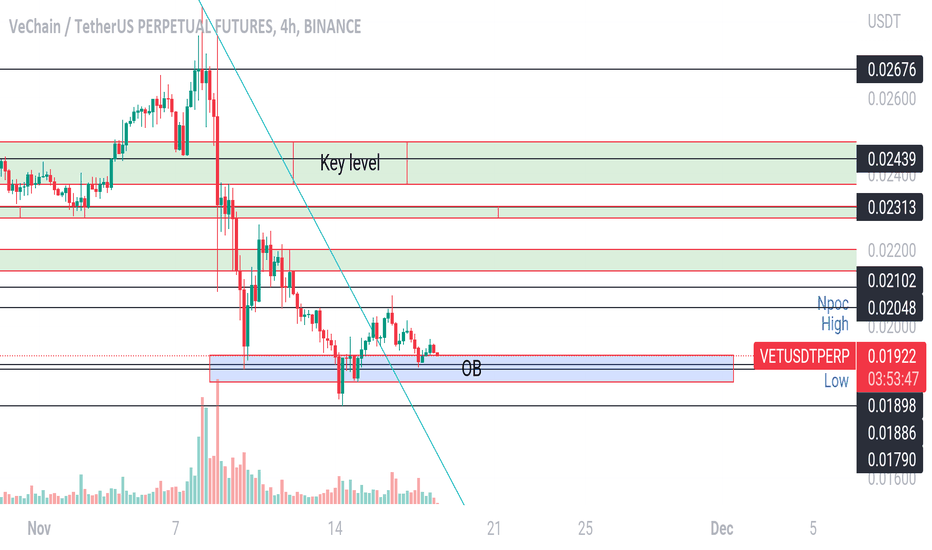
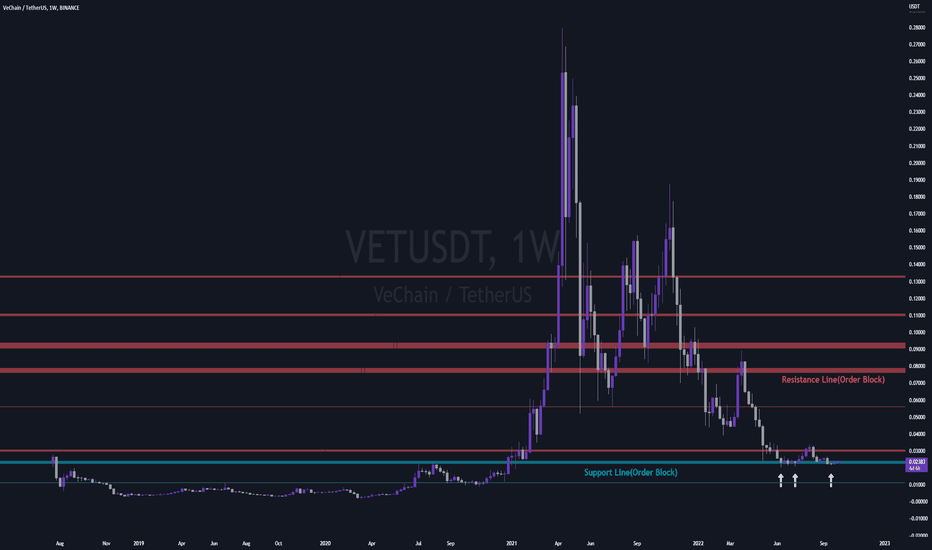
VETUSDT 1W LONG ANALYSISHi, friends. Nice to meet you
The chart we're going to analyze is the VETUSDT PERP chart
We're right above the very important support order block right now, and we've gathered all our strength to climb, so we're judging that it's going to go up
Please refer to your friends and have a good TRADING
#VET IS READY TO PUMP after the breakout of this trendline!!!Hi guys, This is CryptoMojo, One of the most active tradingview authors and fastest-growing communities.
Do consider following me for the latest updates and Long /Short calls on almost every exchange.
I post short mid and long term trade setups too.
Let’s get to the chart!
I have tried my best to bring the best possible outcome in this chart, Do not consider it as financial advice.
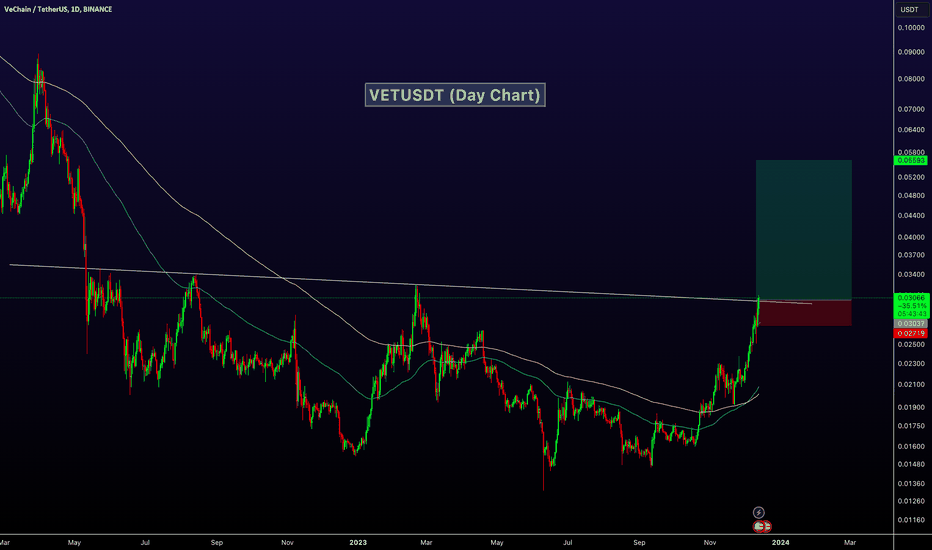
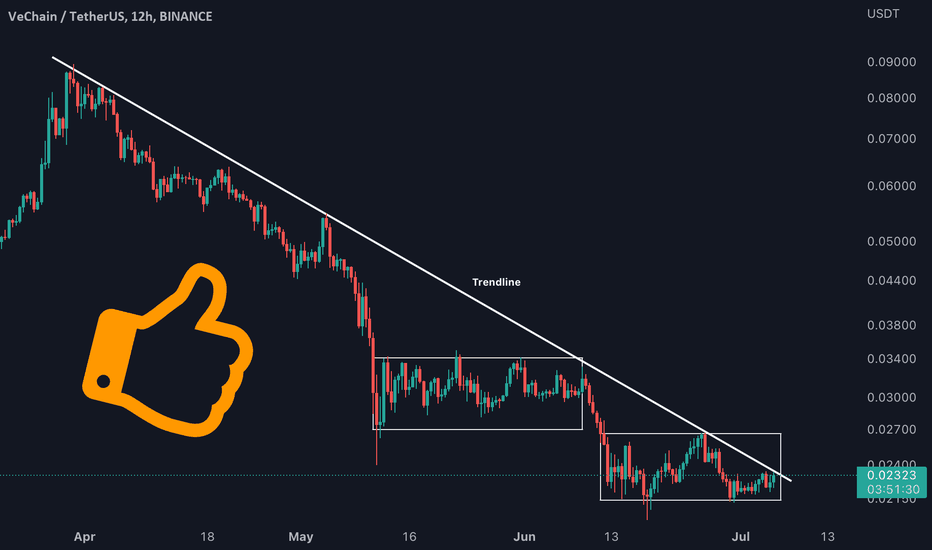
#VET is Attempting to Breakout of Downward Trendline, we accept some good bounce after the breakout of this trendline.
Entry- CMP and add more up to $0.0218
TARGET- 100%
LEVERAGE- 5X
SL- $0.02
This chart is likely to help you in making better trade decisions, if it did do consider upvoting this chart.
Would also love to know your charts and views in the comment section.
Thank you
