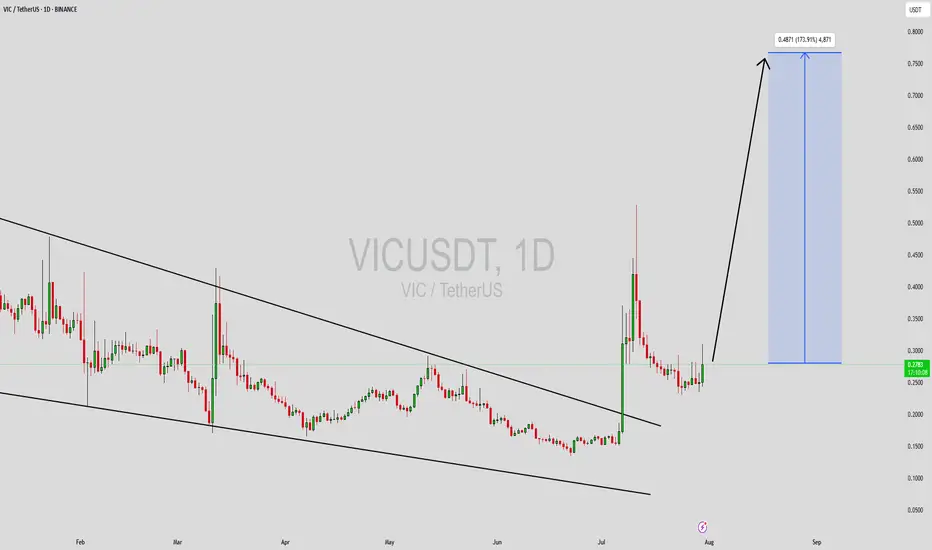
VICUSDT Forming Bullish WaveVICUSDT is currently exhibiting a powerful bullish wave pattern that could signal the beginning of a significant upward move. After a period of consolidation and corrective decline, the price has begun to carve out a series of higher highs and higher lows—often a precursor to explosive momentum. The volume profile also aligns with this structure, showing increased interest from buyers who seem to be positioning ahead of a breakout. This pattern often aligns with Elliott Wave Theory’s impulsive leg, suggesting a sharp upside move could soon unfold.
Technically, VICUSDT is showing signs of entering a new bullish phase. With a potential breakout already brewing, this asset could see an impressive gain of around 140% to 150% if current momentum continues. Traders should pay attention to resistance breakouts and volume surges, as these will be key confirmations of the wave pattern's validity. The bullish wave formation indicates not just a short-term pump, but the possibility of sustained upward movement in line with broader market recovery.
Investor sentiment is steadily improving around the VICUSDT project. Increased trading volume and stronger community buzz suggest that accumulation is underway, potentially ahead of major catalyst events or market-wide bullishness. This aligns well with technical projections, making VICUSDT a high-risk, high-reward opportunity for traders watching for altcoin season setups.
In a market driven by momentum and wave-based patterns, VICUSDT stands out with a structure that supports a strong continuation. Traders and investors alike should keep a close eye on this pair, as the technicals align for a breakout scenario that could exceed expectations.
✅ Show your support by hitting the like button and
✅ Leaving a comment below! (What is You opinion about this Coin)
Your feedback and engagement keep me inspired to share more insightful market analysis with you!
Vicusdtsignal
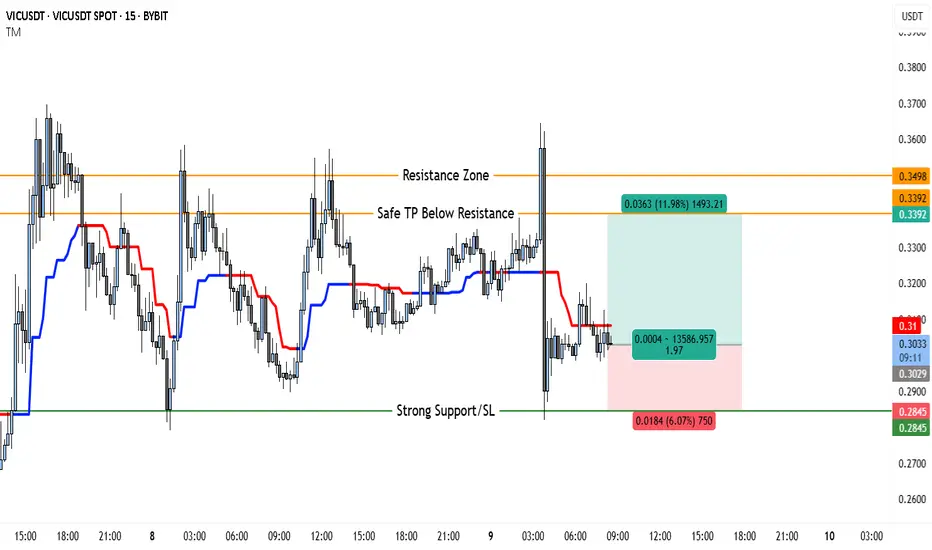
VICUSDT 15-Minute Technical Analysis With 2:1 RewardThis chart shows a clear range-bound market, with price oscillating between a strong support and a well-defined resistance zone. Overall, momentum has been choppy, and frequent reversals are visible.
Support and Resistance
At the top of the chart, you have the Resistance Zone marked at 0.3498 USDT. This level has been tested multiple times and rejected. Each attempt to close above this area resulted in sharp selling pressure, confirming it as a significant ceiling for price action.
A slightly lower level, labeled Safe Take Profit, is set at 0.3392 USDT. This is a strategic target that allows traders to secure gains before price collides with the stronger resistance.
The lower part of the range is defined by Strong Support around 0.2845 USDT. This support level has been respected after previous sell-offs, showing that buyers have consistently defended this zone.
Trend and Structure
Market structure is consolidative. Price has printed lower highs over several sessions, but at the same time, it has held onto higher lows closer to the support. This compression indicates an upcoming breakout, either toward the resistance or through the support.
Short-term momentum is indecisive. The colored moving average ribbon you applied (likely a Supertrend or fast EMA) flips repeatedly between red and blue, showing the market has no persistent trend.
A notable volatility spike occurred during one of the recent candles, sweeping the lows and immediately rebounding—classic behavior near strong support. This long wick suggests that some stop-loss liquidity was taken, and buyers reacted swiftly to reclaim the level.
Volume Considerations
Although the chart doesn’t show volume, it is reasonable to assume there was a volume surge during those sharp wicks, which typically precedes either a reversal or acceleration. Before entering a trade, confirming volume is critical for validation.
Current Price Behavior
The current price (~0.3028 USDT) is stuck below the mid-range, facing hesitation. The moving averages have flattened. This is a textbook sign that the market is accumulating orders in preparation for the next decisive move.
Trade Idea
Below is a simple, clear trade idea you can consider, with bullets for clarity:
• Entry: Near 0.3028 USDT, ideally after a bullish confirmation candle that closes above recent small consolidation.
• Take Profit: The Safe TP level at 0.3392 USDT, positioned just under resistance.
• Stop Loss: Just below the Strong Support at 0.2845 USDT.
• Risk/Reward Ratio: Approximately 2:1. This offers reasonable upside relative to the risk.
This setup is effective only if price holds above the support and begins to trend higher. If price fails to sustain above 0.30, it could signal a deeper retest of support.
Scenarios to Watch
If you are trading this setup, it’s important to watch for three potential outcomes.
In the bullish scenario, price holds above ~0.300 and forms a higher low. A strong bullish candle closing near 0.31 or higher would add confirmation. If this happens, the path to 0.3392 becomes more likely, and possibly even to the full resistance zone at 0.3498.
In the bearish scenario, price loses the support at 0.2845 decisively. A clean close below this level opens up downside risk, possibly accelerating liquidations from trapped long positions.
In a consolidation scenario, price remains compressed between ~0.295 and ~0.315. If this happens, patience is necessary until a breakout confirms direction.
Execution Tips
When you plan to enter this trade, consider the following:
If you enter near 0.303, monitor the next 2–3 candles carefully. You want to see buyers stepping in with higher lows and a steady move toward 0.32. If price instead hovers sideways or moves lower, be prepared to exit quickly to protect capital.
Avoid moving your stop loss further down if the trade moves against you. This is a common mistake that often leads to larger losses.
Scaling out partial profit before the final target is a smart tactic. For example, consider closing 50% of your position near 0.325 if the price shows signs of hesitation.
Summary
Your VICUSDT 15m chart reveals a clean trading range between 0.2845 and 0.3498. The market has no clear trend, but the setup you highlighted can work if buyers confirm strength above 0.30. The plan combines a relatively tight stop, a realistic target under resistance, and a favorable risk/reward profile.