VIRTUALUSDT – Is the Wedge Nearing Its End? A Breakout Could!⏳ Current Situation:
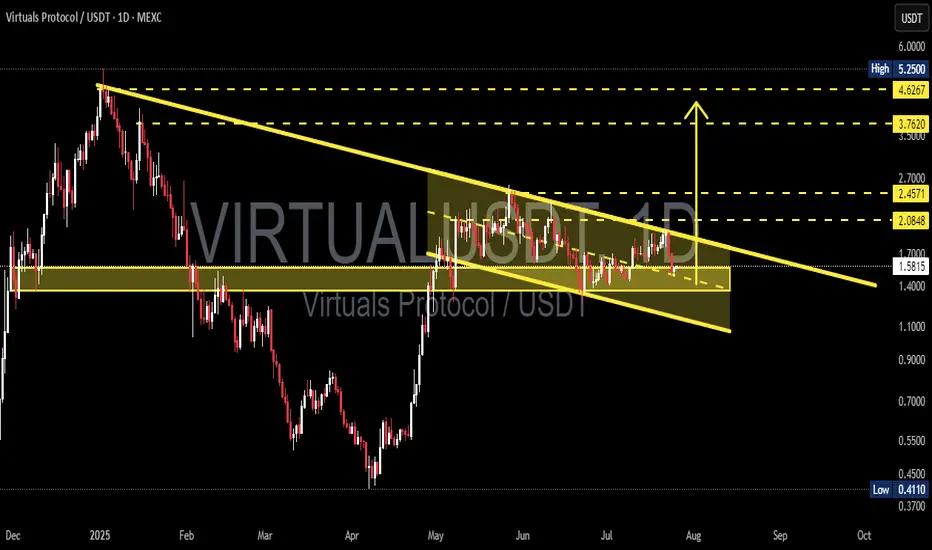
VIRTUALUSDT is approaching a crucial moment after months of sideways price action. Following a steep decline from its all-time high ($5.25), price action has formed a Falling Wedge pattern — a well-known bullish reversal formation.
Now, as price consolidates toward the wedge's apex, the potential for a breakout grows stronger with each passing day.
---
📌 Pattern Structure:
Pattern: Falling Wedge (Bullish Reversal)
Duration: Since May 2025 (multi-month)
Support line: Ascending slope, catching lower dips
Resistance line: Descending pressure trendline
Price action: Trapped inside the wedge, signaling accumulation and shrinking volatility
This structure suggests that a large move may be right around the corner.
---
🔼 Bullish Scenario (Breakout):
If VIRTUALUSDT successfully breaks above the upper wedge boundary (~$1.70), the following key resistance levels could become major bullish targets:
1. $2.08 – Initial breakout confirmation level
2. $2.45 – Key resistance zone; breakout could accelerate here
3. $3.76 – Strong historical supply area
4. $4.62 – Major previous resistance
5. $5.25 (ATH) – Long-term bullish target if strong momentum follows
💡 Tip: A volume spike on the breakout adds confirmation and reduces the risk of a false breakout.
---
🔽 Bearish Scenario (Breakdown):
If the price fails to break out and instead falls below the wedge support (~$1.40):
1. Look for support near $1.20 – $1.10
2. Further downside could lead to $0.70 – $0.50
3. The ultimate support lies around $0.41, the current all-time low
⚠️ Note: A breakdown without volume can be a fakeout. Always wait for confirmation.
---
🎯 Conclusion & Strategy:
> VIRTUALUSDT is coiling inside a falling wedge pattern — typically a prelude to an explosive move. Whether bullish or bearish, the breakout direction will offer a strong trading opportunity.
Suggested Strategy:
Watch for breakout + volume confirmation before entering
Place tight stop-loss below wedge support if buying the breakout
Set tiered take-profits based on horizontal resistance zones
#VIRTUALUSDT #AltcoinBreakout #FallingWedgePattern #CryptoSetup #BullishReversal #BreakoutWatch #AltcoinAnalysis #CryptoTechnical #VolumeBreakout
Virtualusdtlong
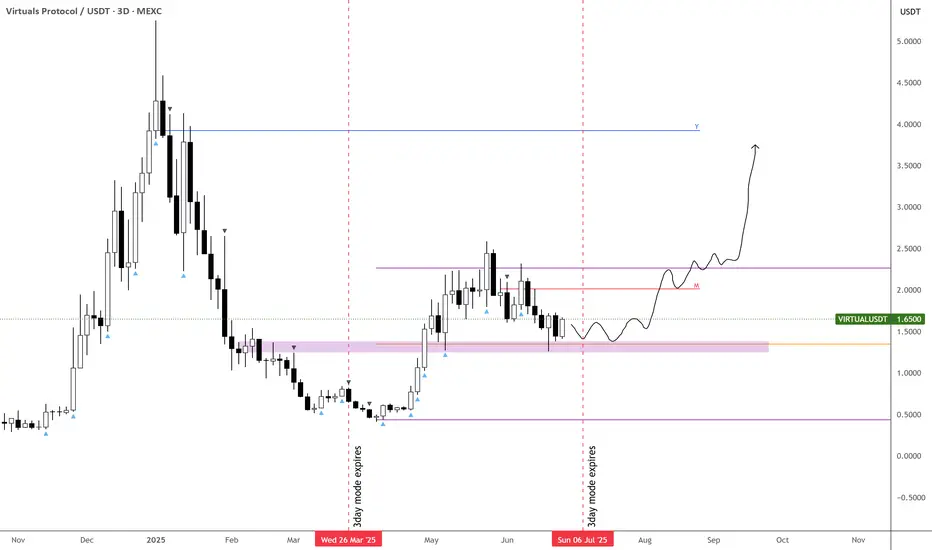
VIRTUAL – Setting Up for a July Breakout - $4 in the Horizon!
Another coin worth bidding on: $VIRTUAL.
It's setting up nicely above the mid-range of the current trading range, with a clean S/R flip off the previous cluster zone.
The 3-day MA is holding well, and the downtrend from the local highs is set to expire on July 6th.
Expecting a strong trend to kick in during the second week of July, with potential to push toward the $4 mark.
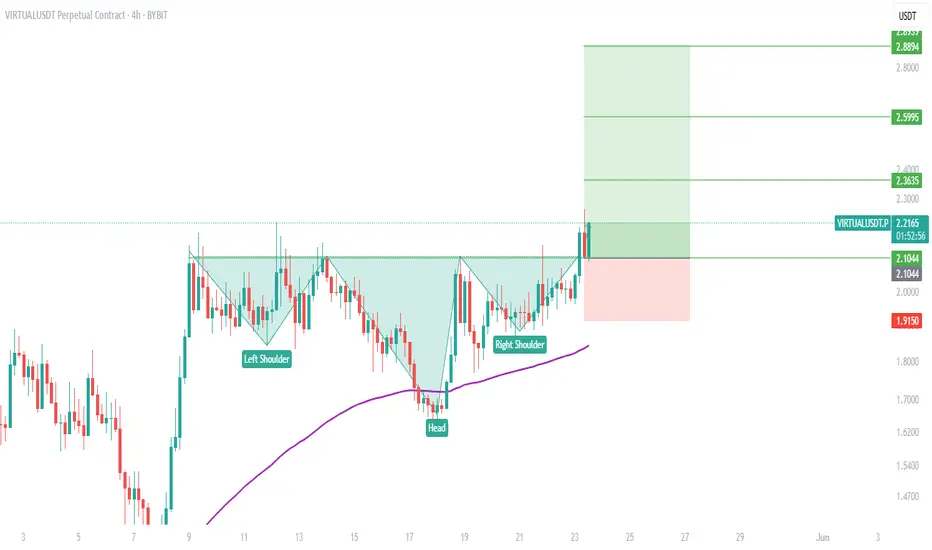
$VIRTUAL Breakout Alert!!A clean inverse head and shoulders pattern has just triggered, and we’ve already seen a strong breakout above the neckline!
This is a classic bullish reversal signal, and the chart is screaming momentum
🟢 Key Levels:
• Entry around the neckline breakout
• Targets lined up: $2.36, $2.59, and $2.89
• SL below right shoulder: $1.91 for risk control
The 200 EMA is now sloping upward — further confirmation of trend shift!
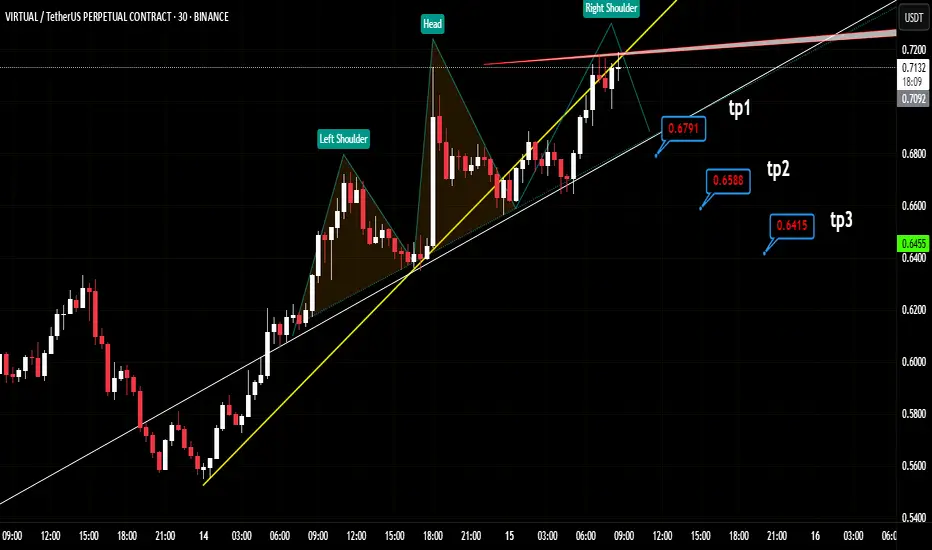
#VIRTUALUSDT - Head and Shoulders Formation and Targets! Hey there, everyone! Next up, we’re looking at the position for #VIRTUALUSDT. When I combine the volume and RSI components and consider the price being very close to the trendline (with a small breakout on lower timeframes), I’m expecting an Inverse Head and Shoulders formation.
The exact targets will change depending on the breakout confirmation level, but I’ve tried to provide approximate targets in this analysis.
Wishing you all a green-filled day with my best wishes. 🌱
What do you think about my analysis? Drop your thoughts in the comments and let’s discuss!
#AlyAnaliz #TradeSmart #CryptoVision #VIRTUALUSDT
FET vs Virtual? What you choose?Now stances marked is short, for you not to short and buy these coins at a more discounted rate and for others, who holds, may average, FOMO's may buy 35% and buy at more down levels below.
As you can see in the following chart of FET/USDT (Monthly) Halted 2 months on 50 SMA for a smooth up reversal, though this is not the only thing you shall look for, but among all those its a dataset to look upon.
Quite obvious to know that if FET/USDT moves, it needs time to ripe and then move.
For shorts, or scalpers direction is marked. You won't expect how the market turns table out.
I am expecting this in for FETUSDT
Coming to VIRTUAL - The Chart marked are something to be seen and is quite interesting
Have a look at this above charts. Weekly shows nothing much but yeah, ive seen this pattern, it traps buyers a lot from this point, retracing down 32% from the CMP, but theres a catch!
How can you plan your buys? Just look at the chart. The green line is a major magnet to attract the price to top, averting momentum for shorters, see the small initial dips i have marked, retracing to the tops and back and again falling, So my ideal idea is you may cmp 35% at the small dips and major buys at the 0.91 levels.
Expecting same 75% retracement on this as well.
Pardon me, the chart i shall had zoomed, but i missed it!!
