VIX Breakout: Forex Traders, Buckle Up for Volatility!🚨 VIX Surge: What Currency Traders Need to Know Right Now 🌪️💱
📊 Chart Context & Technicals:
The recent breakout in the VIX signals a major shift in global risk sentiment! 📈 The index has leapt off its base, showing markets are bracing for uncertainty. For forex traders, this is a flashing signal: volatility in equities often spills over into FX, amplifying moves in major pairs and risk-sensitive crosses. ⚡️
🌍 Geopolitical & Macro Backdrop:
This VIX spike is fueled by President Trump’s aggressive new tariffs on BRICS-aligned nations. 🏛️🔥 These moves have reignited global trade war fears, rattled equity markets, and triggered a broad risk-off wave. Historically, VIX surges = sharp swings in USD, JPY, CHF, and commodity-linked currencies. The USD, usually a safe haven, is now under pressure from both trade uncertainty and looming Fed rate cuts as the U.S. economy slows. 🏦📉
💱 FX Market Implications:
USD: The dollar is caught between safe-haven demand and worries over U.S. growth and deficits. Initial VIX spikes can boost USD, but ongoing trade tensions and dovish Fed signals are weighing it down. 💵⚖️
JPY & CHF: Classic safe-haven currencies! As VIX rises, expect flows into JPY and CHF, especially against high-beta currencies like AUD, NZD, and EM FX. 🗾🇨🇭
EUR, GBP, AUD, CAD: European currencies are outperforming in 2025, thanks to fiscal stimulus and capital inflows. Commodity currencies remain volatile, tracking risk appetite and global growth swings. 💶💷🇦🇺🇨🇦
🛠️ Trading & Strategy Takeaways:
Volatility = Opportunity: Elevated VIX means wider ranges and more frequent breakouts in FX. Prime time for breakout and momentum strategies, but demands tighter risk controls and dynamic position sizing! 🚦
Watch Correlations: Rising VIX typically strengthens JPY and CHF, while risk currencies (AUD, NZD, EM FX) weaken. USD direction is more nuanced—initially bid, but vulnerable to U.S. policy missteps and data misses. 🔄
Event Risk: With Trump’s tariff policy in flux and central banks diverging, expect FX volatility to stay high. Stay nimble around news releases and be ready for headline-driven whipsaws! 📰⚡️
🎯 Pro Takeaway:
The VIX is flashing a clear warning for currency traders: risk sentiment is deteriorating, and volatility is back in force. This environment rewards disciplined, adaptive trading—favoring safe-haven currencies, tactical hedges, and a readiness to pivot as policy headlines evolve. For those trading USD/JPY, EUR/USD, and cross-rates, expect bigger intraday swings and more false breakouts. Use the VIX as your real-time risk barometer and adjust your strategies accordingly! 🧭
Vixfutures

Trading the VIX – Part 2Trading the VIX – Part 2: VIX ETPs and Strategic Applications
In Part 1 of this series, we explored the structure of VIX Futures, focusing on the roll-down effect in a contango VIX futures curve—common in calm market conditions.
In Part 2, we turn our attention to VIX-related Exchange-Traded Products (ETPs)—specifically, the popular and liquid:
• VXX – unleveraged long VIX ETP
• UVXY – leveraged long VIX ETP
• SVXY – inverse VIX ETP
Each of these products is based on a specific VIX futures strategy, the “S&P500 VIX Short Term Futures Index” , which is maintained by S&P, Dow Jones (the “SPDJ-Index”). The Fact Sheet and Methodology can be obtained from the S&P Global website.
What is the SPDJ Index that these ETPs track?
The SPDJ-Index is a strategy index that maintains a rolling long position in the first- and second-month VIX futures to maintain a constant 30-day weighted average maturity.
Key Features of the SPDJ Index:
• Starts with 100% exposure to VX1 (the front-month future) when it’s 30 days from expiration.
• Gradually it rolls from VX1 to VX2 (next-month future) each day to maintain a 30-day average expiration.
• At all times, the index is long either one or both VX1 and VX2, with exposure shifting daily from VX1 to VX2.
• This roll mechanism causes value erosion in contango (normal markets) and gains in backwardation (during volatility spikes).
• Since contango is the dominant market state, the index loses value over time—with occasional short-lived gains during sharp volatility increases.
Importantly, the SPDJ Index does not represent the VIX or any other volatility level, it simply reflects the value of this futures-based rolling strategy.
________________________________________
Breakdown of the ETPs: VXX, UVXY, and SVXY
VXX – Long SPDJ Index (1x)
• Tracks the SPDJ Index directly
• Suffers from the roll-down drag in contango environments.
• Useful only for short-term exposure during expected volatility spikes.
• Timing for long positions is critical
UVXY – Leveraged Long (Currently +1.5x)
• Replicates a strategy that maintains a constant leverage of 1.5 to the SPDJ Index.
• Formerly +2x leverage; reduced in April 2024.
• Highly sensitive to VIX moves; underperforms long term due to both roll-down drag and leverage decay (see below). Timing for long positions is even more important than for the VXX.
SVXY – Inverse (-0.5x)
• Replicates a strategy that maintains a constant exposure of -0.5 to the SPDJ Index.
• Benefits from falling VIX levels as well as from contango in the front part of the VIX futures curve.
• Formerly -1x before the Feb 2018 volatility spike triggered massive losses (XIV, a competing ETP, collapsed at that time).
• Performs well in calm conditions but is vulnerable to sharp volatility spikes.
Leveraged & Inverse ETPs – Important Notes affecting the UVXY and SVXY (without going into details):
• Daily resetting for the replicating strategies to maintain constant exposure factors (different from 1x) are pro-cyclical and can cause compounding errors, specifically in turbulent markets (e.g. Feb 2018).
• The real volatility of the VIX futures itself acts as a drag on returns, independent of the index’s direction.
• Risk management is essential—especially with inverse products like SVXY.
All three of these ETPs track a VIX futures strategy, they are not levered or unlevered versions of the original VIX index. Each of these ETPs benefits from liquid option markets, enhancing the toolkit for volatility trading.
Trading Strategies Using VIX ETPs
Here are several practical approaches to trading these products:
VXX and UVXY
• Best used for short-term trades aiming to capture volatility spikes.
• Options strategies such as zero-cost collars, vertical and calendar spreads can help mitigate the challenge of precise timing.
• Avoid long-term holds due to erosion from roll-down and leverage decay (see historical performance!).
SVXY – The Carry Trade Proxy
• Ideal for profiting from prolonged calm periods and the contango structure.
• Acts like a carry trade, offering a positive drift—but must be paired with robust stop-loss rules or exit strategy to guard against sharp spikes in volatility.
Switching Strategies
• Tactically rotate in/out of SVXY based on short-term volatility indicators.
• One common signal: VIX9D crossing above or below VIX, i.e. long SVXY if VIX9D crosses under VIX, staying long while VIX9D < VIX, closing long SVXY position when VIX9D crosses over VIX. Some traders also use crossovers with VIX3M or the individual expirations of the VIX futures curve to manage entries.
• Switching between SVXY and VXX based on crossover triggers through the VIX futures curve is often advertised, but very hard to get working in practice due to the importance of timing the VXX entry and exit – signals from the VIX curve may not signal VXX entries and exits timely enough.
Term Structure-Based Combinations
• Combine short VXX with long VXZ (an ETP tracking longer-dated VIX futures, balancing the 4th to 7th VIX contracts to achieve a constant expiration of 60days).
• Weighting is determined by the Implied Volatility Term Structure (IVTS), calculated as VIX / VIX3M. This approach adjusts positions based on the shape of the VIX futures curve, indicated by the IVTS. For instance, when the VIX futures curve shifts from contango (where near-term futures are cheaper than longer-term ones) to backwardation (where near-term futures are more expensive), it involves reducing short positions in VXX and increasing long positions in VXZ.
• This approach mimics the spirit of a calendar spread strategy in VIX futures and reflects the “S&P 500 Dynamic VIX Futures Index” , with weightings backed by research from Donninger (2011) and Sinclair (2013) - see performance chart and weighting-matrix enclosed in the introductory chart).
________________________________________
VIX Curves as Market Indicators
Beyond trading, VIX instruments and their term structure are widely used as market sentiment gauges. For instance:
Signs of Market Calm:
• VIX9D < VIX
• VIX < VIX3M
• VIX < VX1
• VX1 < VX2
These relationships imply that short-term volatility is lower than longer-term expectations, indicating near-term calmness in markets, occasionally leading to market complacency.
Traders and institutions use these signals to:
• Adjust positioning in broad market indices
• Determine hedging requirements
• Evaluate suitability of selling naked options
________________________________________
Final Thoughts
VIX ETPs offer a powerful toolkit for traders seeking to profit from or hedge against volatility. But they come with structural decay, leverage dynamics, and curve risk. Timing, strategy, and risk control are key.

VIX Trade Plan – May 23, 2025⚠️ VIX Trade Plan – May 23, 2025
📊 Instrument: VIX (Volatility Index)
🎯 Strategy: Long Exposure via Direct Shares
📈 Confidence: 70%
📅 Time Horizon: 3–4 Weeks
📌 Technical & Sentiment Snapshot
Price @ Entry: $21.88
Chart Structure:
• M30 / Daily: Bullish – above 10/50/200 EMAs
• Weekly: Mixed, but showing upward bias
• RSI: Neutral to slightly overbought
• MACD: Bullish cross on intraday; flattening on higher timeframes
Volatility Context:
• VIX up +26.9% over 5 days
• Backwardation in VIX futures
• Elevated VIX/VVIX ratio hints at further fear pricing
Headline Risk:
• Geopolitical + macroeconomic uncertainty
• Trade war tensions and surprise policy risk driving implied vol
🔽 TRADE RECOMMENDATION
Parameter Value
🔀 Direction LONG
💵 Entry Price $21.88
🛑 Stop Loss $20.14 (–8%)
🎯 Target Price $25.62 (+17%)
🧮 Size 100 shares
🏦 Risk Level ~1.5% of account
⏰ Entry Timing Market Open
📆 Hold Time 3–4 weeks
🧠 Rationale Behind the Trade
All 5 models agree on a moderately bullish short- to mid-term trend in VIX.
Momentum is supported by:
Rising geopolitical risks
Backwardated futures curve
Technical setups across intraday/daily charts
Entry point near $21.88 gives strong R/R if VIX spikes toward $25–$27 range.
⚠️ Key Risks to Watch
VIX Mean Reversion: VIX tends to drop quickly if risk subsides.
Overbought Intraday: May cause short-term pullbacks even in a bullish context.
Headline Dependency: Any peace deal, central bank surprise, or good news may instantly crush implied vol.
Liquidity Spreads: Use limit orders on open — VIX ETPs (e.g., VXX, UVXY) can see wide bid/ask gaps.
🧾 TRADE_DETAILS (JSON)
json
Copy
Edit
{
"instrument": "VIX",
"direction": "long",
"entry_price": 21.88,
"stop_loss": 20.14,
"take_profit": 25.62,
"size": 100,
"confidence": 0.70,
"entry_timing": "open"
}
💡 If VIX holds above $21.50 with momentum, this setup offers asymmetric upside. Stop placement near $20.14 helps protect against false breakouts or mean reversion traps.
VIX Call Trade Setup – Volatility Spike or Mean Reversion? (202⚡️ VIX Call Trade Setup – Volatility Spike or Mean Reversion? (2025-06-13)
Ticker: TVC:VIX | Strategy: 🔼 Weekly CALL Option
Bias: Moderately Bullish | Confidence: 65%
Expiration: June 18, 2025 | Entry Timing: Market Open
🔍 Technical & Sentiment Snapshot
• Current Level: ~20.96
• Short-Term Trend: Strong — Price above all EMAs (5m, 30m, Daily)
• Momentum: MACD bullish, 5m RSI >90 (overbought)
• Resistance Zone: $22.00 – $22.56
• Max Pain: $20.00 → potential magnet if reversal kicks in
• Sector Sentiment: S&P downtrend + macro risk keeping VIX supported
• OI Clusters:
– Puts: Heavy at $20.00
– Calls: Building interest at $22.00 and $23.00
🧠 AI Model Summary
✅ Grok + Gemini:
• Bullish bias, expect continued upside
• Favor calls: $22–$23 strikes
• Trade VIX strength on S&P weakness
⚠️ Llama + DeepSeek:
• Mean-reversion view → overbought conditions
• Suggest puts at $20.00 for reversion to max pain
📊 Consensus: Moderately Bullish
→ Ride momentum with tight risk controls
✅ Recommended Trade Plan
🎯 Direction: CALL
📍 Strike: 22.00
📅 Expiry: June 18, 2025 (Weekly)
💵 Entry Price: $0.97
🎯 Profit Target: $1.45 (+50%)
🛑 Stop Loss: $0.73 (–25%)
📏 Size: 1 contract
📈 Confidence: 65%
⏰ Entry Timing: Market Open
⚠️ Risks & Considerations
• RSI >90 → short-term pullback possible
• $22.00 resistance could cap the move
• VIX mean-reverting nature may drag it toward $20.00
• Equity stabilization (e.g. SPY bounce) = bearish for this call trade
• Manage size — weekly VIX options are very volatile
🔥 Volatility trades are fast and furious.
📣 Will VIX explode higher… or revert hard back to $20? Drop your setup below 👇
📲 Follow for daily AI-backed trading plans + option signals.
Trading the VIXOften dubbed the "fear index," the VIX gauges SPX options' implied volatility, typically rising during equity market declines and vice versa. It quantifies investor anxiety, demand for hedging, and market stress, crucial for traders and risk managers seeking to measure turbulence.
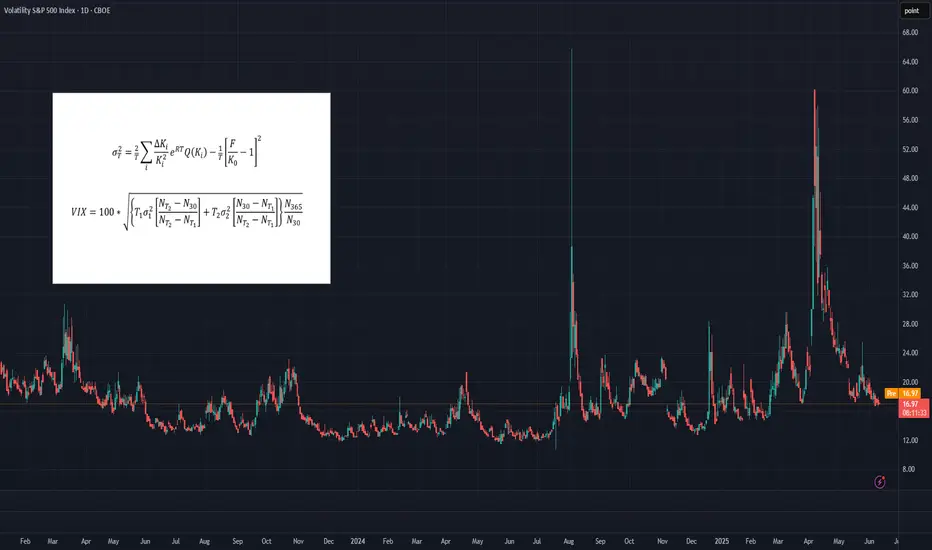
The VIX calculates a constant 30-day implied volatility using SPX options expiring over the next two months. Unlike simple weighted averages of equity indices, its methodology is more complex, involving implied variance calculation for the two nearest monthly expirations across all strikes. For detailed formulas, refer to the introductory chart or visit the CBOE’s official VIX Index page.
While the VIX Index itself isn’t tradable, exposure can be gained through VIX futures or exchange-traded products (ETPs) like VXX, UVXY, and SVXY. However, these instruments come with their own unique risks, pricing behaviors, and structural nuances, which can make directional VIX trading considerably more complex than it might initially appear.
What You Need to Know About Implied Volatilities
• In calm or uptrending markets, the volatility curve typically slopes upward (contango), indicating higher implied volatility with longer maturities.
• In declining or turbulent markets, the curve can invert, sloping downward (backwardation), as shorter-term implied volatilities rise sharply.
• This pattern can be observed, comparing VIX9D, VIX, and VIX3M against the SPX. In stable markets: VIX9D < VIX < VIX3M. In stressed markets, this relationship may reverse. The VIX9D and VIX3M are the 9-day respectively 3-month equivalent to the 30-day VIX.
What You Need to Know About VIX Futures
• When the volatility spot curve is in contango, the VIX futures curve will also slope upward.
• In backwardation, the futures curve slopes downward, reflecting heightened short-term volatility and short-term volatility spikes.
• While in contango, VIX futures "roll down the curve," meaning that—independent of changes in volatility—futures tend to decline in value over time.
• In backwardation, the opposite occurs: futures "roll up the curve," potentially rising in value over time even without volatility changes.
• VIX futures’ responsiveness to VIX Index movements – the beta of VIX futures against the VIX index - declines with longer expirations; front-month futures may react to 70-80% of VIX changes, compared to 40-60% for third or fourth-month futures.
Key Consequences for Traders
• Directional trading of VIX futures can be strongly influenced by the shape of the futures curve.
• Contango in low-VIX environments creates strong headwinds for long VIX futures positions, caused by the “roll-down-effect”.
• Conversely, backwardation in high-VIX environments creates headwinds for short positions.
• These effects are more pronounced in front-month contracts, making timing (entry and exit) for directional trades critical.
• There's a trade-off in directional strategies: front-month futures offer greater exposure to VIX movements but suffer more from negative roll effects.
How to Trade VIX Futures
• Due to these structural challenges, directional VIX futures trading is difficult and requires precision.
• A more effective approach is to trade changes in the shape of the futures curve using calendar spreads (e.g., long VX1, short VX2). This reduces the impact of roll effects on individual contracts.
• In low-VIX, contango conditions, a rising VIX typically leads to VX1 increasing faster than VX2, widening the VX1–VX2 spread—an opportunity for spread trading.
• While VX1 may initially suffer more from roll-down than VX2, this can reverse as the VIX rises and VX1 begins to “roll up,” especially when VIX > VX1 but VX1 < VX2.
• The opposite dynamic applies in high-VIX, backwardation environments.
• More broadly, changes in the shape of the futures curve across the first 6–8 months can be profitably traded using calendar spreads. Roll-effects and the declining beta-curve can also be efficiently traded.
How to capture the Roll-Down-Effect
One of the more popular VIX-trading strategies involves capturing the roll-down effect,, while the curve is in contango. It is a positive carry strategy that is best applied during calm or uptrending market conditions. Here’s a straightforward set of guidelines to implement the Roll-Down-Carry trade:
• Entry Condition: Initiate during calm market conditions, ideally when VIX9D-index is below VIX-index (though not guaranteed).
• Choosing Futures: Use VX1 and VX2 for calendar spreads if VX1 has more than 8-10 trading days left; otherwise, consider VX2 and VX3.
• Spread Analysis: Short VX1 and long VX2 if VX1–VIX spread is larger than VX2–VX1; otherwise, VX2 and VX3 may be suitable.
• Contango Effect: VX1’s roll-down effect typically outweighs VX2’s during contango.
• Relative Beta: VX1 shows higher reactivity to VIX changes compared to VX2, mimicking a slight short position on VIX.
• Exit Strategy: Use spread values, take-profit (TP), and stop-loss (SL); consider exiting if VIX9D crosses over VIX.
________________________________________
Conclusion
Directional trading of the VIX Index—typically through futures—demands precise timing and a good understanding of the volatility curve. This is because curve dynamics such as contango and backwardation can create significant headwinds or tailwinds, often working against a trader’s position regardless of the VIX’s actual movement. As a result, purely directional trades are not only difficult to time but also structurally disadvantaged in many market environments.
A more strategic and sustainable approach is to trade calendar spreads, which involves taking offsetting positions in VIX futures of different maturities. This method helps neutralize the impact of the curve's overall slope and focuses instead on relative changes between expirations. While it doesn’t eliminate all risk, calendar spread trading significantly reduces the drag from roll effects and still offers numerous opportunities to profit from shifts in market sentiment, volatility expectations, and changes in the shape of the futures curve.
What else can be done with VIX instruments
VIX indices across different maturities (VIX9D, VIX, VIX3M), along with VIX futures, offer valuable insights and potential entry signals for trading SPX or SPX options. In Part 2 of the Trading the VIX series, we’ll explore how to use these tools—along with VIX-based ETPs—for structured trading strategies.
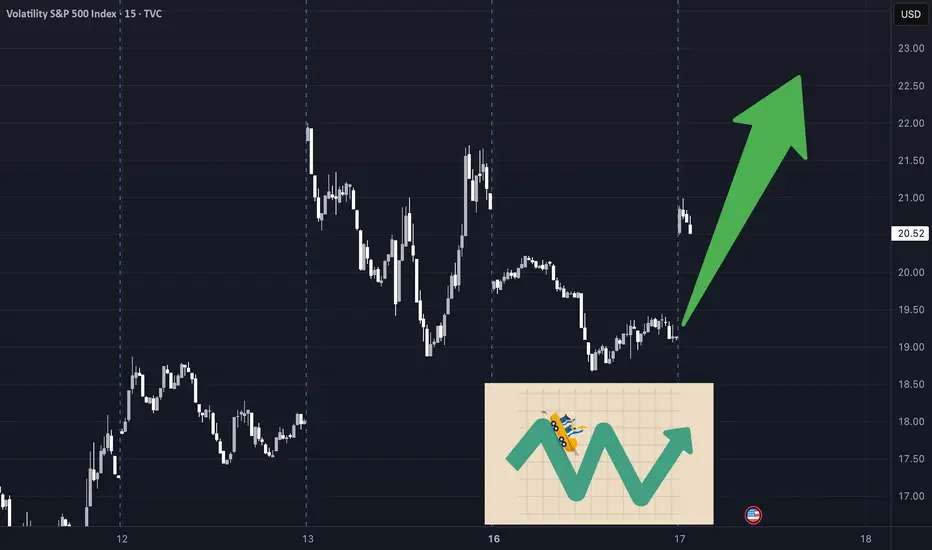
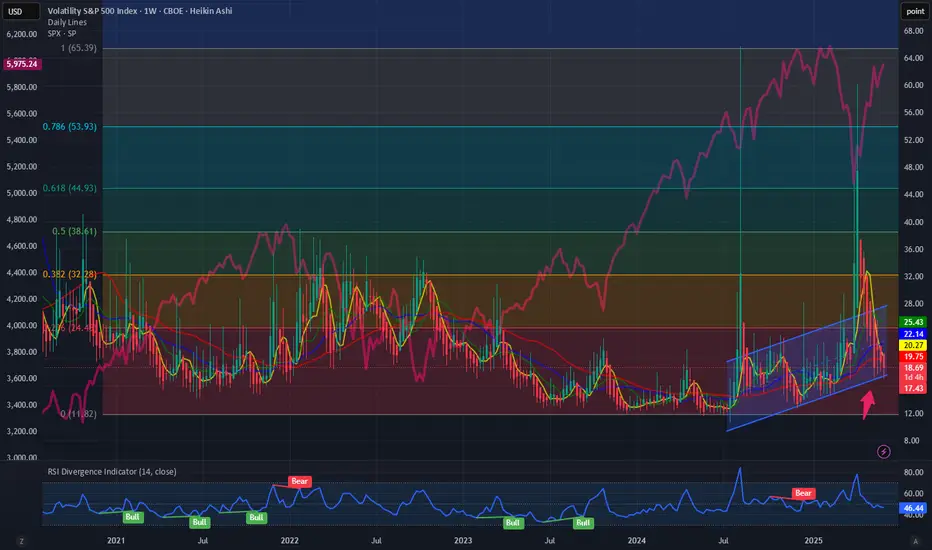
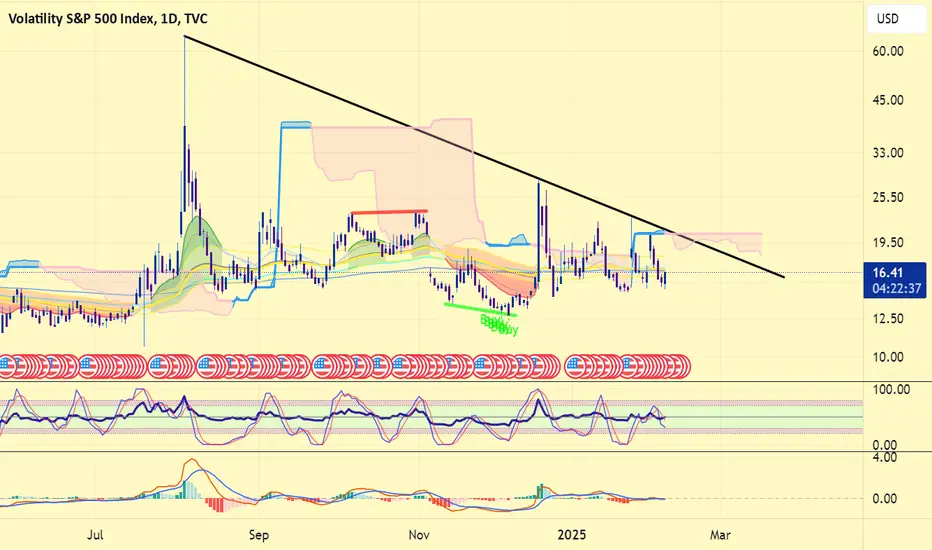
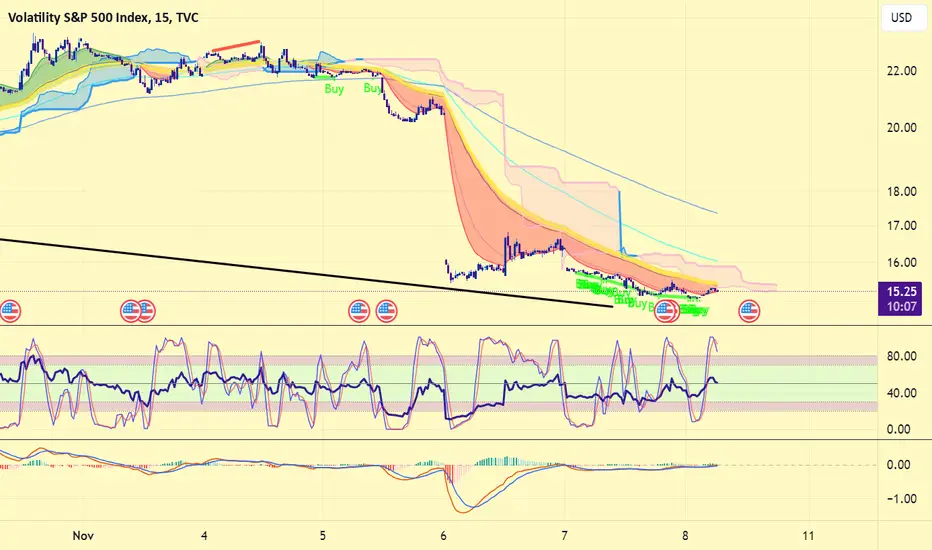
Quiet before the storm: $VIX eerily at low levels. TVC:VIX since the unusual April spike to 60 has been making new lows. It is surprisingly coincidental that the S&P 500 bottomed at 4900 @ which is 0.618 Fib retracement level if we chart the Fib level form the August 2024 spike to the lows of the Nov 2024. Since Feb 2025 highs have come down to 17. With VIX at 17 and SP:SPX almost 6000 which is 2.5% away from Feb 2025 ATH. And the disturbing part is that the TVC:VIX is very quietly going lower.
So how does the future look like. VIX can go down to the lows of 16 before it breaks down below the upward sloping. This can result in violent reversal. The reversal can result in that TVC:VIX spikes to levels of 24 and next level 32. TVC:VIX above 32 is always a very good opportunity to buy $SPX. There you have my suggestion for the pair trade.
Verdict : TVC:VIX can spike to 24 or 32 if the reversal trade takes hold. Go long SP:SPX with TVC:VIX @ 32.
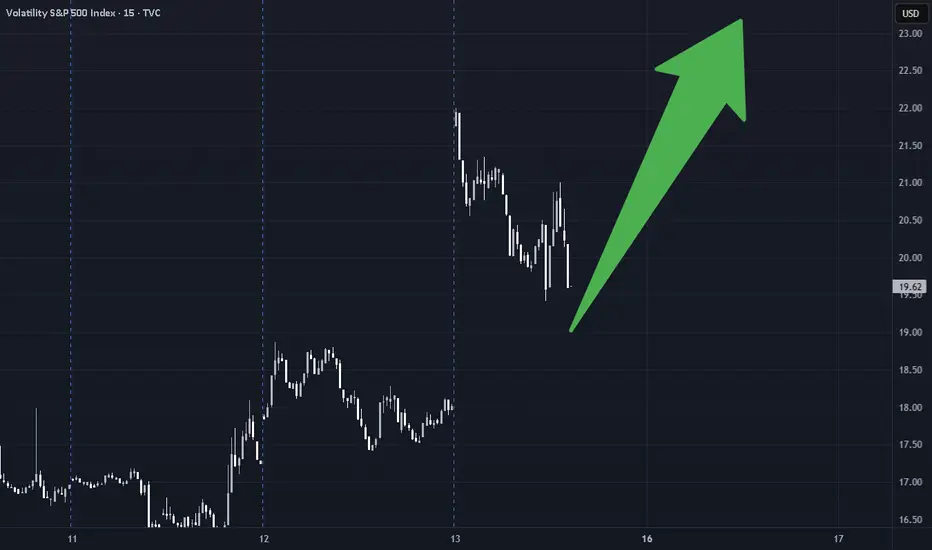
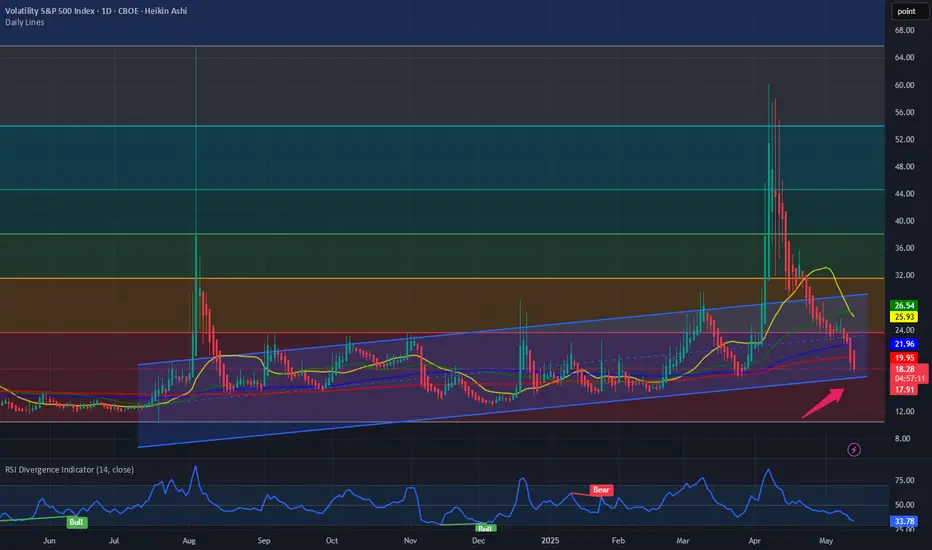
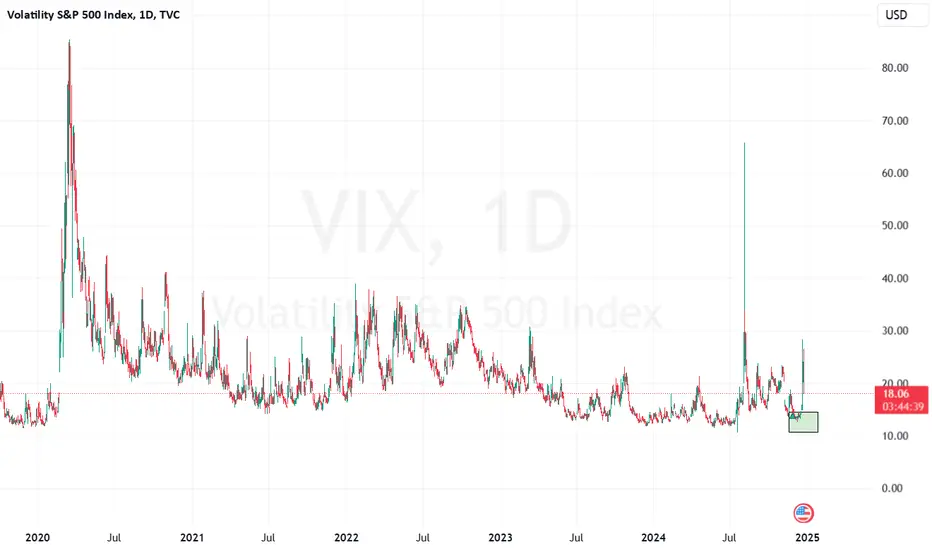
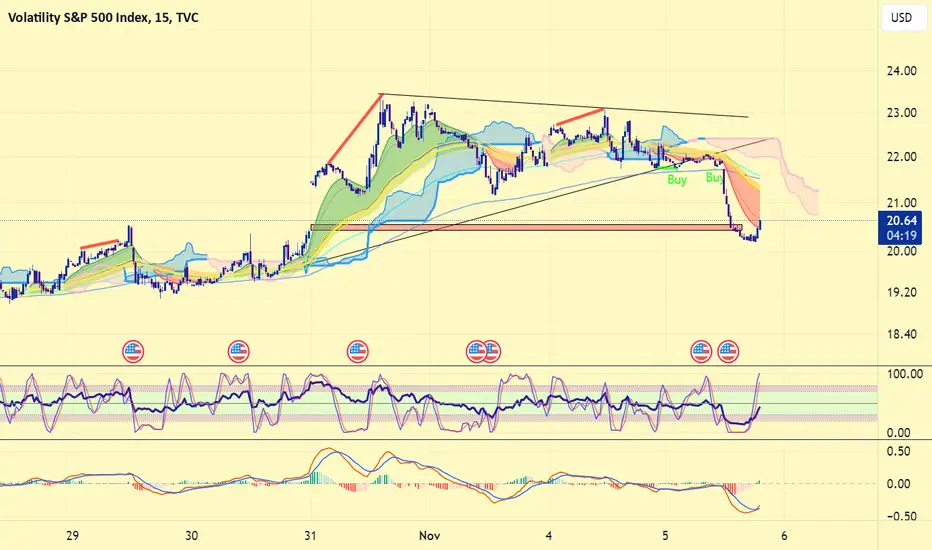
$VIX: Where does VIX go from here? Happy Tuesday. A new week, new market KPIs to look at. Since the ‘Liberation Day’ VIX spike to 50 it has been a bear market for VIX and has been going down since then. Since then, the S&P had more than 11 day of positive close for the day. This is which we would expect when VIX is making new lower highs and lower lows. But where does the VIX go from here?
It has been a remarkable trade to buy the indexes NASDAQ:QQQ and SP:SPX when the TVC:VIX is at or above 30. And then unwinding the trade when TVC:VIX touches 15. We have more than 10 days of positive closes in SP:SPX and the TVC:VIX is at 17. So we might have some more positive return in the near term. And then we rinse and repeat the same trade. Sell the indices when TVC:VIX touches 15 or lower band of this upward sloping channel.
Verdict: Stay long until TVC:VIX @ 15. Unwind trade and then wait for TVC:VIX @ 30.
VIX is a VIXjust having a little fun in a chat about how i chart the VIX. i say a VIX is a VIX. when we are spiking, we are spiking and we should become cautious if we don't know how to manage in that environment (intense bearish environment). this recent spike has proven that there are bullish moments that can be gleamed, but you have to be clear about your targets .
if someone has more to add about VIX royalty, please do share. otherwise, pick one to monitor if that is even your thing. no need to clutter your toolbox with VIX concepts... says me.
shout out to @BradMatheny. your work is amazing. thank you for sharing a bit here and there. i'm going to make time to learn more from you.
tootles

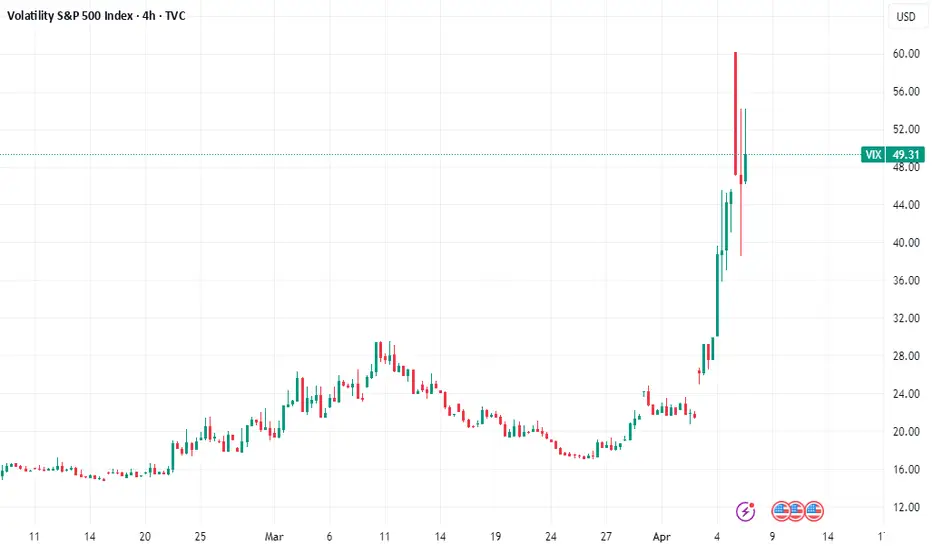
VIX Clips 60 as Market Volatility and Tariff UncertaintyThe VIX Clips 60 as Market Volatility and Uncertainty Surge on Tariff Announcement
The CBOE Volatility Index (VIX), often dubbed the “fear gauge,” surged past the 60 threshold this week—the highest level since August 5, 2023—as markets reacted violently to an unexpected announcement by the U.S. President regarding global tariffs. The sharp rise in the VIX, which measures market expectations of 30-day volatility, underscores the profound uncertainty now gripping investors, with the Dow Jones Industrial Average plummeting over 1,000 points and the S&P 500 entering correction territory. The trigger? A sweeping tariff policy unveiled by the administration on Liberation Day, a symbolic holiday marking a shift in economic strategy, which has sent shockwaves through global markets.
The VIX at 60: A Sign of Extreme Fear
The VIX typically hovers around 15-20 under normal conditions, reflecting moderate uncertainty. However, readings above 30 indicate heightened anxiety, and levels above 50 are rare, historically occurring during major crises like the 2008 financial collapse or the 2020 pandemic sell-off. This week’s spike to 60 marks a dramatic escalation, signaling a market gripped by fear. Analysts attribute this to the suddenness and scale of the President’s tariff announcement, which caught investors off guard after a period of relative calm.
The Liberation Day Tariff Announcement
On Liberation Day—a holiday commemorating historical freedoms—the administration announced a 25% tariff on a broad range of imports from key trading partners, including China, the EU, and others, effective immediately. The move, framed as a “national economic security initiative,” aims to curb perceived trade imbalances and protect domestic industries. However, its immediate impact has been severe:
Scope and Speed: The tariffs apply to $500 billion in goods, targeting sectors like semiconductors, automotive parts, and consumer electronics. The abrupt implementation, with no prior warning or negotiation, has left businesses scrambling to adjust supply chains.
Political Context: The announcement coincided with domestic political tensions, including debates over inflation and job creation. The White House argued the tariffs would “level the playing field” for American workers, but critics warned of retaliation and inflationary pressures.
Market Chaos: Sectors Under Siege
The tariff shockwave rippled across asset classes:
Equities: The S&P 500 fell 2+% on Monday, its worst single-day drop since March 2020. The Nasdaq, heavily weighted in tech stocks reliant on global supply chains, plunged over 5%.
Sectors: Semiconductor firms like Intel and AMD tanked, while automakers such as Ford and Tesla declined sharply.
Expert Analysis: A Volatility Tipping Point
Historical Parallels and Economic Risks
The current volatility mirrors past crises:
2008 Financial Crisis: The VIX hit 80 as Lehman Brothers collapsed, but the current crisis stems from policy, not financial contagion.
2020 Pandemic Sell-Off: The VIX spiked to 82 as lockdowns paralyzed economies, but today’s uncertainty is self-inflicted.
However, the tariff-driven uncertainty poses unique risks:
Inflation: Higher import costs could push inflation back above 4%, complicating the Fed’s rate-cut path.
Global Growth: The World Bank warns that trade wars could shave 2% off global GDP by 2025. Emerging markets, reliant on exports, face currency crises.
Looking Ahead: Can Calm Return?
Markets may stabilize if the administration signals flexibility. Potential pathways include:
Negotiations: A G20 summit in September offers a venue for de-escalation, though diplomatic progress is uncertain.
Policy Reversal: If tariffs are delayed or narrowed, the VIX could retreat. However, the President’s rhetoric suggests a hardline stance.
Corporate Adaptation: Companies might pivot to domestic suppliers, but such shifts take years, prolonging volatility.
Conclusion: A New Era of Uncertainty
The VIX at 60 marks a pivotal moment. Markets are now pricing in not just the immediate tariff impact but a broader shift toward protectionism and policy-driven instability. For investors, the path forward is fraught with uncertainty. While short-term volatility may ebb with reassurances, the long-term consequences—trade wars, inflation, and geopolitical friction—could redefine global economics for years.
With Liberation Day’s tariffs reshaping the landscape, one thing is clear: the era of low volatility is over. The question now is whether policymakers can navigate this new turbulence—or if markets will remain hostages to fear.
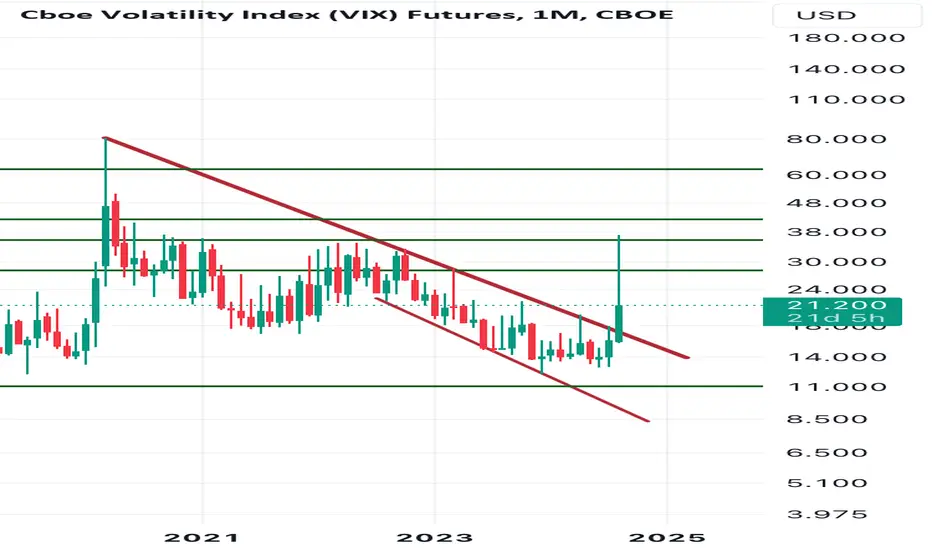
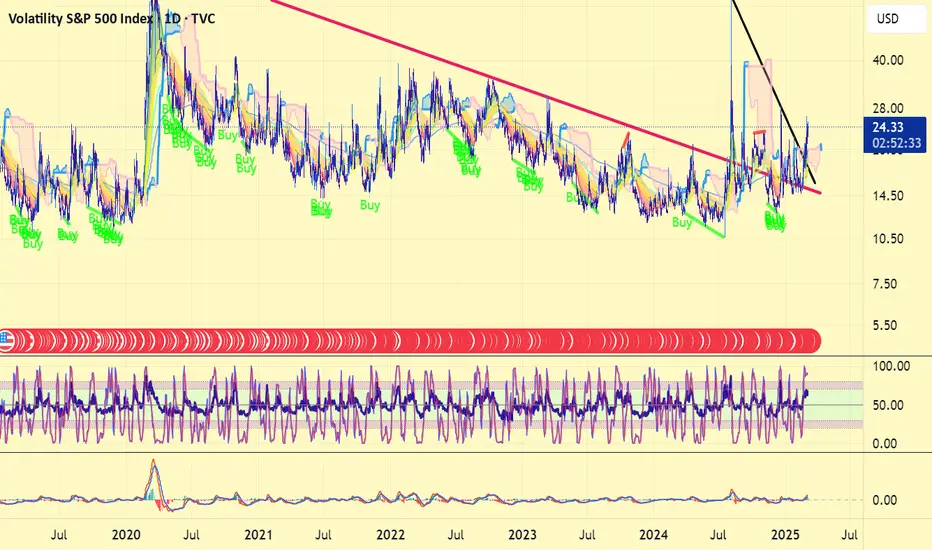
Greatest Volatility of all times is approaching...#vix the volatility index has been accumulating since covid 2020 crash. In higher time frame, TVC:VIX has broken out in 5th August 2024 and it was just a test!.. Then continued consolidation till this time , also doing the retest. at this zone, accumulation of the 2020 covid crash for a new impulsive wave!..
In lower time frame , several days ago VIX broke out the accumulation zone coming from 5th August and this warns you about your greedy positions my friends. We haven' t seen a real great volatility since covid crash and VIX chart is getting alarming. You' ve been warned. Not financial advice.
Temporary INVALIDATION: If VIX dumps below 13 zone , this will be more secure. Below 10 is the main invalidation.
VOLATILITY is loading...#vix the volatility index is gaining momentum for another strike to markets. Take care on your risky positions and assets like #stocks and #crypto
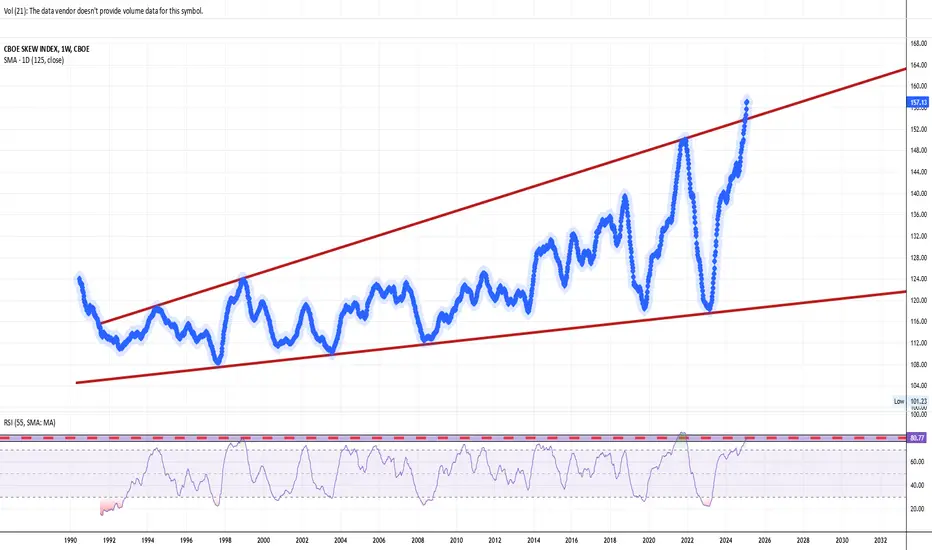
THE SKEWED GAMES. UNDERSTANDING CBOE SKEW INDEX (SKEW)The CBOE Skew Index (SKEW, or "BLACK SWAN" Index) is a financial metric developed by the Chicago Board Options Exchange (CBOE) to measure the perceived tail risk in the S&P 500 over a 30-day horizon.
Tail risk refers to the probability of extreme market movements, such as significant declines or "black swan" events, which are rare but have severe consequences.
Here's a detailed explanation of its role and implications in financial markets:
Key Features of the CBOE:SKEW Index
Measurement of Tail Risk. The SKEW Index quantifies the likelihood of returns that deviate two or more standard deviations from the mean. It focuses on outlier events, unlike the VIX (Volatility Index), which measures implied volatility around at-the-money (ATM) options.
Implied Volatility Skew. The index is derived from the pricing of out-of-the-money (OTM) S&P 500 options. It reflects the market's demand for protection against downside risks, which leads to higher implied volatility for OTM puts compared to calls.
Range and Interpretation
The SKEW Index typically ranges from 100 to 150.
A value near 100 suggests a normal distribution of returns with low perceived tail risk.
Higher values (e.g., above 130) indicate increased concern about potential extreme negative events, with heightened demand for protective options.
How It Works
The SKEW Index is calculated using a portfolio of OTM options on the S&P 500. The methodology involves measuring the slope of implied volatility across different strike prices, capturing how much more expensive OTM puts are relative to calls. This steepness reflects market participants' expectations of asymmetric risks, particularly on the downside.
To make a picture clear, we just simply use 125-Day SMA of SKEW Index. Since multi year high has occurred, market turbulence come as usual.
Practical Implications
Market Sentiment.
A rising SKEW Index signals growing fear of extreme downside risks. For example, during periods of economic uncertainty or geopolitical tensions, investors may hedge portfolios more aggressively, driving up the index.
Conversely, lower readings suggest calm market conditions with balanced expectations for future returns.
Portfolio Management
Investors use the SKEW Index as a barometer for hedging costs. High SKEW levels indicate that protecting against tail risks has become more expensive (and probably active).
It also helps traders assess whether market pricing aligns with their own risk expectations.
Historical Context
Historically, spikes in the SKEW Index have preceded major market downturns or volatility events, such as the "Flash Crash" in 2010, Bear market in early 2000s (dot com collapse), WFC in 2007-09, market falls in late 2018 and in 2022.
Complement to VIX
While both indices measure risk, they address different aspects: VIX captures overall market volatility, while SKEW focuses on asymmetry and extreme event probabilities.
Limitations
In summary, the CBOE Skew Index provides valuable insights into market participants' perception of tail risks and their willingness to pay for protection against extreme events. It complements other volatility measures like the VIX and serves as a critical tool for risk management and market analysis.
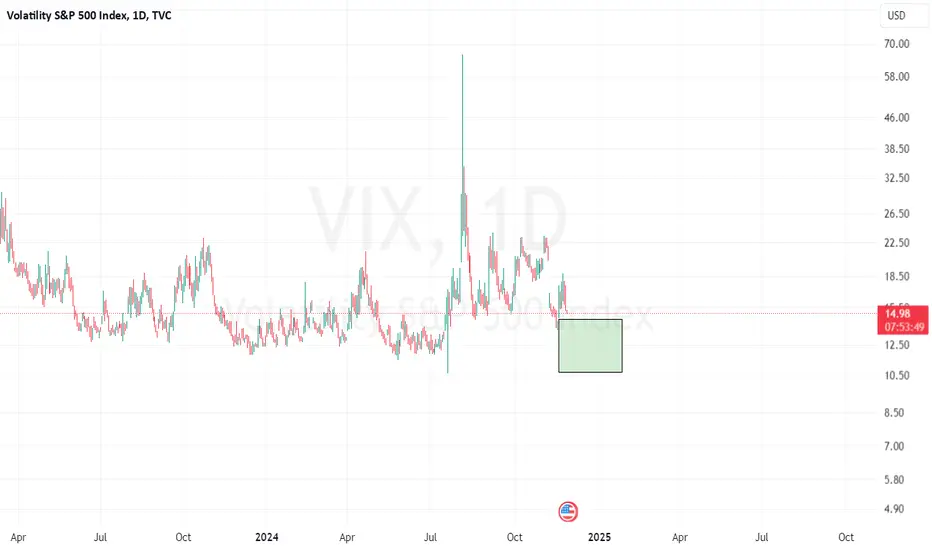
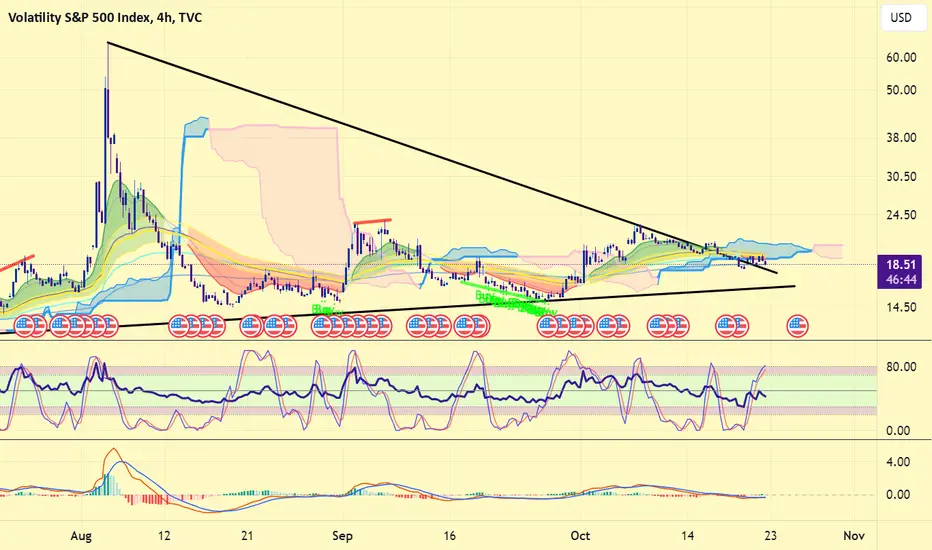
VIX Low Risk Zone still validatesAfter an excellent analysis and making money(some part of trade is still open), again any come back to the zone is an opportunity to buy...
Countdown to Mega Volatility?#vix #volatilityindex has been declined 2 times after 5th August top. The last declination was at US elections day. Now, it' s clearly seen that TVC:VIX has broke out the trendline resistance for 4 months!. With retest or without retest if this #vixindex is not a fake out, then a great volatility is expected in nearly all markets in short / mid term. A pump in index will surely damage nearly all markets. Avoiding high risky positions is recommended.

Long positions in low risk zone!!After an excellent analysis in VIX last time and make a lot of profit, VIX is coming back to the low-risk zone!!!
VIX 10% UP ?In most cases in history, the VIX index doesn't leave GAPS behind & tends to close them.
Will it happen again this time? Potentially 10% up. UVIX (2X Long VIX Futures ETF)
Only an idea and not a recommendation for trading

VIX GOING BACK UPAfter two false routes (the two white lines), we know for sure that VIX is to go up at some point to make up for the gap it made this week.
The only thing is we thought today's opening would be a higher gap compensating the precedent gap, but it kept getting lower and lower.
Now that we're approaching a low KL, there might be a new opportunity for a long entry, stay advised and always put a tight SL on this.

VIX has bullish signsAfter #nasdaq and stock markets pumped, TVC:VIX the volatility index came back to the retest zone. With this retreat #vix index is forming a bullish divergence and look ready to go. The bullish VIX = bearish #stocks and even #altcoins
VIX volatility index fills the gap, what now?#vix the volatility index has filled the gap shown on the chart as red box. Also TVC:VIX index has broken down the bull flag. But, the question is: "A fake down?"
If vix had did this as a fake movement (and only gap filling dump), then a great volatility awaits all markets, just soon.
#vix may cause correction in markets #vix TVC:VIX the volatility index is still retesting the breakout zone. After a successful retest' s ascending move will surely bring harm to all markets #nasdaq #spx #nikkei #btc #altcoins
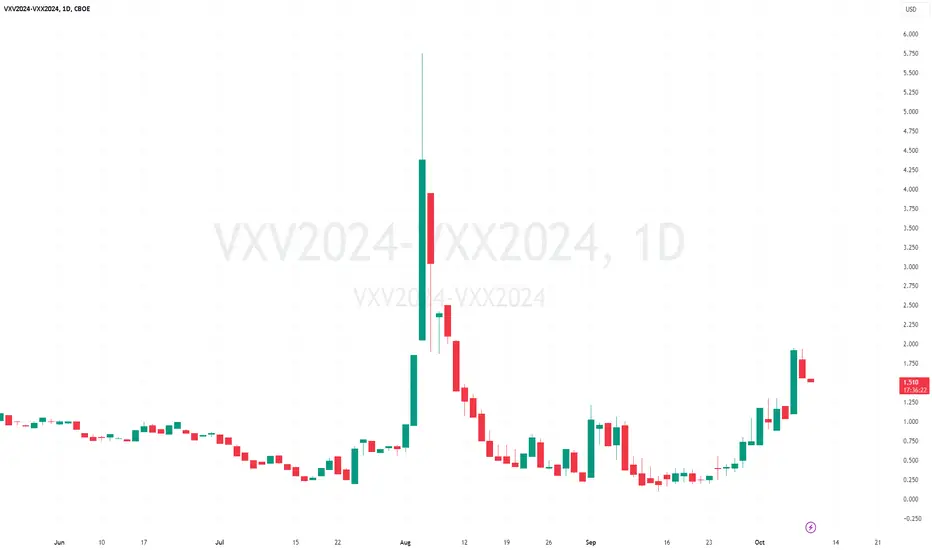
Using VIX futures to manage equity risk over the US Election One-way traders can look at expected volatility and movement in the S&P500 over the US election volatility is by looking at the premium or the differential that VIX October futures hold over VIX November futures.
Because the VIX index takes in a series of S&P500 options strikes that blend to create a 30-day implied volatility, the October VIX futures essentially looks at S&P500 volatility over the November US election.
Therefore, the higher the premium for VIX October futures over November futures, the greater demand for volatility over the election and the greater the implied movement in US equity markets.
This can be useful for traders who look at event risk and consider the propensity and extent of movement, and whether they want to hold exposures over that risk.
The code in TradingView to use is - VXV2024-CBOE:VXX2024
VIX Aug 12 2024VIX call inflows were huge today! Support held.
There is also a bullish reversal doji candle on the close.
Watch for the strong reversal to come next

VIX breaking the wedgeBroken the long term wedge (since 2020). These breakouts normally come with big corrections on the SPX