VIX will save you! Learn how to trade itHave been trading the VIX for years and it is absolutely gorgeous how well it performs when everything else tanks! Check out monthly spikes, it's trend, and cycles going back over 30 years. For details DM on the ABCs of using leverage without taking on any directly yourself and trading entry / exits with backtesting algorithmic support!
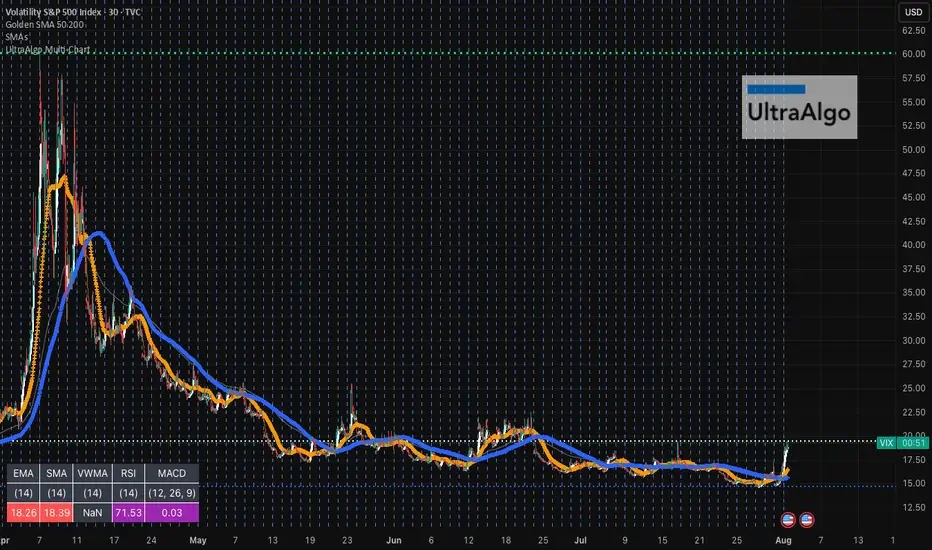
Soon we will get to the 20s and then it's when the fun begins....30s and 40s is very much a real scenario and the economy is doing far worse than people think. Most stocks are trailing below SMA 200 and only a dozen companies are holding the ship afloat. This is not sustainable!
The S&P is highly correlated, most in 5 years, which means that diversification has less impact. VIX has a beta of 0.1! Let that sink in, use it to your advantage before the massive correction happens. Not financial advise, always do your own due diligence, but have beaten the market multiple times over :)
Vixindex
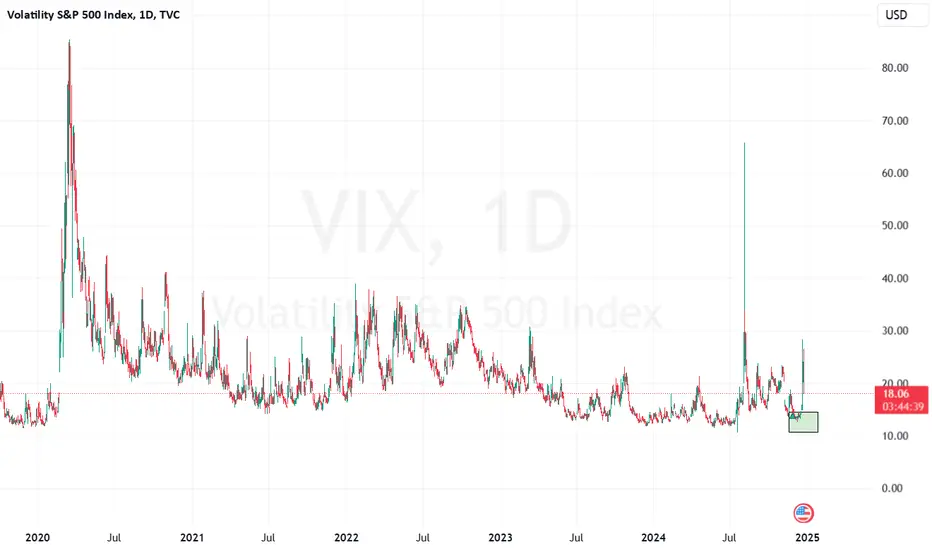
I told you so....VIX is the golden goose! All this fake pump in the market was just not sustainable. It is very clear that there are holes and the money printing can't last forever. The S&P fake pumps, and artificial tariffs (which Americans pay 90%) are created out of thin air. The reality is that defaults are very high across the board for most debt classes, VIX is at a YEAR LOW (doesn't happen to often, signaling massive complacency), and now the song will end and all the retailers will be holding the bag! Learn how to trade the VIX! DM me for details.
Always do your own due diligence, but historically this is a good time to get out :) You need to see and take action when you see red flags....
VIX Breakout: Forex Traders, Buckle Up for Volatility!🚨 VIX Surge: What Currency Traders Need to Know Right Now 🌪️💱
📊 Chart Context & Technicals:
The recent breakout in the VIX signals a major shift in global risk sentiment! 📈 The index has leapt off its base, showing markets are bracing for uncertainty. For forex traders, this is a flashing signal: volatility in equities often spills over into FX, amplifying moves in major pairs and risk-sensitive crosses. ⚡️
🌍 Geopolitical & Macro Backdrop:
This VIX spike is fueled by President Trump’s aggressive new tariffs on BRICS-aligned nations. 🏛️🔥 These moves have reignited global trade war fears, rattled equity markets, and triggered a broad risk-off wave. Historically, VIX surges = sharp swings in USD, JPY, CHF, and commodity-linked currencies. The USD, usually a safe haven, is now under pressure from both trade uncertainty and looming Fed rate cuts as the U.S. economy slows. 🏦📉
💱 FX Market Implications:
USD: The dollar is caught between safe-haven demand and worries over U.S. growth and deficits. Initial VIX spikes can boost USD, but ongoing trade tensions and dovish Fed signals are weighing it down. 💵⚖️
JPY & CHF: Classic safe-haven currencies! As VIX rises, expect flows into JPY and CHF, especially against high-beta currencies like AUD, NZD, and EM FX. 🗾🇨🇭
EUR, GBP, AUD, CAD: European currencies are outperforming in 2025, thanks to fiscal stimulus and capital inflows. Commodity currencies remain volatile, tracking risk appetite and global growth swings. 💶💷🇦🇺🇨🇦
🛠️ Trading & Strategy Takeaways:
Volatility = Opportunity: Elevated VIX means wider ranges and more frequent breakouts in FX. Prime time for breakout and momentum strategies, but demands tighter risk controls and dynamic position sizing! 🚦
Watch Correlations: Rising VIX typically strengthens JPY and CHF, while risk currencies (AUD, NZD, EM FX) weaken. USD direction is more nuanced—initially bid, but vulnerable to U.S. policy missteps and data misses. 🔄
Event Risk: With Trump’s tariff policy in flux and central banks diverging, expect FX volatility to stay high. Stay nimble around news releases and be ready for headline-driven whipsaws! 📰⚡️
🎯 Pro Takeaway:
The VIX is flashing a clear warning for currency traders: risk sentiment is deteriorating, and volatility is back in force. This environment rewards disciplined, adaptive trading—favoring safe-haven currencies, tactical hedges, and a readiness to pivot as policy headlines evolve. For those trading USD/JPY, EUR/USD, and cross-rates, expect bigger intraday swings and more false breakouts. Use the VIX as your real-time risk barometer and adjust your strategies accordingly! 🧭

Trading the VIX – Part 2Trading the VIX – Part 2: VIX ETPs and Strategic Applications
In Part 1 of this series, we explored the structure of VIX Futures, focusing on the roll-down effect in a contango VIX futures curve—common in calm market conditions.
In Part 2, we turn our attention to VIX-related Exchange-Traded Products (ETPs)—specifically, the popular and liquid:
• VXX – unleveraged long VIX ETP
• UVXY – leveraged long VIX ETP
• SVXY – inverse VIX ETP
Each of these products is based on a specific VIX futures strategy, the “S&P500 VIX Short Term Futures Index” , which is maintained by S&P, Dow Jones (the “SPDJ-Index”). The Fact Sheet and Methodology can be obtained from the S&P Global website.
What is the SPDJ Index that these ETPs track?
The SPDJ-Index is a strategy index that maintains a rolling long position in the first- and second-month VIX futures to maintain a constant 30-day weighted average maturity.
Key Features of the SPDJ Index:
• Starts with 100% exposure to VX1 (the front-month future) when it’s 30 days from expiration.
• Gradually it rolls from VX1 to VX2 (next-month future) each day to maintain a 30-day average expiration.
• At all times, the index is long either one or both VX1 and VX2, with exposure shifting daily from VX1 to VX2.
• This roll mechanism causes value erosion in contango (normal markets) and gains in backwardation (during volatility spikes).
• Since contango is the dominant market state, the index loses value over time—with occasional short-lived gains during sharp volatility increases.
Importantly, the SPDJ Index does not represent the VIX or any other volatility level, it simply reflects the value of this futures-based rolling strategy.
________________________________________
Breakdown of the ETPs: VXX, UVXY, and SVXY
VXX – Long SPDJ Index (1x)
• Tracks the SPDJ Index directly
• Suffers from the roll-down drag in contango environments.
• Useful only for short-term exposure during expected volatility spikes.
• Timing for long positions is critical
UVXY – Leveraged Long (Currently +1.5x)
• Replicates a strategy that maintains a constant leverage of 1.5 to the SPDJ Index.
• Formerly +2x leverage; reduced in April 2024.
• Highly sensitive to VIX moves; underperforms long term due to both roll-down drag and leverage decay (see below). Timing for long positions is even more important than for the VXX.
SVXY – Inverse (-0.5x)
• Replicates a strategy that maintains a constant exposure of -0.5 to the SPDJ Index.
• Benefits from falling VIX levels as well as from contango in the front part of the VIX futures curve.
• Formerly -1x before the Feb 2018 volatility spike triggered massive losses (XIV, a competing ETP, collapsed at that time).
• Performs well in calm conditions but is vulnerable to sharp volatility spikes.
Leveraged & Inverse ETPs – Important Notes affecting the UVXY and SVXY (without going into details):
• Daily resetting for the replicating strategies to maintain constant exposure factors (different from 1x) are pro-cyclical and can cause compounding errors, specifically in turbulent markets (e.g. Feb 2018).
• The real volatility of the VIX futures itself acts as a drag on returns, independent of the index’s direction.
• Risk management is essential—especially with inverse products like SVXY.
All three of these ETPs track a VIX futures strategy, they are not levered or unlevered versions of the original VIX index. Each of these ETPs benefits from liquid option markets, enhancing the toolkit for volatility trading.
Trading Strategies Using VIX ETPs
Here are several practical approaches to trading these products:
VXX and UVXY
• Best used for short-term trades aiming to capture volatility spikes.
• Options strategies such as zero-cost collars, vertical and calendar spreads can help mitigate the challenge of precise timing.
• Avoid long-term holds due to erosion from roll-down and leverage decay (see historical performance!).
SVXY – The Carry Trade Proxy
• Ideal for profiting from prolonged calm periods and the contango structure.
• Acts like a carry trade, offering a positive drift—but must be paired with robust stop-loss rules or exit strategy to guard against sharp spikes in volatility.
Switching Strategies
• Tactically rotate in/out of SVXY based on short-term volatility indicators.
• One common signal: VIX9D crossing above or below VIX, i.e. long SVXY if VIX9D crosses under VIX, staying long while VIX9D < VIX, closing long SVXY position when VIX9D crosses over VIX. Some traders also use crossovers with VIX3M or the individual expirations of the VIX futures curve to manage entries.
• Switching between SVXY and VXX based on crossover triggers through the VIX futures curve is often advertised, but very hard to get working in practice due to the importance of timing the VXX entry and exit – signals from the VIX curve may not signal VXX entries and exits timely enough.
Term Structure-Based Combinations
• Combine short VXX with long VXZ (an ETP tracking longer-dated VIX futures, balancing the 4th to 7th VIX contracts to achieve a constant expiration of 60days).
• Weighting is determined by the Implied Volatility Term Structure (IVTS), calculated as VIX / VIX3M. This approach adjusts positions based on the shape of the VIX futures curve, indicated by the IVTS. For instance, when the VIX futures curve shifts from contango (where near-term futures are cheaper than longer-term ones) to backwardation (where near-term futures are more expensive), it involves reducing short positions in VXX and increasing long positions in VXZ.
• This approach mimics the spirit of a calendar spread strategy in VIX futures and reflects the “S&P 500 Dynamic VIX Futures Index” , with weightings backed by research from Donninger (2011) and Sinclair (2013) - see performance chart and weighting-matrix enclosed in the introductory chart).
________________________________________
VIX Curves as Market Indicators
Beyond trading, VIX instruments and their term structure are widely used as market sentiment gauges. For instance:
Signs of Market Calm:
• VIX9D < VIX
• VIX < VIX3M
• VIX < VX1
• VX1 < VX2
These relationships imply that short-term volatility is lower than longer-term expectations, indicating near-term calmness in markets, occasionally leading to market complacency.
Traders and institutions use these signals to:
• Adjust positioning in broad market indices
• Determine hedging requirements
• Evaluate suitability of selling naked options
________________________________________
Final Thoughts
VIX ETPs offer a powerful toolkit for traders seeking to profit from or hedge against volatility. But they come with structural decay, leverage dynamics, and curve risk. Timing, strategy, and risk control are key.

Market Open: VXX Pops...This morning, the VIX popped to $19.26, not seeing levels like this since the Jan. 27th, 2025 jump to $19.93, where the SPY saw an almost 3% drop, NASDAQ dropped 5%.
We saw concerns of heightened market uncertainty, with investors weighing robust consumer spending against mixed economic signals. There were murmurs that the subdued durable goods orders and emerging signs of slowing GDP growth might signal that the current momentum is hard to sustain. Additionally, dovish cues from the Fed—which hint at a more cautious approach to rate hikes—raised questions about whether these measures could ultimately mask underlying inflationary pressures and economic challenges.
On the corporate front, the market was further rattled by underwhelming earnings reports from several key technology players, a sector that had previously driven much of the market’s optimism. This divergence in performance—where defensive sectors such as consumer staples and financials held their ground while growth stocks stumbled—added to the overall anxiety.
Finally, the backdrop of ongoing geopolitical tensions and sporadic trade disputes continued to contribute to a risk-off sentiment, ensuring that market volatility remains elevated.
Follow us for more Financial & Investment News at @MyMIWallet

VIX is dying and the markets are flying!TVC:VIX NASDAQ:QQQ AMEX:SPY
Do you see now!👀
Yesterday I posted about the TVC:VIX making a bear flag pattern and showed you what's happened the last two times!
The VIX is dying and the markets are flying! The TVC:VIX has a lot more room to the downside as well.
You know what that means! 🚀

$VIX: THE FED FUD'STERS ARE AT IT AGAIN! THE FED FUD'STERS ARE AT IT AGAIN! 🛑
All I have to say is the TVC:VIX is forming a beautiful Bear Flag right now! Look what's happened in the past!
Bear flags form then break to the downside and we plummet. Stay patient friends!
Not financial advice

VIX Low Risk Zone still validatesAfter an excellent analysis and making money(some part of trade is still open), again any come back to the zone is an opportunity to buy...
Countdown to Mega Volatility?#vix #volatilityindex has been declined 2 times after 5th August top. The last declination was at US elections day. Now, it' s clearly seen that TVC:VIX has broke out the trendline resistance for 4 months!. With retest or without retest if this #vixindex is not a fake out, then a great volatility is expected in nearly all markets in short / mid term. A pump in index will surely damage nearly all markets. Avoiding high risky positions is recommended.

VIX Aug 12 2024VIX call inflows were huge today! Support held.
There is also a bullish reversal doji candle on the close.
Watch for the strong reversal to come next

Bitcoin vs. SPY: A Comparative AnalysisIn the ever-evolving world of finance, Bitcoin (BTC) continues to make headlines as a disruptive force in the global economy. As of August 10, 2024, a comparative analysis between Bitcoin (BTC/USD) and the SPDR S&P 500 ETF Trust (SPY) reveals fascinating insights into how the world's leading cryptocurrency stacks up against a traditional benchmark of the U.S. stock market.
The Weekly Chart: A Long-Term Perspective
The weekly chart for Bitcoin (BTC/USD) from Coinbase, as seen on TradingView, provides a long-term view of Bitcoin's price movements over the past several years. From its early days of relative obscurity to its meteoric rise in recent years, Bitcoin has become a staple in the portfolios of both retail and institutional investors. The chart highlights several key price points and trends, with the most recent data showing Bitcoin trading at approximately $60,422.92. This marks a notable recovery and a 3.94% increase over the past week.
This growth is particularly interesting when viewed in the context of Bitcoin's historical volatility. The chart clearly illustrates Bitcoin's cyclical nature, with periods of rapid growth followed by sharp corrections. Yet, despite the volatility, Bitcoin has shown resilience, consistently bouncing back from lows to reach new highs.
Bitcoin vs. SPY
To further understand Bitcoin's performance, it's crucial to compare it against a traditional benchmark like the SPDR S&P 500 ETF Trust (SPY), which tracks the S&P 500 Index—a key barometer of the U.S. stock market.
The "Asset vs Benchmark" table on the chart provides a detailed comparison of Bitcoin and SPY across multiple timeframes, including 1 day (1D), 1 week (1W), 1 month (1M), 3 months (3M), 6 months (6M), and 1 year (1Y). Here's a breakdown of the performance:
1 Day (1D): SPY shows a modest gain of +0.44%, while Bitcoin has experienced a slight decline of -0.72%. This short-term fluctuation is a reminder of Bitcoin's higher volatility compared to traditional assets.
1 Week (1W): Bitcoin shines here with a 3.94% gain, compared to SPY's marginal increase of 0.02%. This suggests that Bitcoin has been more responsive to recent market dynamics, potentially driven by macroeconomic factors or developments within the cryptocurrency space.
1 Month (1M): Over the past month, Bitcoin has underperformed with a -6.48% decline, while SPY saw a -3.24% drop. While both assets have struggled, Bitcoin's higher volatility is once again evident.
3 Months (3M): The 3-month data shows a similar pattern, with Bitcoin down -3.58%, compared to SPY's -3.24%. This alignment suggests that broader market trends have impacted both assets, though Bitcoin remains more sensitive to these movements.
6 Months (6M): Over the last six months, Bitcoin and SPY are almost neck and neck, both down -3.58%. This parity highlights the global economic challenges that have weighed on both traditional and digital assets.
1 Year (1Y): The 1-year performance paints a different picture. Bitcoin has surged ahead with a remarkable 42.88% gain, vastly outperforming SPY's 12.14% increase. This underscores Bitcoin's potential as a long-term growth asset, particularly in a year marked by inflation concerns and market volatility.
The Broader Implications
This analysis underscores several key points for investors:
Volatility as a Double-Edged Sword: Bitcoin's higher volatility means that while it can deliver substantial short-term gains, it also carries greater risk. Investors need to be prepared for significant price swings and should consider their risk tolerance when allocating to Bitcoin.
Diversification Potential: Bitcoin's ability to outperform traditional assets like SPY over the long term highlights its potential as a diversification tool. By adding Bitcoin to a portfolio, investors can potentially enhance returns while also increasing exposure to the rapidly growing digital economy.
Macroeconomic Sensitivity: Bitcoin's performance is increasingly influenced by global macroeconomic factors, much like traditional assets. This alignment suggests that Bitcoin is becoming more integrated into the broader financial ecosystem, making it a more relevant consideration for mainstream investors.
Conclusion
As Bitcoin continues to evolve and mature as an asset class, its role in the financial markets is becoming increasingly significant. The recent data showing Bitcoin's outperformance over SPY on a 1-year basis is a testament to its growing relevance and appeal. However, investors must also be mindful of the risks associated with Bitcoin's volatility and consider a balanced approach when incorporating it into their investment strategy.
In an era where digital assets are gaining traction, Bitcoin remains at the forefront, challenging traditional notions of value and investment. As the financial landscape continues to shift, keeping an eye on the dynamic between Bitcoin and traditional benchmarks like SPY will be essential for understanding the future of finance.
Disclaimer: This article was generated with the assistance of artificial intelligence (AI). While AI can provide valuable insights, it is important to verify the information and consider consulting with a financial professional before making any investment decisions. The content should not be considered financial advice. The information provided may contain errors, inconsistencies, or outdated information. It is provided as-is without any warranties or guarantees of accuracy. We disclaim any liability for damages or losses resulting from the use or reliance on this content.

VIX vs Autofib StrategyAutofib seems to do bad for the VIX index on red market days. As always, none of this is investment or financial advice. Please do your own due diligence and research.

$VIX 's strong chart indicates an incoming volatility#vix volatility index chart made double bottom and W bounced. The bullish movement will likely continue even more while the chart made bullish flag in lower time frame.
Also recent days #dxy dollar index chart made a bullish breakout and while VIX and TVC:DXY are both getting stronger, this will not likely be good for #btc #altcoins #stocks etc. I think something is cooking... Better not to be over greedy. Not financial advice.
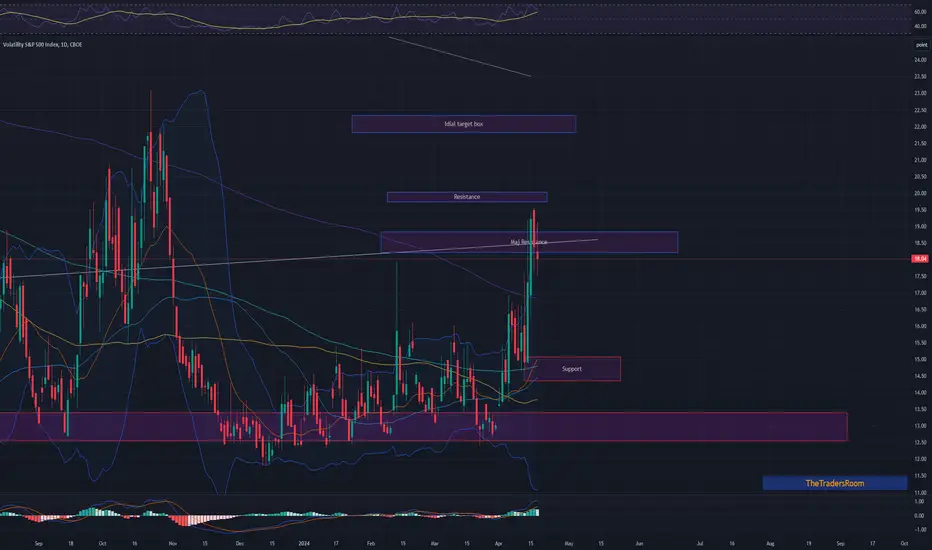
VIX Apr 17th updateVIX is holding its resistance; expect a dive down to the 15.50-16.50 level
Maj resistance box is holding well and the price is in topping formation
VIXPair : Volatility S & P 500 Index
Description :
Consolidation Phase in Long Time Frame
Completed Impulsive Waves " 123 " Impulsive Waves
Break of Structure
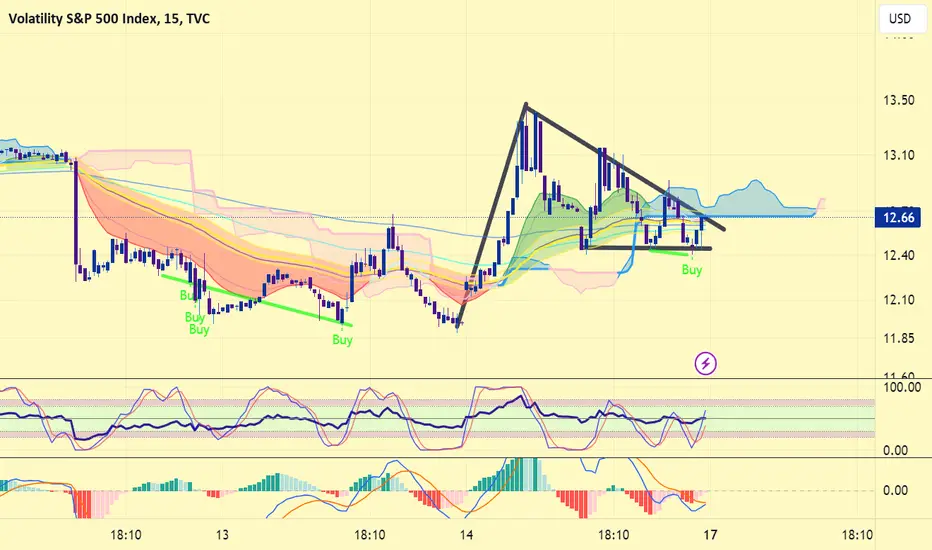
Symmetrical Triangle as an Corrective Pattern in Short Time Frame with the Breakout of the Lower Trend Line and Retracement
VIX UPDATEAttention Wolfy Traders: Please be advised that our VIX index is currently decreasing. This indicates that there are brave traders in the market who are not afraid of risk. As a result, the price action in every chart can be fast and volatile. Therefore, it is important to keep this in mind and exercise caution when making trades."
PLAY PRO

Volatility S & P 500 Index Next MovePair : Volatility S & P 500 Index
Description :
Completed " 123 " Impulsive Wave
C & H
Bullish Channel in Short Time Frame as an Correction
Fibonacci Level - 78.60% / 100%
Demand Zone

Observing VIXNow a lot of people are posting long ideas that it will blow up.
I am framing this idea as neutral.
Since we have a contradiction.
Consider.
1. The Heikin Ashi weekly candle is consolidating by breaking through a bullish wedge. Yes, it is definitely a very reversal pattern.
2. Two small Kumo clouds (both red and green) are floating over candles. Their size tells us that we don't have much resistance at this level. The Tenkan and Kijun lines are below the clouds, but that's not that important in this situation. What is more important is that the indicator is drawing us a declining red Kumo cloud and we can't tell if it will progress down further. Sometimes these "little red cloud, little green cloud, expanding bigger red cloud" constructions are a very implicit threat. We don't know how much its lower boundary will drop before it marks its end...And note again, this is a weekly chart, not some 4 hour chart...We'll have to watch all spring to see what happens.
3. Next. SQZMOM shows descending red bars and two gray crosses, which we have not seen for a long time. This does not augur well for the upside. In fact, on the weekly Heikin Ashi grey crosses were 3 years ago... Only with green bars and they worked out in full... SQZMOM tells us about weak growth prospects of the VIX.
4. However, we see a hidden bullish divergence on Stochastic RSI. This comes into contradiction with point 3.
5. I also looked at the latitude indication which indicates that the highs have started to dominate the lows. This is a bullish sign. But it is also inconsistent with points 2 and 3.
We'll just have to watch to see.
32.4 level is extremely important.

VIX: Another Warning Sign!Hello friends, today you can review the technical analysis idea on a 1M linear scale chart for the Volatility S&P 500 Index (VIX).
In this chart, you can see the VIX moving along a support trendline. When the VIX spikes upwards that means the markets (specifically S&P 500; generally all markets) start to move downwards. Every few years the VIX starts to slowly move upwards on a new support and resistance trend line before coming back down to the bottom support line. The current structure of the VIX looks very similar to the formation of the Great Recession so I show that on the chart as a possibility. I also note two support and resistance lines which the VIX could move on as it moves higher. Lastly noted is the RSI which is moving up a support line. This is a monthly chart so have some patience.
I may be completely wrong with the prediction of the VIX moving higher, but with the inflation issue, global economic condition, stock markets crashing, companies preparing for a downturn, interest rates moving higher, the US Dollar Index (DXY) moving higher and crypto market crashing, I would assume my prediction may be on point.
Click on the chart below on why I exited the crypto and stock market in December 2021:
If you enjoy my ideas, feel free to like it and drop in a comment. I love reading your comments below.
Disclosure: This is just my opinion and not any type of financial advice. I enjoy charting and discussing technical analysis. Don't trade based on my advice. Do your own research! #cryptopickk

VIX is self-explanatory viewIts just a matter of time, and that time is coming up very soon!
We have very successfully shorted Fri close and covered in pre-market today!

VIX💥1D -TIMEFRAME ANALYSISVIX💥1D -TIMEFRAME ANALYSIS
💗Hello ladies and gentlemen
This is my new idea for 💥VOLATILITY S&P 500 INDEX
I hope my idea is clear
Support me by like and share thank you
Stay Safe💯💲💲💲
Good luck💰😍

Will history repeat again?Look at the VIX chart here; we are again in the VIX 18th zone. In 2022 it was an excellent indicator to spot the bottom; it works during the bear markets only!
So if we are still in a bear market, it should bounce from the 18 level hard and Indexes to fall. If we are entering a bull market, this setup can fail right here.
I doubt it will fail until we see Q1 lows in markets. I might be wrong, and this setup can fail in a grand style.
The VIX bottoms have an excellent correlation with SPX highs (at the bottom orange colour); look for the yellow marked pointers for the 2022 patterns from VIX 18 level. I think we will repeat the same pattern again.

VIX is reapeating the patternA rule of 2 gives a perfect VIX long setup into Q1 on 2023 rally.
The markets are not over with the downside and VIX didn't get even one bottoming signal in 2022. It was intermediate bottoms, but no panic
Im going to add more VIX calls, Apr expiration this coming week.
Its in consolidation mode and should end soon with the breakout
