Weekly Volatility ReadGood Evening --🌗 🌕🌓
I hope everyone is having a relaxing weekend with friends and family alike because soon we will be in the thick of the price action again -- and it may get spicy! Let't us dive in as we review what happened last week and we look towards the next to trade range or observe.
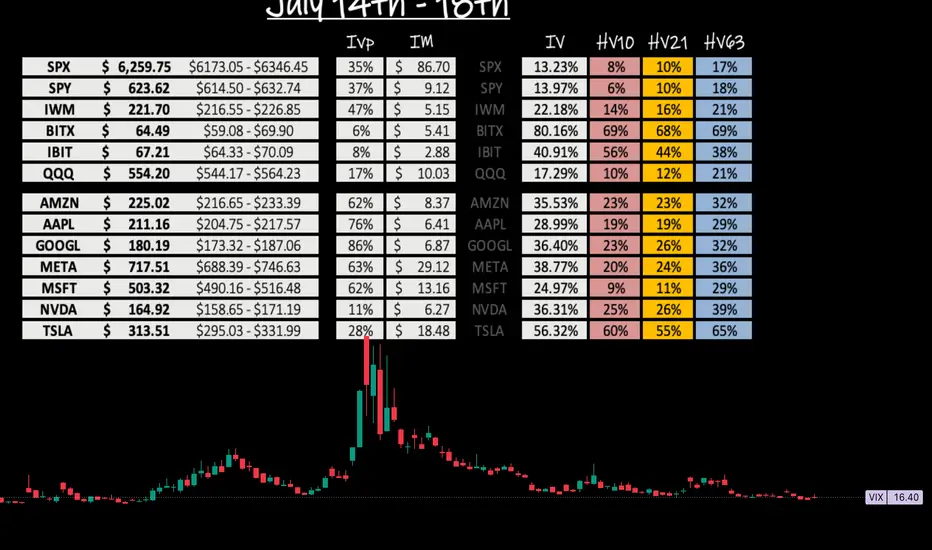
The CBOE:SPX opened the week fairly slow at $6,193.18 and increased throughout the week wicking up to a new ATH of $6,315.61 only to close the week off at $6,267.28 -- This leaves the IM on the week +$83.10. This closest respects the quarterly implied range that was a 'strength of IV' of 129.30%.
Now looking towards this next week we have extremely low HV across the board in the broader markets. CBOE:SPX IV (13.14%) is trending 32% IV percentile on the year -- premium is seemingly cheap. HV10 (6.97%) is coiled within 97.67% of it's sliding yearly lows, showing a need for short-term volatility to consolidate. HV21 (7.78%) is even more coiled to it's yearly low at 98.76% respectively. Both are roughly mid 50% 'strength to IV' as IV predicts twice the potential move next week.
Lastly, HV63 our quarterly trending values is showing a 'strength of IV' at only 108% but, could be supporting the thesis IV is projecting, as we do need a TVC:VIX pop OR time-wise consolidation. 📈📉
I hope everyone has a great week trading ranges and I will see you next weekend!
Cheers! 🍻🍻🍻
Volatility-prediction
Weekly Volatility Snapshot Good Evening --
I hope everyone is having a restful weekend and enjoying your time away from markets. Always appreciate it while you can, and spend that precious time with loved ones. Now, let us review the price action last week as we look towards our expectations for the coming trading sessions.
The CBOE:SPX opened the weekly candle at $6,126.15 and closed $6,252.50 -- this respectively puts the weekly move at +$126.35. This is slightly above what IV was stating entering the week. We are starting to see seasonality set in as the markets top and look for consolidation. The TVC:VIX dropped throughout the week putting a bottom in at $15.70 which shows volatility creeping to it's lowest point year-to-date.
We should all expect a volatility bounce in the near future as the run the broader markets have made out of the steep correction needs to cool off before moving forward. Below is my volatility read for the S&P 500. You will see that HV10 (7.94%) is coiled within 3.30% of its sliding yearly lows. This tells me between the low sentiment in fear and the low volatility in short-term trends, we need to cool off a little.
Now looking towards this week, I see the broader markets consolidating and even selling off in order to reset the overbought 'lagging' indicators and pop the VIX up a little bit. The administration has pushed the trade deal deadline off till AUG 1st providing some relief to the markets but, has also created more uncertainties with tariff letters that went out Friday.
Look for a negative news cycle sparking up Sunday night into Monday, potentially creating momentum downwards. However, I believe we stay in range of what HV10 weighted to IV implies -- $6,207.72 - $6,311.78. This range holds a divergence from IV of 5.29% and and price gap difference of -$17.32. To me, this says that what is short-term trending is 'contractive' to what IV states.
That's all for this week. Stay hedged against your bias always and remember to practice your ABCs -- If you like what you are reading and love volatility range analysis as much as i do -- feel free to drop me a comment and ill get back to you! Till next time, Cheers!
BITx -- Weekly Volatility SnapshotHello Bitcoin community 🤠👾🤑👾🤠
Good morning/Good afternoon, maybe goodnight to you pending where you are in the world!
Nonetheless, I'm glad you found me because here we are going to look over our weekly historical volatility ranges on CBOE:BITX and assess where IV is in perspective to what's trending. Then we will talk targets within my custom adjusted implied weekly ranges.
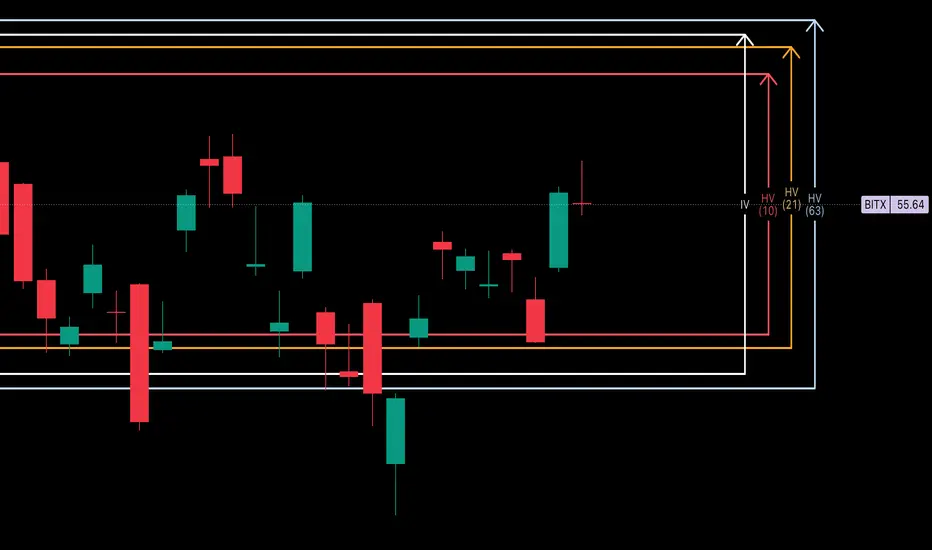
Entering the week, IV (76.86%) is projecting +17.74% more than what short-term trending markets are showing with HV10 (59.12%) holding a 'strength of IV' of only 76.91%. This is a price differential on the week of -$1.19. Our monthly values with HV21 (71.20%) are hinged slightly below IV, showing a 'strength of IV' slightly more at 92.64%.
In my opinion looking towards this week, IV may be painting the bigger picture of price distribution upwards towards quarterly trends. It is expansive from past weeks and above short-term trending markets with a wider range and with IV percentile slowly creeping up.
If the trend holds that started last week, my price target will be HV63 at $61.07 which draws confluence with the correction impulse wave top of $60.39 -- a price action to implied calculation difference of only +/-$0.69. Fantastic , right?!? This would take BTC approaching new ATHs again. If price action can find quarterly trends we will be seeing a 'strength of IV' of 108.44% -- only slight advantageous over IV premium.
In the end, markets are unpredictably wild and we can only assess and reduce our risk using the tools provided. Always remember your ABCs and to hedge your bias! Come back next week as we recap how the weekly volatility unfolded.
Cheers!
AAPL - Weekly HV/IV PerspectiveGood evening —
I wanted to do one more write up with that being on NASDAQ:AAPL as we enter the week with futures just opening.
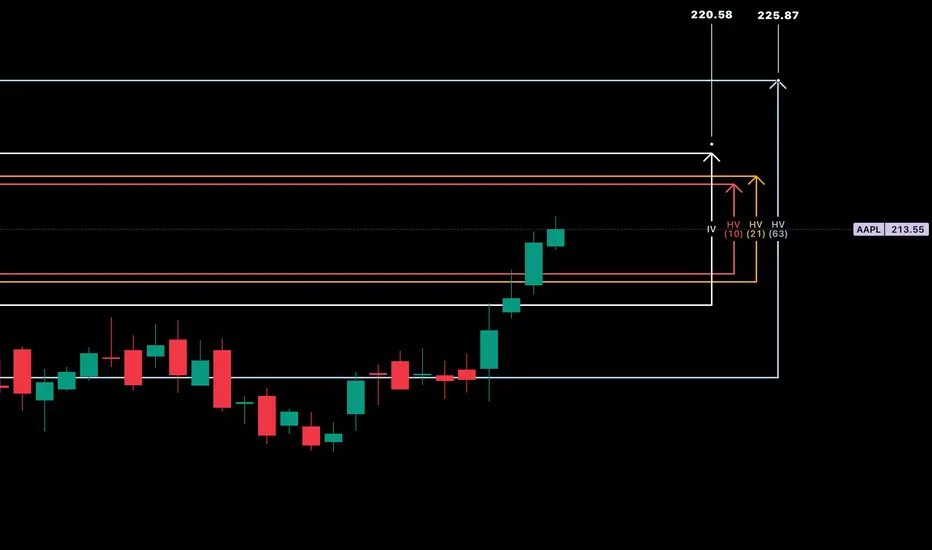
HV10 (16.58%) is trending -11.56% below IV (28.14%) showing a weekly price gap differential of -$2.89 on the stated implied move to what trending markets are doing. This current IV value entering the week sits 69% within the sliding year spectrum.
Now, with Apple consolidating in range for almost eight weeks after selling off when it reached its 4T milestone in December of 2024, has now begun advancing back upwards in price. The strength here is obvious and the quality of company is well, Apple.
My price targets on the week is first the upper band of stated IV ($220.58) then moving on towards the upper implied range of HV63 ($225.87). I believe the markets are going to push apple higher while balancing the indices out selling off in other areas. This would start to accelerate HV10, as it is now 91.23% coiled to its yearly lows and needs to unwind. Hopefully with a few short-term trending days increasing we find our regression.
Please come back next week and see how our position and volatility progressed forward.
Weekly Volatility SnapshotGood Evening -- Happy July 4th to everyone
Let us review last week as we look towards the next in anticipation of the trade deal deadline that looms. I had a target on the SP:SPX of $6,253.59 and the weekly high was $6,284.65. The candle on the short week opened at its low of $6,019.21 and closed $6,233.08 making the weekly range +$213.87. This represents closest to HV63 over IV which stated +/-$253.26 and a 'strength of IV' that was 295% . Again the weekly high is above our range target, but my volatility will always be measured close-to-close.
Now as we look towards this week --
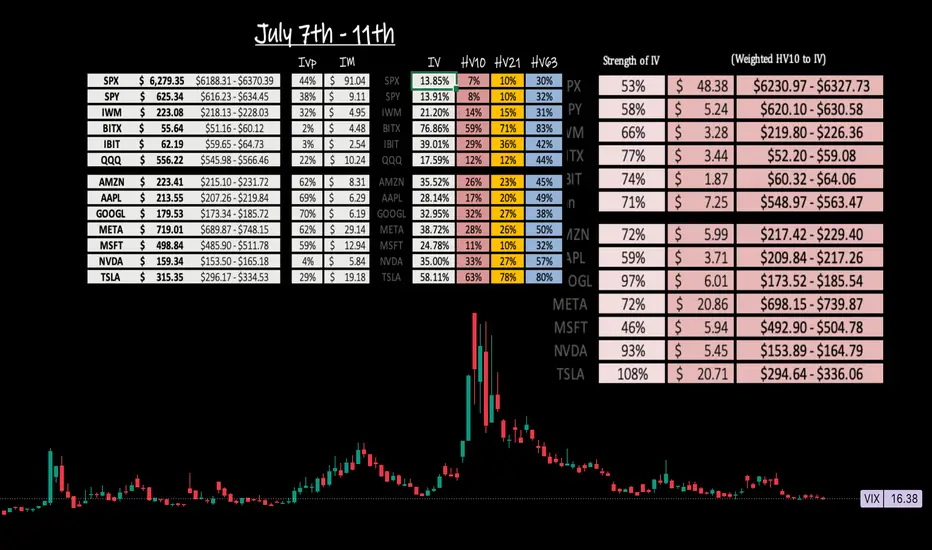
IV (13.85%) has shifted upwards slightly with HV10 (7.36%) hinged down and still lowering. In fact, I have bi-weekly volatility as 97.28% 'coiled' to it's sliding yearly low of 4.64% -- HV21 (9.92%) is closer to what IV states with it being 'coiled' 96.61% to it's respective sliding yearly lows.
In my opinion, volatility still has room to consolidate slightly as markets rotate higher. I think we can see upwards $6,327.73, but slowly over the course of the week with the last tariff uncertainty getting out of the way. From there, going into mid July we may need to see a volatility spike. The HV10 range I am watching holds a 'strength of IV' entering this week of only 53% -- this shows the price per move is expensive by almost twice as much.
Till next time, know your ABCs, have a great long weekend, and stay hedge!
CHEERS
Weekly Volatility SnapshotGood Morning -- ☀️☀️☀️
What an amazing last full week of June that was as we pulled out of corrective territory and onto new ATHs with the SP:SPX body of its weekly candle moving +3.41% -- bottom to top. The weekly move open-to-close was +$98.40 as that is how I gauge my volatility metrics. This in comparison is closest in value to IV entering the week as it was stating an implied move of +/-$102.08, which was a volatility read of 16.34% -- As you see in reflection of the weekly chart below and within daily candle structure, price action moved upwards all week surpassing quarterly marks. This in turn is raising short-term volatility and lowering monthly averages as we rotate higher.
Here is the weekly price action of the TVC:VIX from a 5m perspective. This is showing the EOW trend break upwards drilling the indices back down -- A healthy pullback after being seemingly over-extended. This happened during the news cycle release of the U.S. and Canada reciprocal tariff disagreement. Hopefully this settles over the weekend and we rotate higher into the 4th of July week.
Now looking towards this holiday week -- We have the SP:SPX IV (13.29%) after melting during the ATHs move previously -3.09% -- This places IV on the sliding yearly spectrum at the 39% down range showing increasing discount in yearly value. Remember, If you form option positions IV affects VEGA 1% at a time and the algos bid down IV in contracting markets as they rotate higher. HV10 (12.46%) has hinged down and still is contractive per IV prediction but, increasing in comparison with a ' strength of IV ' now showing 94% entering this week.
As the TVC:VIX has closed at $16.32 -- I believe that there is still a little room to extend potentially upwards to the HV10 weekly range of $6253.59. Currently, the SP:SPX YTD return is +4.96% with weekly momentum pointing up and room for volatility to still decrease. If this mark is reached it would put the YTD return at +6.52%. Very feasible and realistic being halfway through the year and going into the 4th of July 🇺🇸🇺🇸🇺🇸🇺🇸 Watch as we climb the wall of worries around us. This would in turn decrease short-term volatility more maybe even to a bottoming point and IV would melt during the rotation upwards with the VIX slowly grinding down.
Come back next week as we review what happened within the implied ranges posted and overlook the volatility potentially bottoming and looking towards a VIX spike in the near future.
Remember to know your ABCs and stay hedged against your bias! CHEERS!

Weekly Volatility SnapshotGood Morning --
I hope everyone had a good week of trading ranges -- although short, we saw some VOLATILITY .
Here we will step back with the year-to-date TVC:VIX in the background as we look towards a fresh week trading within the broader market ranges.
Let us begin --
Last week the S&P500 -- with the SP:SPX gapped up opening into strength of a short week at $6,007.46 and wicking up to $6,050.83 only to sell off during U.S. wartime engagement threats within the news cycle, closing the weeks range at $5,984.57. This provided a move of $96.96 and is most comparative to what IV (16.18%) stated entering last week -- that was predicting a range of +/- $101.24.
Now, looking towards this week -- IV (16.34%) is nearly unchanged as HV10 (9.75%) is showing a 'strength of IV' lowering at only 60% currently. IV within the yearly spectrum sits with an IVp of 74% -- fairly expensive as this can show the majority of money is spending up to protect downside uncertainties.
Understandable of course.
Our long-term trending volatility of HV63 (30.25%) is showing a 'strength of IV' at 185% which is correlating to an implied move of +/- $188.98 for the week. This is an advantage if reached of $86.90 over stated IV. A massive premium capture potential.
With the MACRO news cycle pointing EXTREMELY NEGATIVE, I will be watching for volatility expansion. I believe futures will open up gapping into quarterly marks -- this is just my humble opinion of course.
I see the opposite of last week happening, where we gap down and run up into the week. I don't hold a swing position, just an observation that psychologically retail will flip bearish on wartime news with a massive gap down, only to get trapped as broader markets expand upwards into the week.
That's all for now. Everyone have a good week trading ranges, and I will see you Saturday to review! As always, know you ABCs and stay hedged for whatever your bias may be!
CHEERS

Nvidia - Weekly Volatility SnapshotGood Afternoon! Let's talk NASDAQ:NVDA
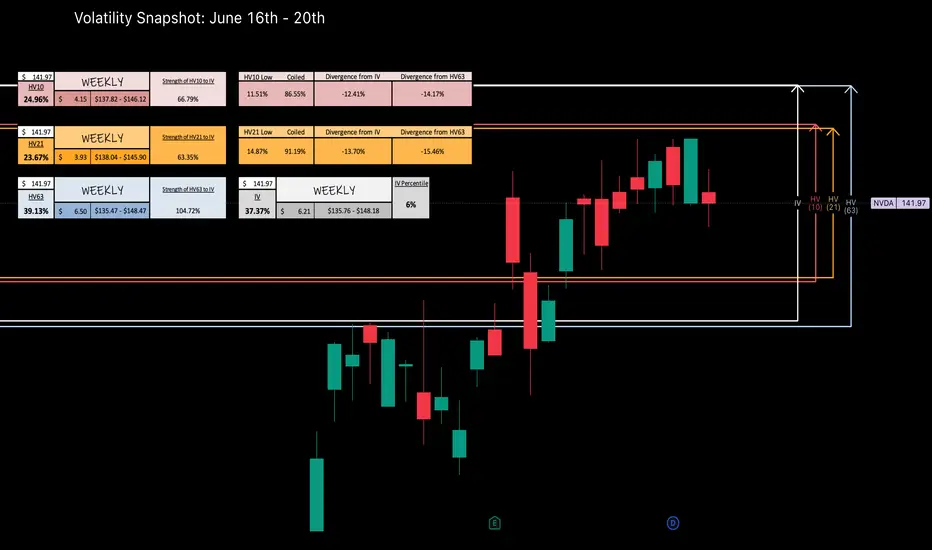
Last week we saw HV10 (24.96%) increase above HV21 (23.67%) after starting what could be a regression towards HV63 (39.13%). IV (37.37%) entering this week reflects within 6% of it's sliding yearly lows and resonating around quarterly means. This could be showing a fair prediction to the regression potential and a volatility spike.
Here, the RSI has room but is elevated and hinged down with the MACD crossed red -- lagging indicators showing trend reversal. If bi-weekly values can find regression to quarterly; the implied range I would be watching is $135.47 - $148.47 with IV increasing affecting premium positively. If the grind up continues slowly, expect IV to melt and be watching for contracting HV10 ranges between $137.82 - $146.12 -- Keep an eye on the news, it will ever affect the broader markets and any underlying within.
Follow along through the week as we track our volatility prediction -- I will pull the charts back in at the end of the week to review!
CHEERS!
BITx - Weekly Volatility Snapshot Good Morning -- Happy Father's day to any dad's out there!
Let's took a weekly look at CBOE:BITX -- our 2x leveraged BITSTAMP:BTCUSD fund.
Last week, we saw a beautiful gap up to the upper HV63 implied ranges were profit was taken and accelerated selling begin. Our bi-weekly trending values have increased due to the increasing volatility. The weekly candle ended with some body to it, but was mostly flat due to the gap closing with a big wick up.
Our IV (85.47%) entering the week is trending within 4% of the sliding yearly lows and seemingly increasing as it tracks near-term trending markets -- HV10 (70.04%) has increased from the movement last week +7.35% and is now +22.17% off sliding yearly lows. As the spring is uncoiling, and bi-weekly regresses towards quarterly means our premium capture erodes and our range expands. I love trading volatility and ranges.
The 'strength of IV' here for HV10 is 82% -- so you have to account when positioning that the trending near-term volatility IS INCREASING but IS WEAKER than what is predicted. The 'strength of IV' here for HV63 is 101% -- showing that what is predicted is fairly valued to me on a regression scale.
Please -- Pull my chart onto your layout and use my implied ranges and data, follow along through the week on your own screen as we track and measure the volatility -- let's get this conversation started!
CHEERS
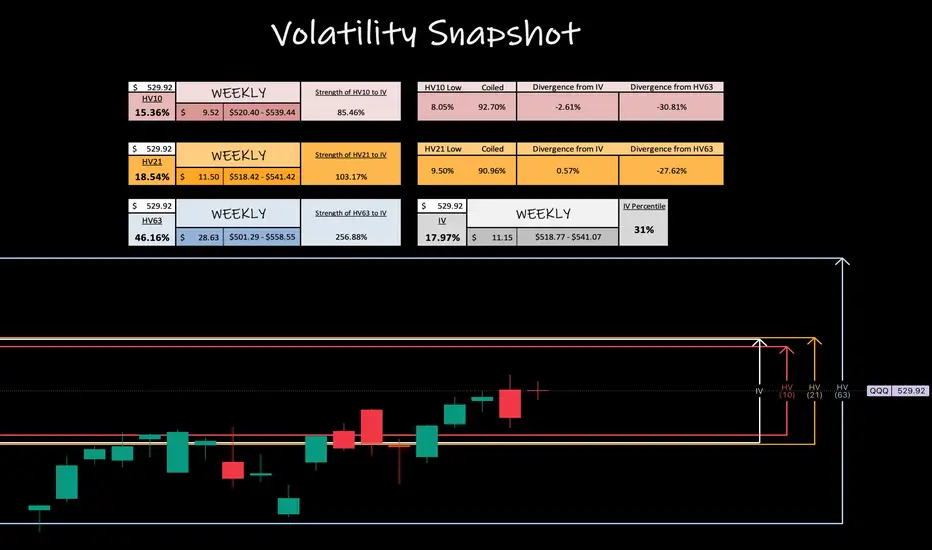
QQQ - Weekly Volatility PotentialGood Morning --
Last week we reviewed the potential of the S&P 500, this week let us take a look at the potential perspective of NASDAQ:QQQ .
IV (17.97%) entering the week is trending 31% IVp on the year and has been gradually lowering as price action grinds higher and out of corrective territory -- This is +2.61% more volatile than near-term trending values of HV10 (15.36%) and only -0.57% under HV21 (18.54%), our monthly trending values.
Looking towards next week, I expect the CBOE:VIX to continually soften IV values as the broader markets push towards all-time highs this week. NASDAQ:QQQ historical values are coiling to where we will soon need a volatility spike, but not just yet -- my weekly price target here is simple (HV10 upper implied range) $539.44 with wicking potential above to monthly trends (HV21 upper implied ranges) at $541.42.
Only time will tell, we can't control the markets but we sure can manage our own risk within them. Remember to always be hedged and come back to join me next weekend as we review the charts for what happened VS our expectation!
CHEERS
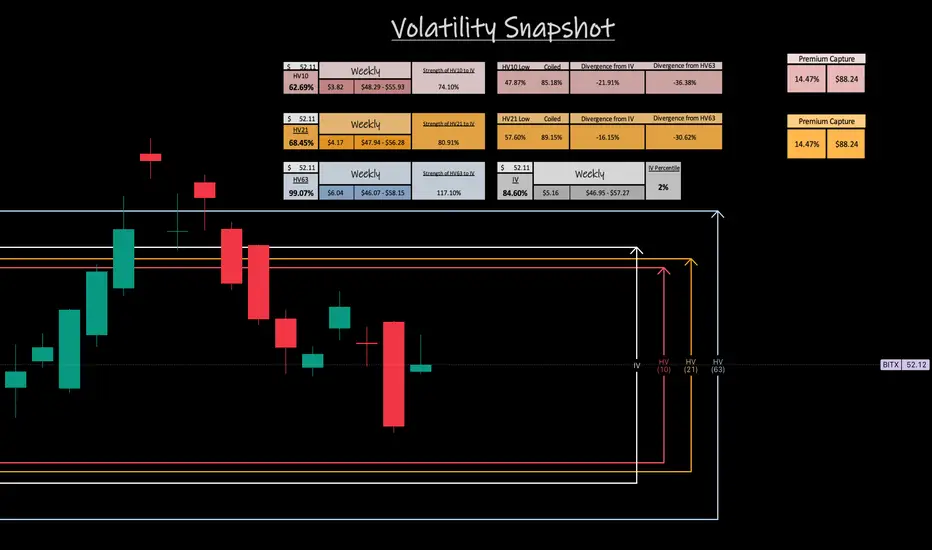
BITx - Weekly Volatility PotentialGood Morning!
Here is my weekly perspective for CBOE:BITX --
From when we reviewed last weekend, IV (84.60%) has lowered -2.39% and is entering the week with a 2% IVp. We have been in this pattern of rotating IV and Bi-Weekly volatility trends back and forth as HV10 (62.69%) entering the week has increased +2.47% from it's respective level entering last week. The prediction of what is to happen is contracting as what is actually happening in the short-term is trending up.
Bi-Weekly and Monthly volatility values after being 100% coiled and both putting in new yearly lows a month ago are starting to unwind as they create distance from those exact lows.
Could long-term trending means be on the horizon with quarterly values? Bi-weekly will eventually find it's way back there, question is when. Our best advantage, is to continue to track the data and ebb and flow with the markets and macro news.
Looking towards this next week, Our HV10 (62.69%) trending values are still contracting under our monthly HV21 (68.45%) trends, but IV (84.60%) although lowering, is reflecting expansion.
There is a premium capture past stated IV if we can find means regression back to HV63 (99.07%), as what is happening will expand past what is predicted to happen. As of now this value is 14.97% and equates to a premium capture $8.24 or $88.24 per lot or contract.
Again, when IV contracts chasing HV10, but it expands to HV63, we look to collect the premium value difference with the move.
Only time will tell, I think we will see another volume push into this week -- Remember to always be hedged and come back to join me next weekend as we review the charts for what happened VS our expectation!
CHEERS
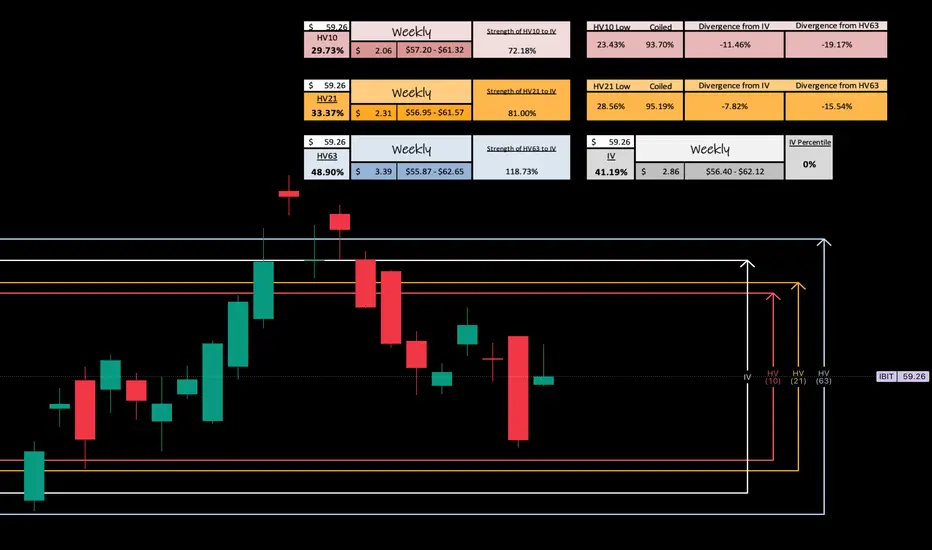
iBIT - Weekly Volatility PotentialGood Morning!
Here is my weekly perspective for NASDAQ:IBIT
From when we reviewed last weekend, IV (41.19%) has lowered -2.23% and is entering the week with a 0% IVp. We have been in this pattern of rotating IV and Bi-Weekly volatility trends back and forth as HV10 (29.73%) entering the week has increased +1.49% from it's respective level entering last week. The prediction of what is to happen is contracting as what is actually happening in the short-term is trending up.
Bi-Weekly and Monthly volatility values after being 100% coiled and both putting in new yearly lows a month ago are starting to unwind as they create distance from those exact lows.
Could long-term trending means be on the horizon with quarterly values?
Bi-weekly trends will eventually find it's way back there with monthly not far behind, question is when. Our best advantage is to continue to track the data and ebb and flow with the markets and macro news as it is released.
Looking towards this next week, Our HV10 (29.73%) trending values are still contracting under our monthly HV21 (33.37%) trends, but IV (41.19%) although lowering beyond yearly lows, is reflecting future expansion.
Only time will tell, I think we will see another volume push into this week -- Remember to always be hedged and come back to join me next weekend as we review the charts for what happened VS our expectation!
CHEERS
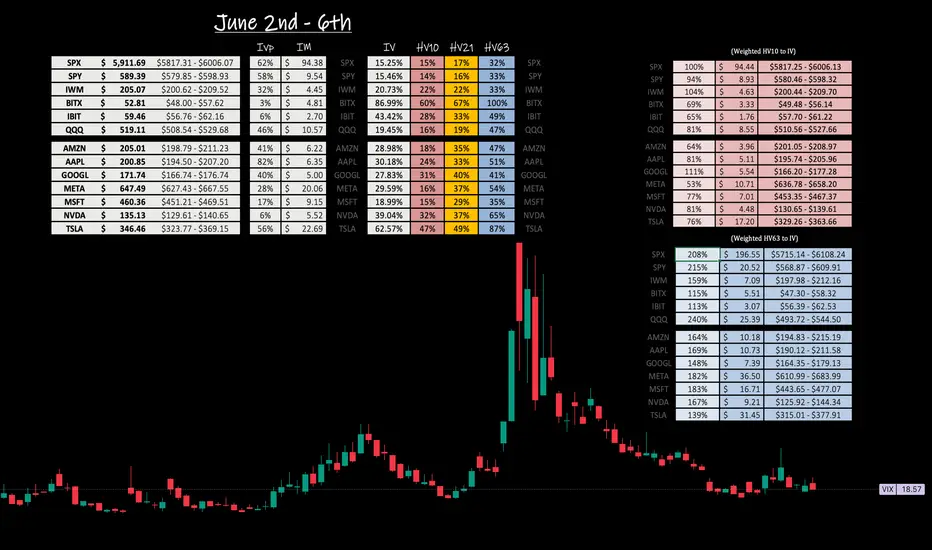
Weekly Volatility Snapshot Volatility, as measured by standard deviation, quantifies market elasticity and provides a level of probability and precision to trade within, that humbles us all.
Last week, the TVC:VIX opened above $21.00 and closed just under $19.00 for a near flat week even for all the eventful action that took place. That being once again, tariff related news with the court of international trade overriding Trump's liberation day, only to have the administration appeal, and the tariffs to be reinstated the following day.
This provided for quite a volatile move, mostly in after hours with everything closing strong to end the month.
As we look towards June starting with next week, just about all indices I track and the magnificent seven are showing near term trending volatility contracting under stated IV, as IV is melting across the board. Notable mention to NASDAQ:NVDA NASDAQ:MSFT NASDAQ:IBIT and CBOE:BITX for all entering the week with great IV value, now let's compare them to their respective trending bi-weekly values to observe what is being predicted to what is happening with near term trending volatility.
NASDAQ:NVDA at a 6% IVp enters the week with an IV of 39.04% -- HV10 (31.70%) is 81% strength of current IV and resonating under monthly values. When you see a large move, that being from the earnings report last week, you will see a massive IV melt to save premium against the PA move due to the beats or misses. With that said, bi-weekly values are just off yearly lows (25.74%) as IV chases it down and i see the underlying as 94.03% coiled for a volatility swing.
NASDAQ:MSFT at a 17% IVp enters the week with an IV of 18.99% -- HV10 (14.55%) is 77% strength of current IV and resonating deeply under monthly values. Bi-weekly yearly lows of 8.56% reflect a coiling of 90.03% at current values.
With both of these, I am looking for a volatility bounce, and regression back to quarterly means. That's where the real fun is and if played right provide excellent opportunity. For further discussion around BITSTAMP:BTCUSD within the funds NASDAQ:IBIT and CBOE:BITX look for my more dedicated posts this weekend.
For those interested in volatility analysis and the application of weighted HV ranges to IV, I encourage you to BOOST and share this post, leave a comment, or follow me to join me on this journey.
We will weekly analyze our ranges under the year-to-date VIX chart and engage in discussions as people please. So hop on board and come along for the ride!
iBIT - Weekly Volatility Snapshot Good afternoon -- Here is my weekly perspective for NASDAQ:IBIT
IV (43.42%) entering the week sits in the 6th percentile for the year. HV10 (28.24%) has been lowering towards it's yearly lows of 23.43% showing a coiling of bi-weekly values at 95.19% from this -- and a divergence from IV of -15.81% . IV is chasing the sinking bi-weekly volatility trends. We generally could see a volatility bounce within this range or continue to grind to new volatility lows.
I always expect and prepare for both, Lewis Pastor once said, "in a scientific setting, chance favors the prepared mind". I hold that true in a lot of situational settings not just scientific, but find it to be very true with BITSTAMP:BTCUSD volatility and risk management.
Moving deeper into the week; what can we expect?
Well, I think that the final shakeout may be here as we consolidate more into the beginning of the week finalizing on Tuesday, June 3rd. I find significance on this date being the extension in time from selling off for 45 days after the initial 'W' distribution off the top -- potentially the start of the volatility swing back towards long-term trending means and maybe the start of another impulse run to track into..stay tuned to find out in observation.
If this week we find regression to HV63 (49.26%), it will be a swift and quick move showing lots of strength. The ability to capture premium between the difference of stated IV from lowering HV10 values to the volatility swing back up above IV to quarterly means, is what it is all about ! This capture can be upwards 5.84% as a volatility metric read and beyond, because when a volatility regression occurs, it moves past means until having to consolidate back downwards again. Rinse and repeat.
For those interested in volatility analysis and the application of weighted HV ranges to IV, I encourage you to BOOST and share this post, leave a comment, or follow me to join me on this journey.

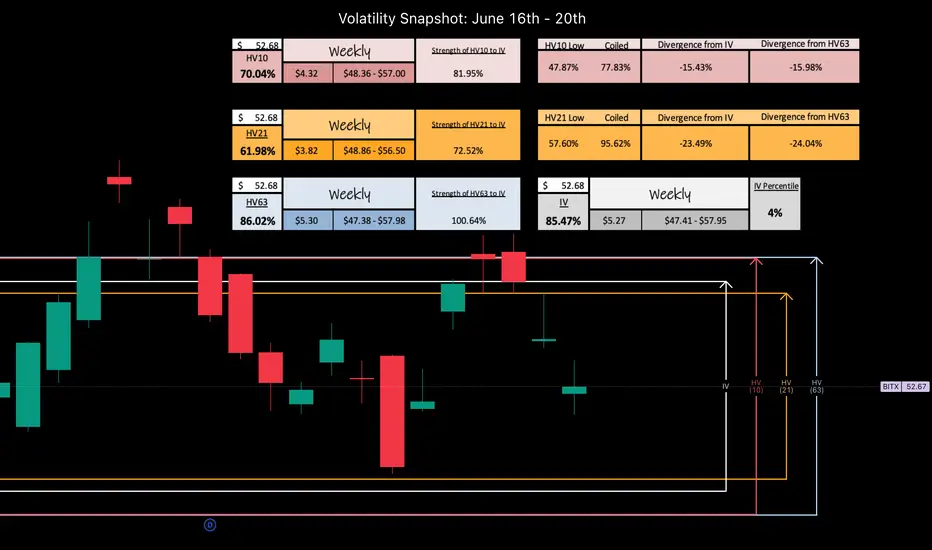
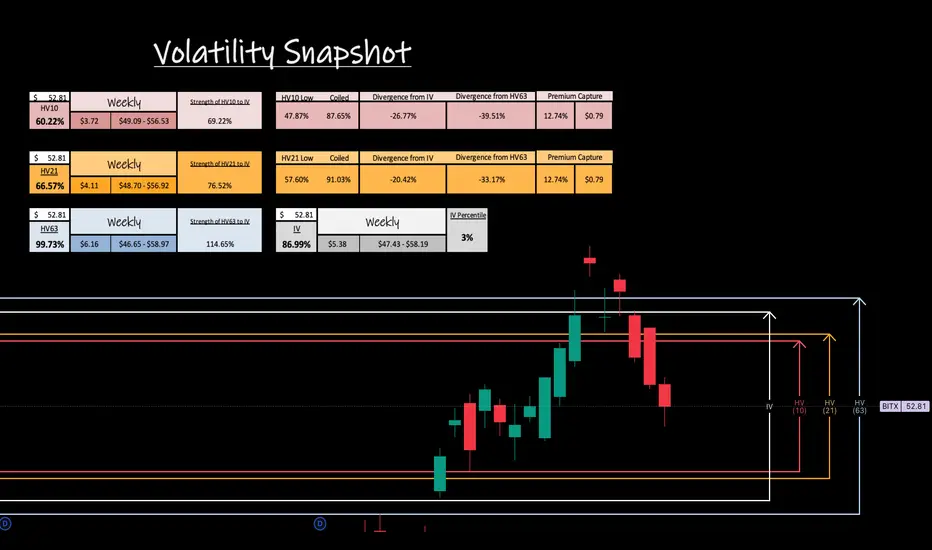
BITx - Weekly Volatility SnapshotGood afternoon -- Here is my weekly perspective for CBOE:BITX
IV (86.99%) entering the week sits in the 3rd percentile for the year. HV10 (60.22%) has been lowering towards it's yearly lows of 47.87% showing a coiling of bi-weekly values at 87.65% from this -- and a divergence from IV of -26.77% . IV is chasing the sinking bi-weekly volatility trends. We generally could see a volatility bounce within this range or continue to grind to new volatility lows.
I always expect and prepare for both, Lewis Pastor once said, "in a scientific setting, chance favors the prepared mind". I hold that true in a lot of situational settings not just scientific, but find it to be very true with BITSTAMP:BTCUSD volatility and risk management.
Moving deeper into the week; what can we expect?
Well, I think that the final shakeout may be here as we consolidate more into the beginning of the week finalizing on Tuesday, June 3rd. I find significance on this date being the extension in time from selling off for 45 days after the initial 'W' distribution off the top -- potentially the start of the volatility swing back towards long-term trending means and maybe the start of another impulse run to track into..stay tuned to find out in observation.
If this week we find regression to HV63 (99.73%), it will be a swift and quick move showing lots of strength. The ability to capture premium between the difference of stated IV from lowering HV10 values to the volatility swing back up above IV to quarterly means, is what it is all about! This capture can be upwards 12.74% as a volatility metric read and beyond, because when a volatility regression occurs, it moves past means until having to consolidate back downwards again. Rinse and repeat.
For those interested in volatility analysis and the application of weighted HV ranges to IV, I encourage you to BOOST and share this post, leave a comment, or follow me to join me on this journey.
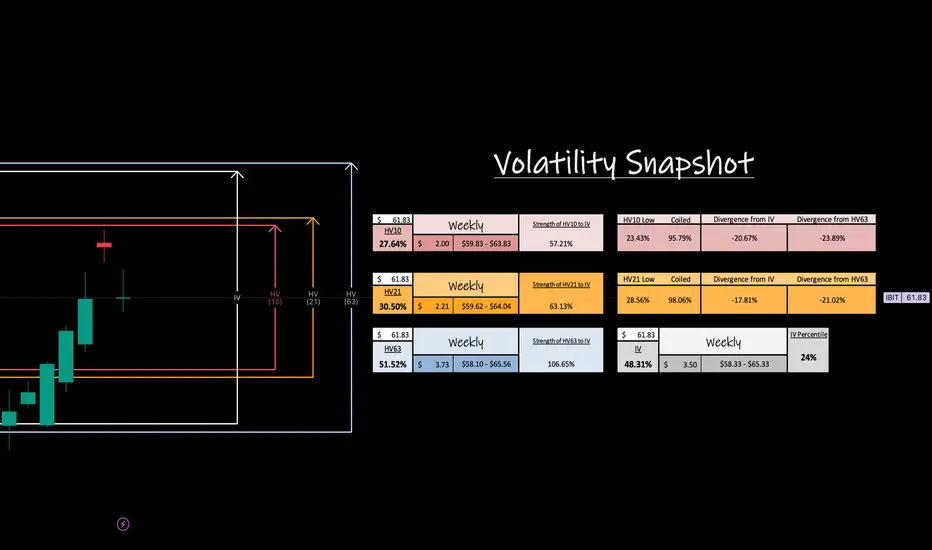
iBIT - Weekly Volatility SnapshotGood Afternoon,
Here is my weekly perspective for NASDAQ:IBIT ---
IV (48.31%) entering this week is holding in the 24th percent range for the year and has been climbing weekly from putting in new lows at the beginning of the year. We essentially have been seeing rising IV with rising price action, the best of the best. Premium increases from price action climbing and IV rising affects Vega positively increasing premium too.
Bi-weekly trends (27.64%) show a cooling off entering the week and contraction under IV, but it might not last long as there could be major macro news in the crypto world at any moment. This could be a big week on continued regression towards quarterly means (51.52%).
If this happens the range will continue to expand in my option and hold a +3.21% value per move on premium over stated IV, but weekly trends would be expanding 23.89% -- A huge move.
As always --
For those interested in volatility analysis and the application of weighted HV ranges to IV, I encourage you to BOOST and share this post, leave a comment, or follow me to join me on this journey.
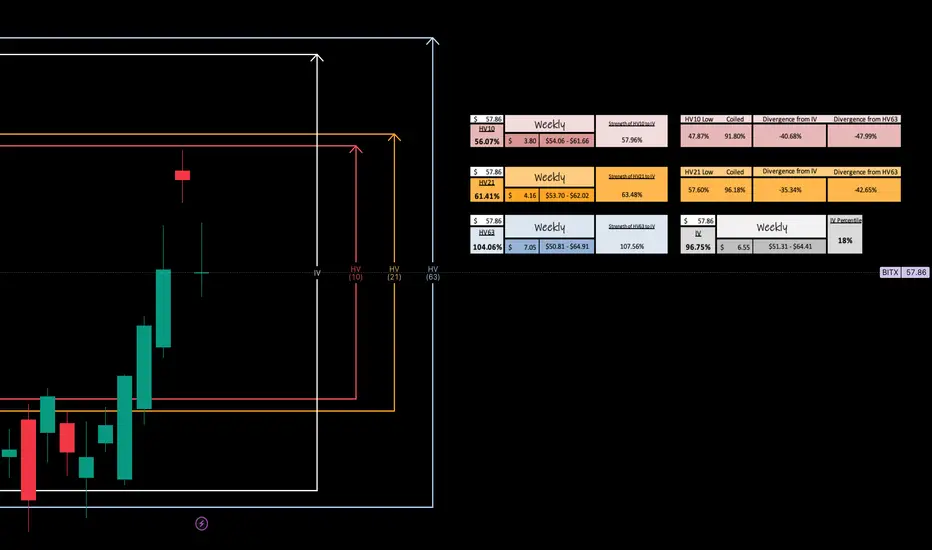
BITx - Weekly Volatility SnapshotGood Afternoon,
Here is my weekly perspective for CBOE:BITX
IV (96.75%) entering this week is holding in the 18th percent range for the year and has been climbing weekly from putting in new lows at the beginning of the year. We essentially have been seeing rising IV with rising price action, the best of the best. Premium increases from price action climbing and IV rising affects Vega positively increasing premium too.
Bi-weekly trends (56.07%) show a cooling off entering the week and contraction under IV, but it might not last long as there could be major macro news in the crypto world at any moment. This could be a big week on continued regression towards quarterly means (104.06%).
If this happens the range will continue to expand in my option and hold a +7.31% value per move on premium over stated IV, but weekly trends would be expanding 47.99% -- A huge move.
As always --
For those interested in volatility analysis and the application of weighted HV ranges to IV, I encourage you to BOOST and share this post, leave a comment, or follow me to join me on this journey.
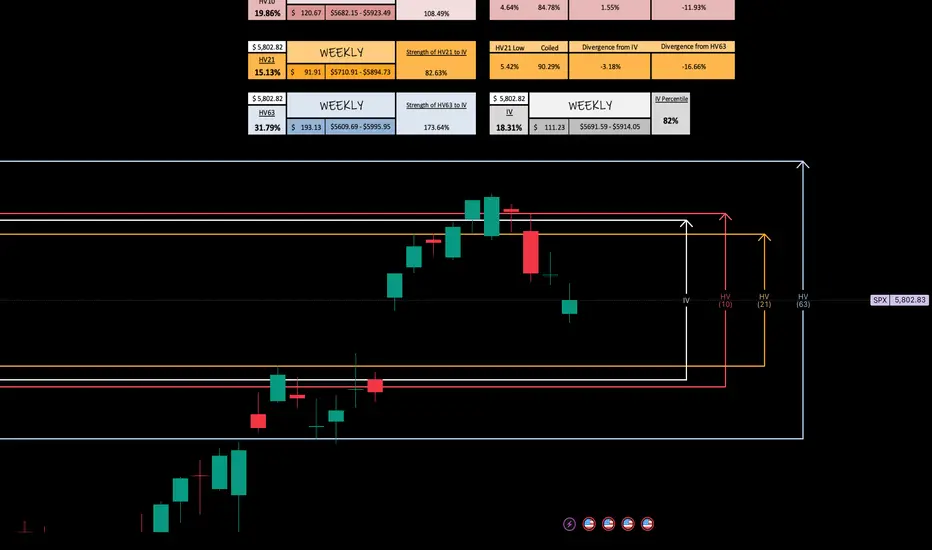
S&P 500 Index -- Weekly Volatility Potential Good Afternoon!
This week, I want to talk about the CBOE:SPX and its weekly potential for how I read historical volatility to weight it then to implied volatility -- this creates my custom trading ranges.
Implied ranges for this week are calculated at 4 DTE using my strength of IV method. You can find out more how I do this over at my highlights page on 'X' - Find me @askHVtobidIV
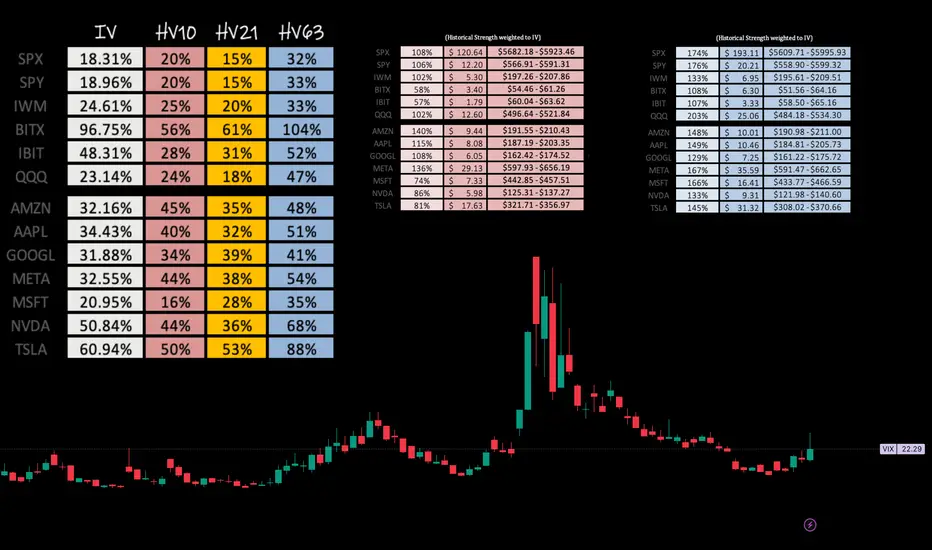
We are entering a short week, with IV currently in the 89th percentile for the year ( 18.31% ) and resonating between bi-weekly ( 19.36% ) and monthly ( 15.13% ) historical values. Quarterly volatility trends ( 31.79% ) have risen more than 10% this year alone due to macro concerns and increased news from tariff uncertainties. This is creating a volatile environment that, in turn, only increases our trading ranges. Something I personally like.
Near-term trends are above the currently high IV environment, suggesting further expansion. This provides premium value on what is happening to what is projected to happen and a “strength of IV” of >100% indicating rising volatility, slowly towards quarterly means, while resonating around monthly trends.
If price action drives downwards, our gap from May 16th could fill around $5,692.56 with confluence of HV21 trends at $5,710.91.
Conversely, I can see HV10 ranges with rising pricing action and good macro news with EU tariffs breaking $5,971.33—Expanding to the price of $5,995.95 with continuing expansion and regression towards means.
Come back next weekend as I will review the chart to see how we developed!
For those interested in volatility analysis and the application of weighted HV ranges to IV, I encourage you to BOOST and share this post, leave a comment, or follow me to join me on this journey.
Weekly Volatility SnapshotVolatility, expressed through standard deviation, quantifies market elasticity and presents a level of probability and precision that humbles us all.
In my analysis, I track trending volatility to discern historical patterns (HV) and utilize them to anticipate future outcomes (IV). This weighted indicator provides a comprehensive and accurate range for observation.
When trending historical volatility expands or contracts around implied volatility, price action can be interpreted as positively or negatively compounded within the predicted implied range.
I measure this concept using the ‘strength’ of IV and calculate my implied range based on the current market elasticity. This system is adaptable to any IV condition, as it allows for a fair assessment of market movements and potential outcomes.
__________________________________
Last week, volatility increased slightly as bi-weekly trends picked up over monthly values -- the same near term trends with the major indices show strength within 8% of IV into this next week.
One thing to note: NASDAQ:MSFT NASDAQ:NVDA and NASDAQ:TSLA all show near term contraction under stated IV within the magnificent 7 while the rest show shorter term volatility as expansive.
What do you think the CBOE:VIX will do this next week?
___________________________________
For those interested in volatility analysis and the application of my system using weighted HV ranges to IV, I encourage you to BOOST and share this post, leave a comment, or follow me to join me on this journey!
We will weekly analyze our ranges under the VIX and engage in discussions.