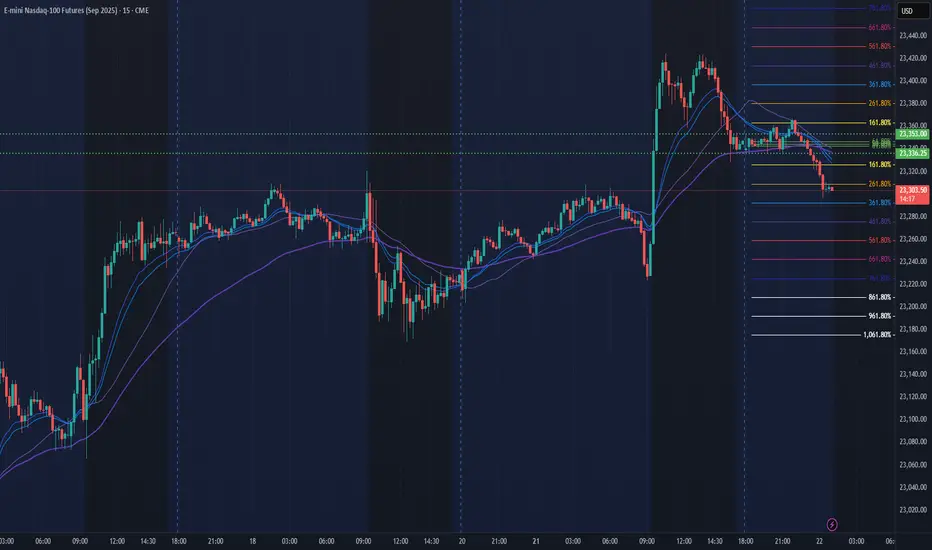
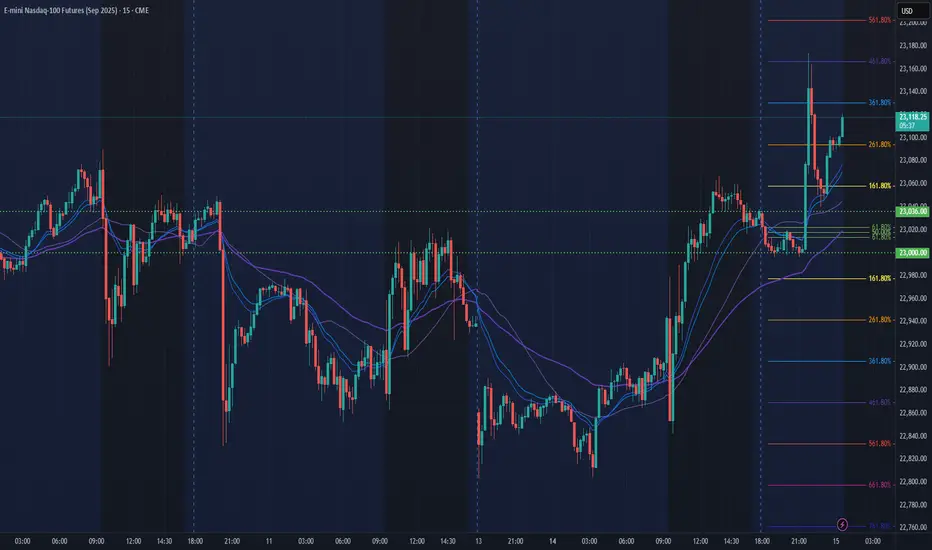
NQ Power Range Report with FIB Ext - 7/22/2025 SessionCME_MINI:NQU2025
- PR High: 23353.00
- PR Low: 23336.00
- NZ Spread: 38.0
Key scheduled economic events:
08:30 | Fed Chair Powell Speaks
Session Open Stats (As of 1:45 AM 7/22)
- Session Open ATR: 260.85
- Volume: 19K
- Open Int: 277K
- Trend Grade: Neutral
- From BA ATH: -0.1% (Rounded)
Key Levels (Rounded - Think of these as ranges)
- Long: 23811
- Mid: 22096
- Short: 20383
Keep in mind this is not speculation or a prediction. Only a report of the Power Range with Fib extensions for target hunting. Do your DD! You determine your risk tolerance. You are fully capable of making your own decisions.
BA: Back Adjusted
BuZ/BeZ: Bull Zone / Bear Zone
NZ: Neutral Zone
Volatility
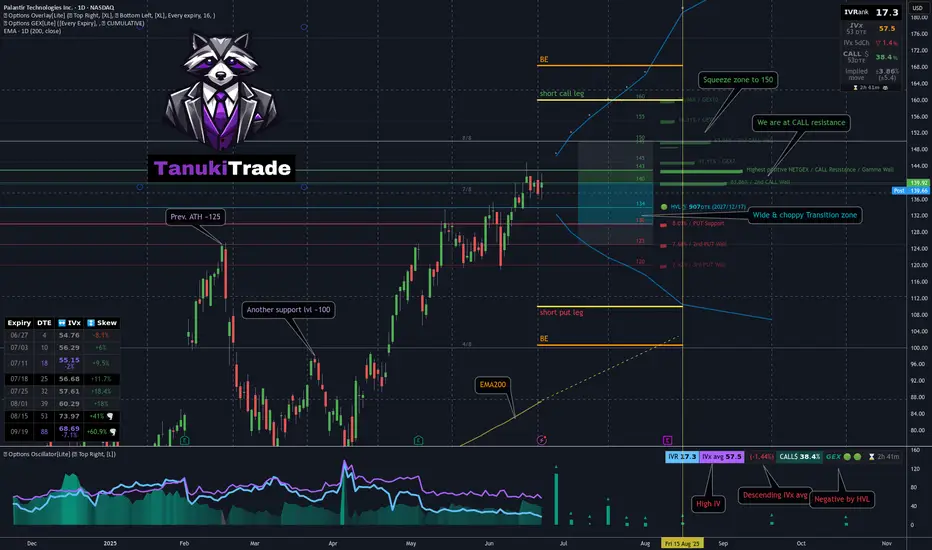
Jade Lizard on PLTR - My 53DTE Summer Theta PlayMany of you — and yes, I see you in my DMs 😄 — are trading PLTR, whether using LEAPS, wheeling, or covered calls.
I took a closer look. And guess what?
📈 After a strong move higher, PLTR was rejected right at the $143 call wall — pretty much all cumulative expiries cluster resistance there
Using the GEX Profile indicator, scanning all expirations:
After a brief dip, the market is repositioning bullish
Squeeze zone extends up to 150
The most distant GEX level is sitting at 160
On the downside, 130 is firm support, with some presence even at 120 — the market isn’t pricing in much risk below that
📉 From a technical standpoint:
We’re near all-time highs
125 (previous ATH) and 100 are key support levels
The OTM delta curve through August is wide, and the call side is paying well — with a current call pricing skew
🔬 IVx is at 57, trending lower + call pricing skew📉 IV Rank isn't particularly high, but the directional IVx matters more here
💡 Summer Theta Play: Jade Lizard on PLTR
Since I’ll be traveling this summer and don’t want to micromanage trades, I looked for something low-touch and high-confidence — and revisited an old favorite: the Jade Lizard.
If you're not familiar with the strategy, I recommend checking out Tastytrade's links and videos on Jade Lizards.
🔹 Why this setup?
Breakeven sits near $100, even with no management
On TastyTrade margin:~$1800 initial margin ~$830 max profit
53 DTE — plenty of time for theta to work
Earnings hit in August — I plan to close before then
Covers all bullish GEX resistance zones
Quickly turns profitable if IV doesn’t spike
Highly adjustable if needed
My conclusion: this strategy covers a much broader range than what the current GEX Profile shows across all expirations — so by my standards, I consider this to be a relatively lower-risk setup compared to most other symbols right now with similar theta strategies.
🔧 How would I adjust if needed?
If price moves up:
I’d roll the short put up to collect additional credit
Hold the call vertical as long as the curve supports it
If price drops:
Transition into a put ratio spread
Either extend or remove the call vertical depending on conditions
🛑 What’s the cut loss plan?
I have about 20% wiggle room on the upside, so I’m not too worried — but if price rips through 160 quickly, I’ll have to consider early closure.
If that happens, the decision depends on time:
If late in the cycle with low DTE:→ Take a small loss & roll out to next month for credit
If early with lots of DTE remaining:→ Consider converting to a butterfly, pushing out the call vertical for a small debit→ Offset this with credit from rolling the put upward
As always — stay sharp, manage your risk, and may the profit be with you.
See you next week!– Greg @ TanukiTrade
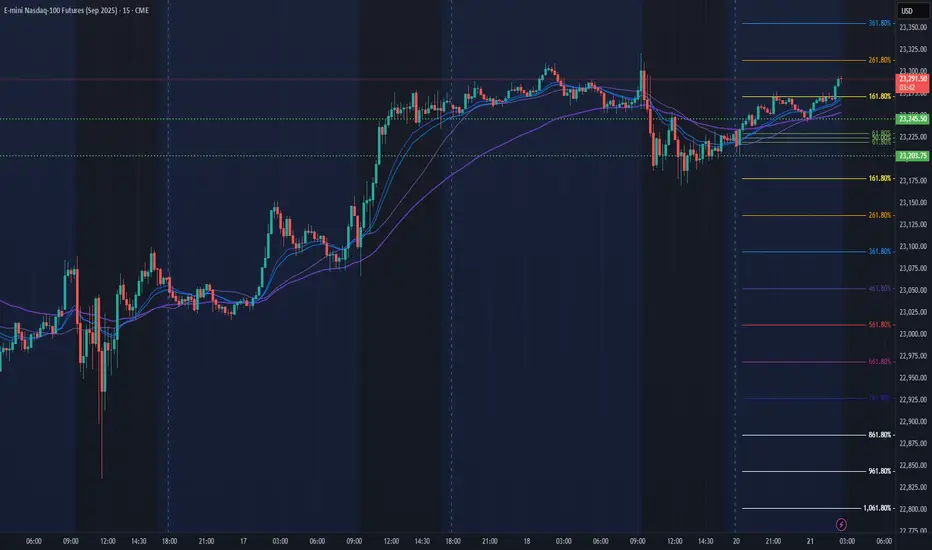
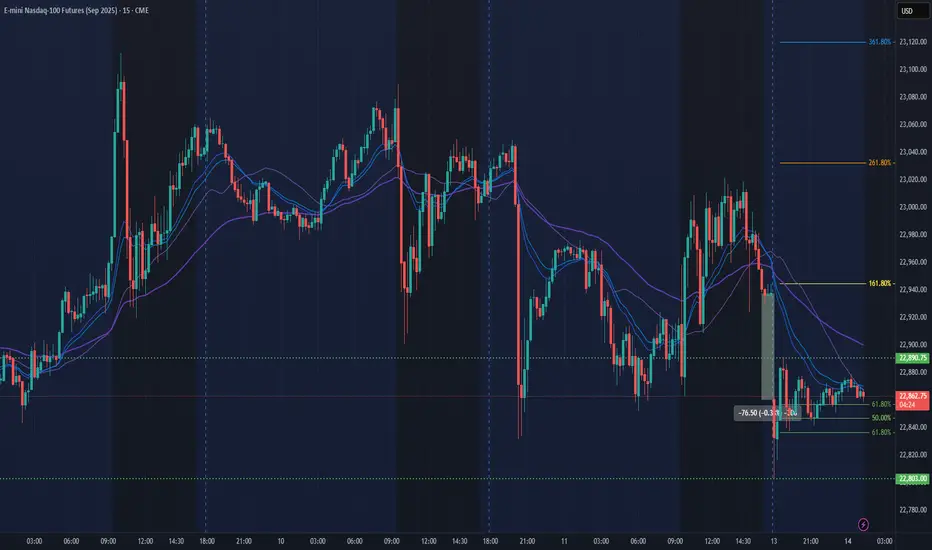
NQ Power Range Report with FIB Ext - 7/21/2025 SessionCME_MINI:NQU2025
- PR High: 23203.75
- PR Low: 23245.50
- NZ Spread: 93.25
No key scheduled economic events
In range to continue pushing ATH
Session Open Stats (As of 1:45 AM 7/21)
- Session Open ATR: 266.36
- Volume: 21K
- Open Int: 274K
- Trend Grade: Neutral
- From BA ATH: -0.1% (Rounded)
Key Levels (Rounded - Think of these as ranges)
- Long: 23811
- Mid: 22096
- Short: 20383
Keep in mind this is not speculation or a prediction. Only a report of the Power Range with Fib extensions for target hunting. Do your DD! You determine your risk tolerance. You are fully capable of making your own decisions.
BA: Back Adjusted
BuZ/BeZ: Bull Zone / Bear Zone
NZ: Neutral Zone
Weekly Volatility Snapshot Good Evening --
I hope everyone is having a restful weekend and enjoying your time away from markets. Always appreciate it while you can, and spend that precious time with loved ones. Now, let us review the price action last week as we look towards our expectations for the coming trading sessions.
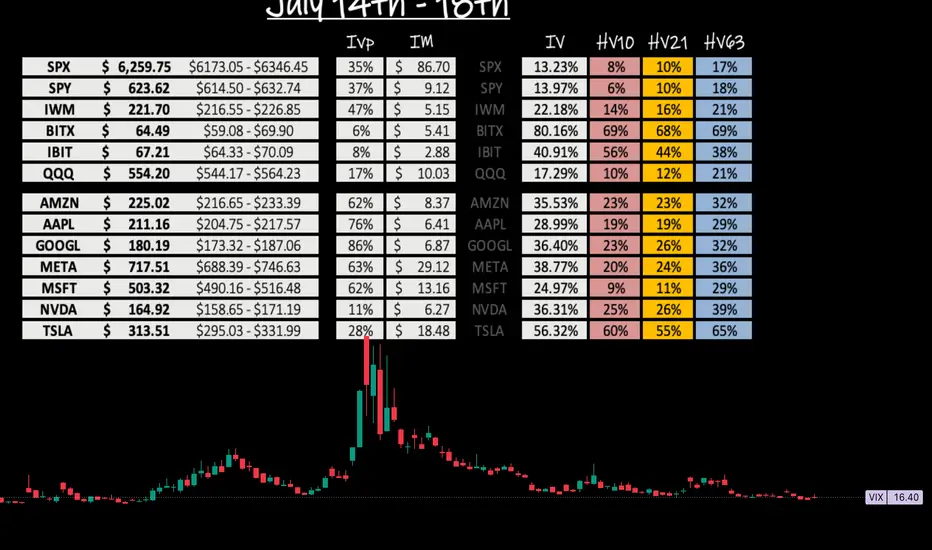
The CBOE:SPX opened the weekly candle at $6,126.15 and closed $6,252.50 -- this respectively puts the weekly move at +$126.35. This is slightly above what IV was stating entering the week. We are starting to see seasonality set in as the markets top and look for consolidation. The TVC:VIX dropped throughout the week putting a bottom in at $15.70 which shows volatility creeping to it's lowest point year-to-date.
We should all expect a volatility bounce in the near future as the run the broader markets have made out of the steep correction needs to cool off before moving forward. Below is my volatility read for the S&P 500. You will see that HV10 (7.94%) is coiled within 3.30% of its sliding yearly lows. This tells me between the low sentiment in fear and the low volatility in short-term trends, we need to cool off a little.
Now looking towards this week, I see the broader markets consolidating and even selling off in order to reset the overbought 'lagging' indicators and pop the VIX up a little bit. The administration has pushed the trade deal deadline off till AUG 1st providing some relief to the markets but, has also created more uncertainties with tariff letters that went out Friday.
Look for a negative news cycle sparking up Sunday night into Monday, potentially creating momentum downwards. However, I believe we stay in range of what HV10 weighted to IV implies -- $6,207.72 - $6,311.78. This range holds a divergence from IV of 5.29% and and price gap difference of -$17.32. To me, this says that what is short-term trending is 'contractive' to what IV states.
That's all for this week. Stay hedged against your bias always and remember to practice your ABCs -- If you like what you are reading and love volatility range analysis as much as i do -- feel free to drop me a comment and ill get back to you! Till next time, Cheers!
Bullish BreakoutARB/USDT recently showed a breakout above a descending trendline from Jan 24' on the daily timeframe, suggesting bullish momentum. .43 would be a good entry off the 200 MA if we get a back test and if ETH decides to pullback or continue its run to 4000. Arbitrum has officially hits a ATH in stablecoin supply $7,900,000,000. Adoption is in full swing BTC stable I bought a good bit today on robinhood and will buy more up or down. Targets .80, 1, 1.8.

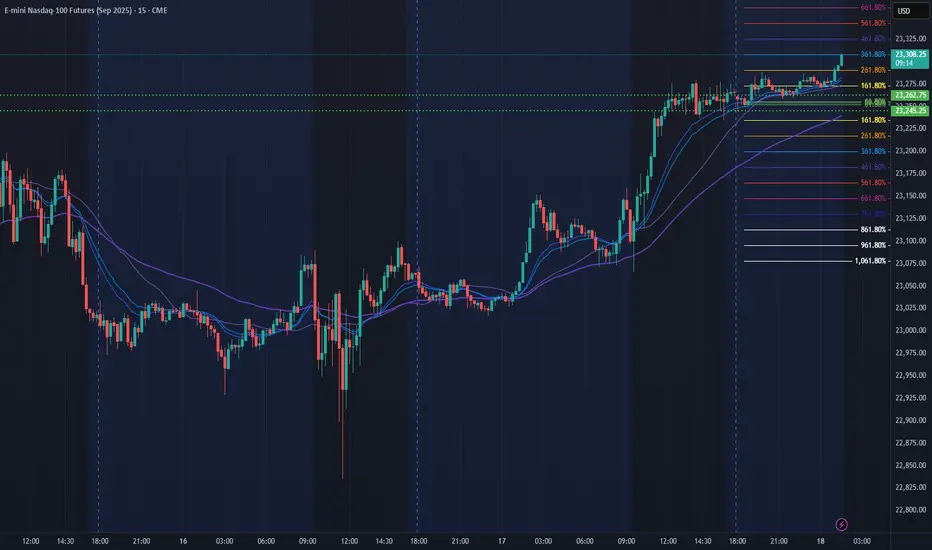
NQ Power Range Report with FIB Ext - 7/18/2025 SessionCME_MINI:NQU2025
- PR High: 23262.75
- PR Low: 23245.25
- NZ Spread: 39.0
No key scheduled economic events
Pushing ATH through overnight hours
Session Open Stats (As of 1:15 AM 7/18)
- Session Open ATR: 272.56
- Volume: 18K
- Open Int: 286K
- Trend Grade: Neutral
- From BA ATH: -0.0% (Rounded)
Key Levels (Rounded - Think of these as ranges)
- Long: 23811
- Mid: 22096
- Short: 20383
Keep in mind this is not speculation or a prediction. Only a report of the Power Range with Fib extensions for target hunting. Do your DD! You determine your risk tolerance. You are fully capable of making your own decisions.
BA: Back Adjusted
BuZ/BeZ: Bull Zone / Bear Zone
NZ: Neutral Zone
Germany 40 – Preparing For A Short Term Range BreakoutTariff worries, including new comments from President Trump stating that he is likely to impose fresh import charges on pharmaceuticals, have continued to dominate the thinking of Germany 40 traders this week. This has lead to some choppy price action for the index, which after opening on Monday at 24140, has bounced between a Tuesday high of 24293 and a Wednesday low of 23923, before settling back into the middle of that range.
Throw into the mix, the start of Q2 earnings season for European corporates and an upcoming ECB interest rate decision in a week's time and you can see how price action could become increasingly volatile moving forward into the end of July.
Earnings season has so far got off to a slow start in Europe and Germany 40 traders may have to wait until SAP, the company carrying the highest market capitalisation ($352 billion) and index weighting (14.5%), reports its results next Tuesday (after the close) for further insight into where prices may move next.
In terms of the ECB rate decision next Thursday (July 24th), market expectations may currently be indicating that another rate cut is unlikely, although it could be a close call. Traders seem to be focusing on recent commentary from policymakers which suggests the balance of power for the time being has shifted to the more hawkish committee members, who have stated that with inflation sitting on the central bank's target of 2% there is no need to cut rates further. Choosing instead to wait for more clarity on the outcome of trade negotiations with the US, which could decide whether a trade war between the world's first and third biggest economies may be something they need to navigate.
Technical Update: Assessing Current Pirce Action
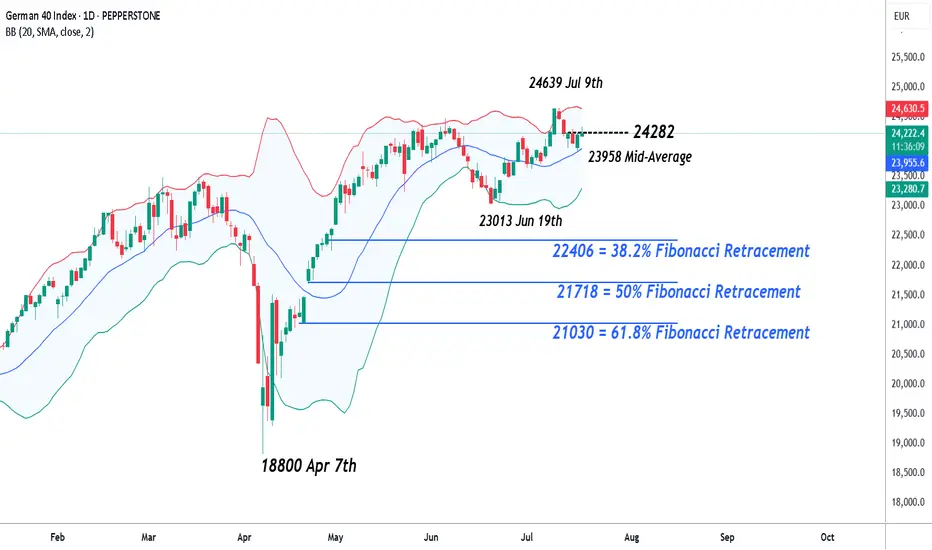
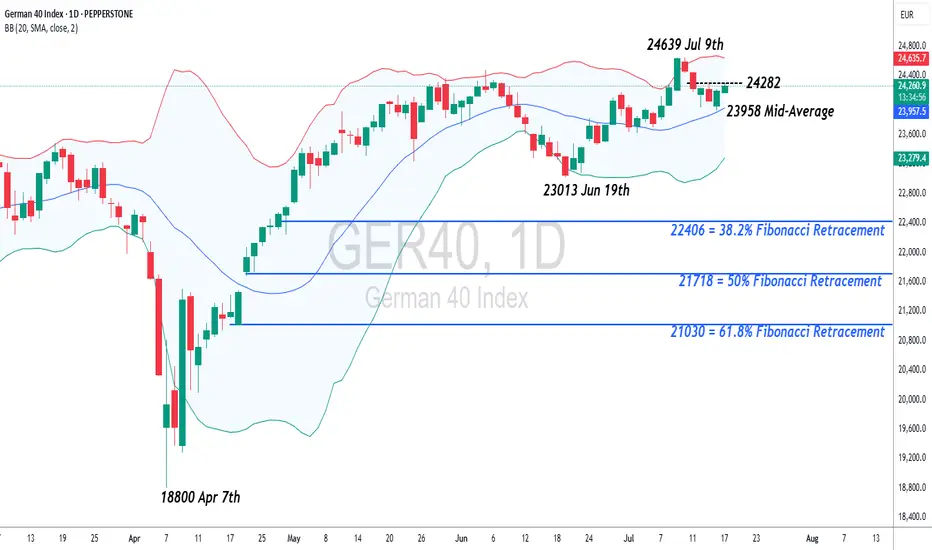
Having posted a new all-time high at 24639 on July 9th the Germany 40 index has entered a corrective period in price. However, while much will depend on future market sentiment and price trends, traders may well be asking, whether current price declines can develop into a more extended phase of weakness, or if the downside move could be limited as buyers return once again.
Time will tell, but in the meantime, technical analysis may help pinpoint potential support and resistance levels which can aid traders in establishing the next possible trends and directional risks.
Potential Support Levels:
Having recently posted a new all-time high at 24639, it might be argued this is still a positive price trend, especially as the Bollinger mid-average is currently rising. The mid-average stands at 23954, so may mark the first support focus for traders over coming sessions.
However, if closing breaks of this 23954 level materialise, it might lead towards a further phase of price weakness towards 23013, the June 19th session low, even 22406, which is the 38.2% Fibonacci retracement of April to July 2025 price strength.
Potential Resistance Levels:
If the 23954 mid-average successfully holds the current price setback, it could prompt further attempts to extend recent strength.
The first resistance might then stand at 24282, which is equal to half of the latest weakness, with successful closing breaks above this level possibly opening scope back to the 24639 all-time high and maybe further, if this in turn gives way.
The material provided here has not been prepared accordance with legal requirements designed to promote the independence of investment research and as such is considered to be a marketing communication. Whilst it is not subject to any prohibition on dealing ahead of the dissemination of investment research, we will not seek to take any advantage before providing it to our clients.
Pepperstone doesn’t represent that the material provided here is accurate, current or complete, and therefore shouldn’t be relied upon as such. The information, whether from a third party or not, isn’t to be considered as a recommendation; or an offer to buy or sell; or the solicitation of an offer to buy or sell any security, financial product or instrument; or to participate in any particular trading strategy. It does not take into account readers’ financial situation or investment objectives. We advise any readers of this content to seek their own advice. Without the approval of Pepperstone, reproduction or redistribution of this information isn’t permitted.
Germany 40 – Preparing For A Short Term Range BreakoutTariff worries, including new comments from President Trump stating that he is likely to impose fresh import charges on pharmaceuticals, have continued to dominate the thinking of Germany 40 traders this week. This has lead to some choppy price action for the index, which after opening on Monday at 24140, has bounced between a Tuesday high of 24293 and a Wednesday low of 23923, before settling back into the middle of that range.
Throw into the mix, the start of Q2 earnings season for European corporates and an upcoming ECB interest rate decision in a week's time and you can see how price action could become increasingly volatile moving forward into the end of July.
Earnings season has so far got off to a slow start in Europe and Germany 40 traders may have to wait until SAP, the company carrying the highest market capitalisation ($352 billion) and index weighting (14.5%), reports its results next Tuesday (after the close) for further insight into where prices may move next.
In terms of the ECB rate decision next Thursday (July 24th), market expectations may currently be indicating that another rate cut is unlikely, although it could be a close call. Traders seem to be focusing on recent commentary from policymakers which suggests the balance of power for the time being has shifted to the more hawkish committee members, who have stated that with inflation sitting on the central bank's target of 2% there is no need to cut rates further. Choosing instead to wait for more clarity on the outcome of trade negotiations with the US, which could decide whether a trade war between the world's first and third biggest economies may be something they need to navigate.
Technical Update: Assessing Current Pirce Action
Having posted a new all-time high at 24639 on July 9th the Germany 40 index has entered a corrective period in price. However, while much will depend on future market sentiment and price trends, traders may well be asking, whether current price declines can develop into a more extended phase of weakness, or if the downside move could be limited as buyers return once again.
Time will tell, but in the meantime, technical analysis may help pinpoint potential support and resistance levels which can aid traders in establishing the next possible trends and directional risks.
Potential Support Levels:
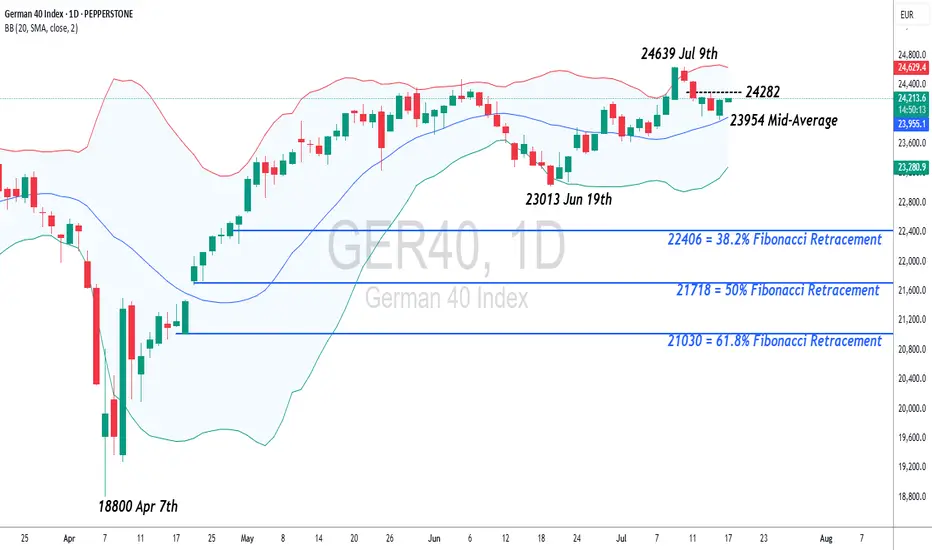
Having recently posted a new all-time high at 24639, it might be argued this is still a positive price trend, especially as the Bollinger mid-average is currently rising. The mid-average stands at 23954, so may mark the first support focus for traders over coming sessions.
However, if closing breaks of this 23954 level materialise, it might lead towards a further phase of price weakness towards 23013, the June 19th session low, even 22406, which is the 38.2% Fibonacci retracement of April to July 2025 price strength.
Potential Resistance Levels:
If the 23954 mid-average successfully holds the current price setback, it could prompt further attempts to extend recent strength.
The first resistance might then stand at 24282, which is equal to half of the latest weakness, with successful closing breaks above this level possibly opening scope back to the 24639 all-time high and maybe further, if this in turn gives way.
The material provided here has not been prepared accordance with legal requirements designed to promote the independence of investment research and as such is considered to be a marketing communication. Whilst it is not subject to any prohibition on dealing ahead of the dissemination of investment research, we will not seek to take any advantage before providing it to our clients.
Pepperstone doesn’t represent that the material provided here is accurate, current or complete, and therefore shouldn’t be relied upon as such. The information, whether from a third party or not, isn’t to be considered as a recommendation; or an offer to buy or sell; or the solicitation of an offer to buy or sell any security, financial product or instrument; or to participate in any particular trading strategy. It does not take into account readers’ financial situation or investment objectives. We advise any readers of this content to seek their own advice. Without the approval of Pepperstone, reproduction or redistribution of this information isn’t permitted.
Germany 40 – Preparing For A Short Term Range BreakoutTariff worries, including new comments from President Trump stating that he is likely to impose fresh import charges on pharmaceuticals, have continued to dominate the thinking of Germany 40 traders this week, leading to some choppy price action for the index, which after opening on Monday at 24084, has bounced between a Tuesday high of 24293 and a Wednesday low of 23925, before settling back into the middle of that range.
Throw into the mix, the start of Q2 earnings season for European corporates and an upcoming ECB interest rate decision in a week's time and you can see how price action could become increasingly volatile moving forward into the end of July.
Earnings season has so far got off to a slow start in Europe and Germany 40 traders may have to wait until SAP, the company carrying the highest market capitalisation ($352 billion) and index weighting (14.5%), reports its results next Tuesday (after the close) for further insight into where prices may move next.
In terms of the ECB rate decision next Thursday (July 24th), market expectations may currently be indicating that another rate cut is unlikely, although it could be a close call. Traders seem to be focusing on recent commentary from policymakers which suggests the balance of power for the time being has shifted to the more hawkish committee members, who have stated that with inflation sitting on the central bank's target of 2% there is no need to cut rates further. Choosing instead to wait for more clarity on the outcome of trade negotiations with the US, which could decide whether a trade war between the world's first and third biggest economies may be something they need to navigate.
Technical Update:
Having posted a new all-time high at 24639 on July 9th the German 40 index has entered a corrective period in price. However, while much will depend on future market sentiment and price trends, traders may well be asking, if current price declines can develop into a more extended phase of weakness, or if downside is just a limited move before buyers return to extend price strength.
Time will tell, but in the meantime, technical analysis may help pinpoint potential support and resistance levels, aiding in establishing next possible trends and directional risks.
Potential Support:
Having recently posted a new all-time high at 24639, it might be argued this is still a positive price trend, especially as the Bollinger mid-average is currently rising. This for Thursday stands at 23954, so may mark the first support focus for traders over coming sessions.
If closing breaks of this 23954 level materialise, it might lead towards a further phase of price weakness towards 23013, the June 19th session low, even 22406, the 38.2% Fibonacci retracement of April to July 2025 price strength.
Potential Resistance:
If the 23954 mid-average successfully holds the current price setback, it could possibly prompt further attempts to extend recent strength.
First resistance might then stand at 24282, equal to half latest weakness, with successful closing breaks possibly then opening scope back to the 24639 all-time high and maybe further, if this in turn gives way.
The material provided here has not been prepared accordance with legal requirements designed to promote the independence of investment research and as such is considered to be a marketing communication. Whilst it is not subject to any prohibition on dealing ahead of the dissemination of investment research, we will not seek to take any advantage before providing it to our clients.
Pepperstone doesn’t represent that the material provided here is accurate, current or complete, and therefore shouldn’t be relied upon as such. The information, whether from a third party or not, isn’t to be considered as a recommendation; or an offer to buy or sell; or the solicitation of an offer to buy or sell any security, financial product or instrument; or to participate in any particular trading strategy. It does not take into account readers’ financial situation or investment objectives. We advise any readers of this content to seek their own advice. Without the approval of Pepperstone, reproduction or redistribution of this information isn’t permitted.
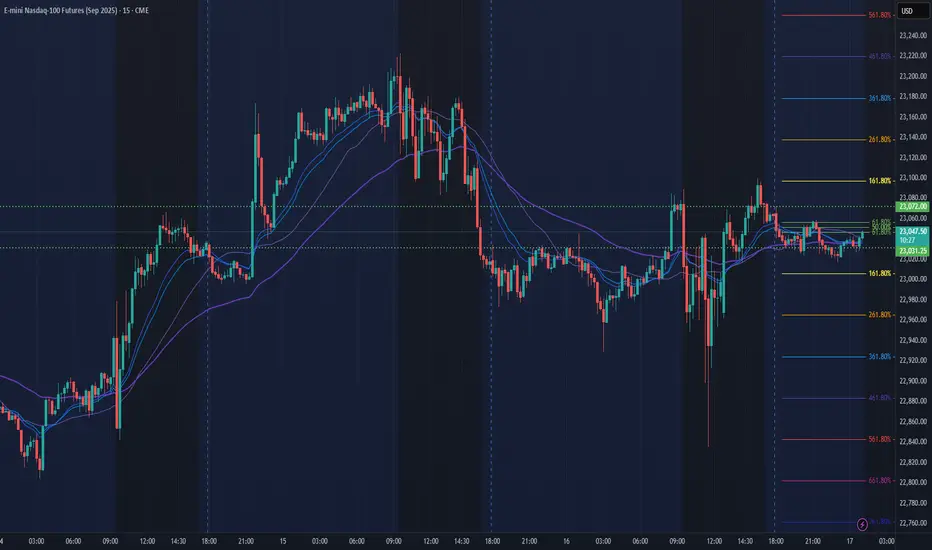
NQ Power Range Report with FIB Ext - 7/17/2025 SessionCME_MINI:NQU2025
- PR High: 23072.00
- PR Low: 23031.25
- NZ Spread: 91.25
Key scheduled economic events:
08:30 | Initial Jobless Claims
- Retail Sales (Core|MoM)
- Philadelphia Fed Manufacturing Index
Session Open Stats (As of 12:35 AM 7/17)
- Session Open ATR: 274.88
- Volume: 18K
- Open Int: 268K
- Trend Grade: Neutral
- From BA ATH: -0.8% (Rounded)
Key Levels (Rounded - Think of these as ranges)
- Long: 23239
- Mid: 21525
- Short: 20383
Keep in mind this is not speculation or a prediction. Only a report of the Power Range with Fib extensions for target hunting. Do your DD! You determine your risk tolerance. You are fully capable of making your own decisions.
BA: Back Adjusted
BuZ/BeZ: Bull Zone / Bear Zone
NZ: Neutral Zone
Germany 40 – Preparing For A Short Term Range BreakoutTariff worries, including new comments from President Trump stating that he is likely to impose fresh import charges on pharmaceuticals, have continued to dominate the thinking of Germany 40 traders this week, leading to some choppy price action for the index, which after opening on Monday at 24084, has bounced between a Tuesday high of 24293 and a Wednesday low of 23925, before settling back into the middle of that range.
Throw into the mix, the start of Q2 earnings season for European corporates and an upcoming ECB interest rate decision in a week's time and you can see how price action could become increasingly volatile moving forward into the end of July.
Earnings season has so far got off to a slow start in Europe and Germany 40 traders may have to wait until SAP, the company carrying the highest market capitalisation ($352 billion) and index weighting (14.5%), reports its results next Tuesday (after the close) for further insight into where prices may move next.
In terms of the ECB rate decision next Thursday (July 24th), market expectations may currently be indicating that another rate cut is unlikely, although it could be a close call. Traders seem to be focusing on recent commentary from policymakers which suggests the balance of power for the time being has shifted to the more hawkish committee members, who have stated that with inflation sitting on the central bank's target of 2% there is no need to cut rates further. Choosing instead to wait for more clarity on the outcome of trade negotiations with the US, which could decide whether a trade war between the world's first and third biggest economies may be something they need to navigate.
Technical Update:
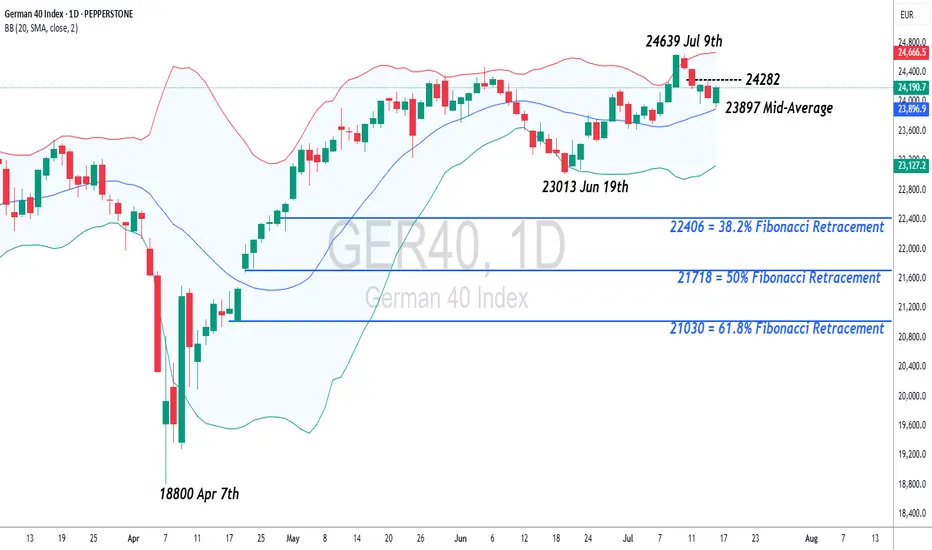
Having posted a new all-time high at 24639 on July 9th the German 40 index has entered a corrective period. However, while much will depend on future unknow market sentiment and price trends, traders may well be asking, if current price weakness can develop into a more extended phase of weakness, or if downside is just a limited move before buyers return to extend price strength.
Time will tell, but in the meantime, technical analysis may help pinpoint potential support and resistance levels, aiding us establish next potential trends and directional risks.
Potential Support:
Having recently posted a new all-time high at 24639, it might be argued this is still a possible positive trend, especially as the Bollinger mid-average is currently rising. This for Thursday stands at 23897, so may mark the first support focus for traders over coming sessions.
If closing breaks of this 23965 level materialise, it might lead towards a further phase of price weakness towards 23013, the June 19th session low, even 22406, the 38.2% Fibonacci retracement of April to July 2025 price strength.
Potential Resistance:
If the 23965 mid-average successfully holds the current price setback, it could possibly prompt further attempts to extend recent strength.
First resistance might then stand at 24282, equal to half latest weakness, with successful closing breaks possibly then opening scope back to the 24639 all-time high and maybe further, if this in turn gives way.
The material provided here has not been prepared accordance with legal requirements designed to promote the independence of investment research and as such is considered to be a marketing communication. Whilst it is not subject to any prohibition on dealing ahead of the dissemination of investment research, we will not seek to take any advantage before providing it to our clients.
Pepperstone doesn’t represent that the material provided here is accurate, current or complete, and therefore shouldn’t be relied upon as such. The information, whether from a third party or not, isn’t to be considered as a recommendation; or an offer to buy or sell; or the solicitation of an offer to buy or sell any security, financial product or instrument; or to participate in any particular trading strategy. It does not take into account readers’ financial situation or investment objectives. We advise any readers of this content to seek their own advice. Without the approval of Pepperstone, reproduction or redistribution of this information isn’t permitted.
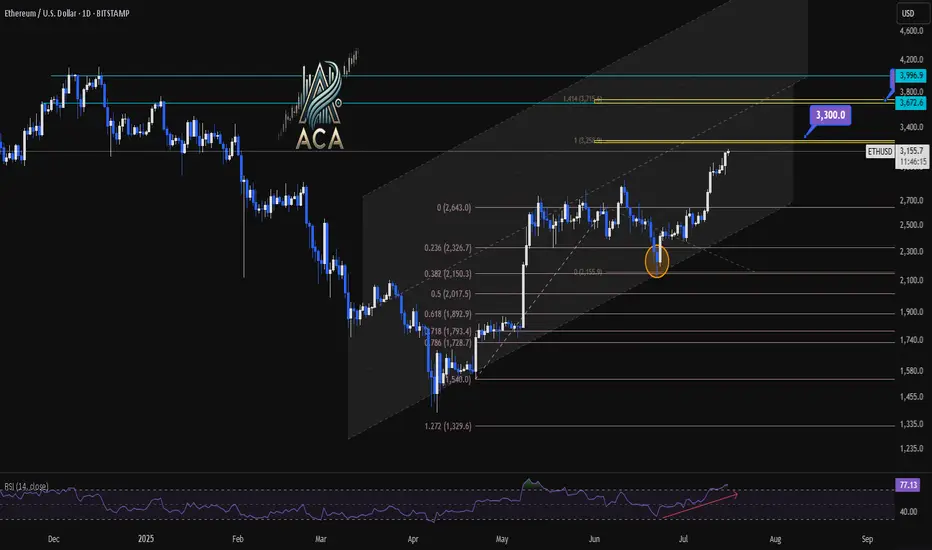
ETHUSDT 1D Chart Analysis | RSI Strength & Fibonacci TargetsETHUSDT 4H Chart Analysis | RSI Strength & Fibonacci Targets in Play
🔍 Let’s break down the latest ETH/USDT setup — bullish momentum is building with confluences pointing toward key upside targets.
⏳ 4-Hour Overview
Ether continues climbing within a well-defined ascending channel, with recent candles holding above mid-level support. Price is pressing higher from a clean bounce at the 0.5 and 0.618 Fibonacci retracement zone ($2,017–$1,899), signaling the correction has likely ended.
📉 Fibonacci Levels & RSI Confirmation
- The strong recovery aligns with rising volume and a bullish structure.
- RSI is pushing into overbought territory (above 73), often a sign of strength during trends—not exhaustion.
- ETH is now positioned for a breakout continuation move if momentum holds.
🎯 Bullish Targets Ahead
- Immediate resistance: $3,300 (1.414 Fib extension + historical supply)
- Next major target: $3,700 (1.618 extension + upper channel confluence)
- Pullback zones: $2,950 (mid-channel) and $2,017 (Fib support base)
📊 Key Highlights:
- Price is respecting the rising channel structure — higher lows, higher highs in play.
- Volume supports the breakout narrative, rising on green candles.
- RSI breakout supports trend continuation, not exhaustion.
- Targets at $3,300 and $3,700 remain actionable on a confirmed breakout.
🚨 Conclusion:
ETH is showing a multi-variable bullish setup with clear continuation potential. A strong move above $3,300 could quickly send price toward $3,700. Pullbacks to $2,950–$2,017 could offer high-risk/reward re-entry zones. Momentum favors bulls — stay alert.
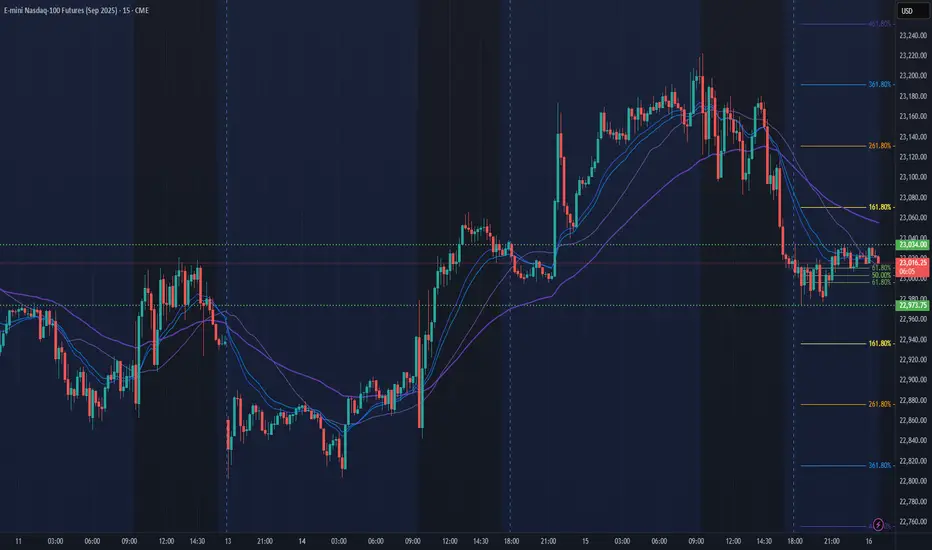
NQ Power Range Report with FIB Ext - 7/16/2025 SessionCME_MINI:NQU2025
- PR High: 23034.25
- PR Low: 22973.75
- NZ Spread: 135.5
Key scheduled economic events:
08:30 | PPI
10:30 | Crude Oil Inventories
AMP margins raised overnight for expected PPI volatility
Session Open Stats (As of 12:25 AM 7/16)
- Session Open ATR: 277.22
- Volume: 27K
- Open Int: 277K
- Trend Grade: Neutral
- From BA ATH: -0.8% (Rounded)
Key Levels (Rounded - Think of these as ranges)
- Long: 23239
- Mid: 21525
- Short: 20383
Keep in mind this is not speculation or a prediction. Only a report of the Power Range with Fib extensions for target hunting. Do your DD! You determine your risk tolerance. You are fully capable of making your own decisions.
BA: Back Adjusted
BuZ/BeZ: Bull Zone / Bear Zone
NZ: Neutral Zone
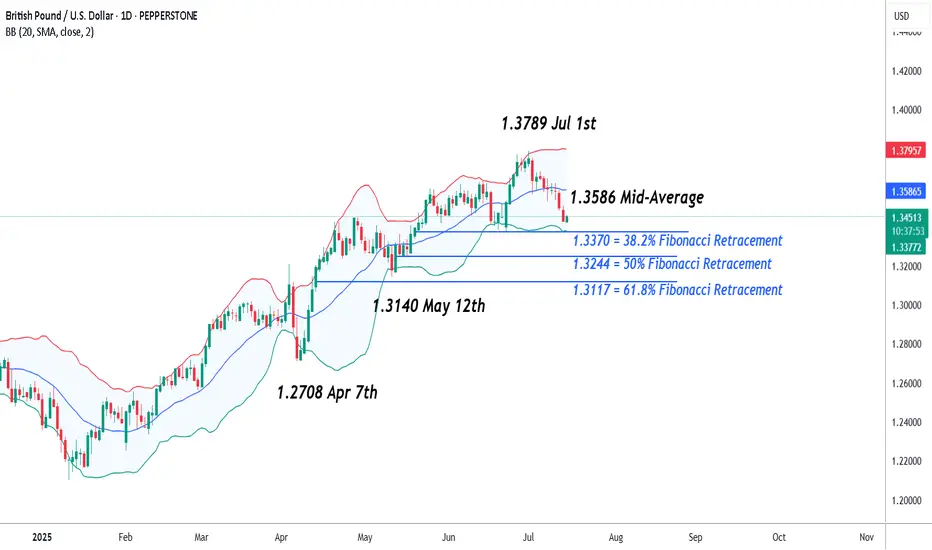
GBPUSD – Potential Short Term Volatility Ahead This WeekSo far, the month of July has not been a good one for GBPUSD, undermined by the precarious state of the UK Labour government’s finances, a deteriorating growth backdrop, and shifting interest rate differentials back in favour of the US dollar. This has seen a liquidation of stale long positioning and a steady decline from a 40 month high of 1.3789 registered on July 1st to a low of 1.3419 seen earlier today.
Looking forward, it could be another challenging week for FX traders to navigate. There are several economic data releases in the US and UK to digest, starting with the latest US CPI release later this afternoon (1330 BST), followed by the UK CPI update tomorrow (0700 BST) and then the UK Employment release on Thursday (0700 BST). All of these may have the potential to shift trader thinking on the next interest rate moves from the Federal Reserve (Fed), who are currently expected to keep rates unchanged when they next meet on July 31st, and the Bank of England (BoE), who are expected to cut by 25bps (0.25%) on August 7th.
When the outcome of these events is combined with the uncertain backdrop for global trade as President Trump’s new tariff deadline approaches on August 1st, alongside his ability to drop market moving social media headlines on a whim, this week has the potential to be a volatile one for GBPUSD.
Technical Update: Watching Closing Defence of 38.2% Retracement Support
So far, July has seen GBPUSD enter a correction phase, as prices have sold off from the 1.3789 July 1st session high into Tuesday’s current 1.3419 low. As the chart below shows, this 2.7% decline, seen over little more than a 10 session period, is now approaching what some might class as a support focus at 1.3370.
This level is equal to the 38.2% Fibonacci retracement of the April 7th to July 1st phase of strength, and could be one that traders are now monitoring on a closing basis over coming sessions. While this level remains intact, some might argue there is still a positive uptrend pattern in place.
However, it is also important to consider what are the support and resistance levels on which to focus, if either 1.3370 is broken to the downside, or it continues to stem the current phase of weakness, even helps prompt fresh attempts at price strength.
Possible Support Levels:
As we’ve suggested, it could be the 1.3370 retracement level that represents the first support, with closing breaks below this level opening potential for a more extended phase of price declines.
While much will depend on future market sentiment and price trends, closes below 1.3370 may represent possibilities of further weakness towards 1.3244, which is equal to the lower 50% retracement level. This giving way, may in time result in tests of 1.3140, the May 12th session low.
Possible Resistance Levels:
While the 1.3370 retracement continues to hold current price declines, it might be successful in prompting fresh attempts at price strength.
With that in mind, if moves back higher do materialise, a resistance point to monitor on a closing basis could be 1.3586. This is the current level of the Bollinger mid-average and this giving way on a closing basis may in turn lead to further attempts at price strength to challenge 1.3789, the July 1st high again.
The material provided here has not been prepared accordance with legal requirements designed to promote the independence of investment research and as such is considered to be a marketing communication. Whilst it is not subject to any prohibition on dealing ahead of the dissemination of investment research, we will not seek to take any advantage before providing it to our clients.
Pepperstone doesn’t represent that the material provided here is accurate, current or complete, and therefore shouldn’t be relied upon as such. The information, whether from a third party or not, isn’t to be considered as a recommendation; or an offer to buy or sell; or the solicitation of an offer to buy or sell any security, financial product or instrument; or to participate in any particular trading strategy. It does not take into account readers’ financial situation or investment objectives. We advise any readers of this content to seek their own advice. Without the approval of Pepperstone, reproduction or redistribution of this information isn’t permitted.
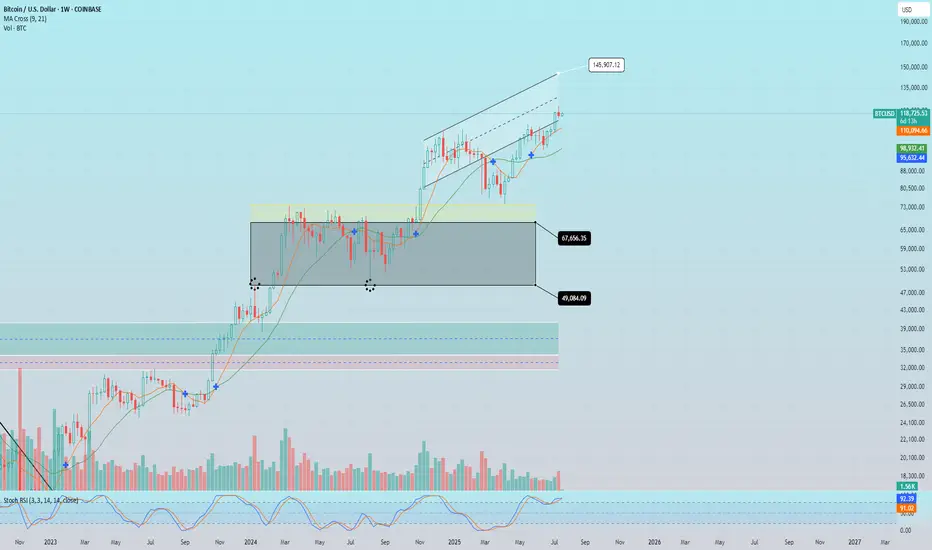
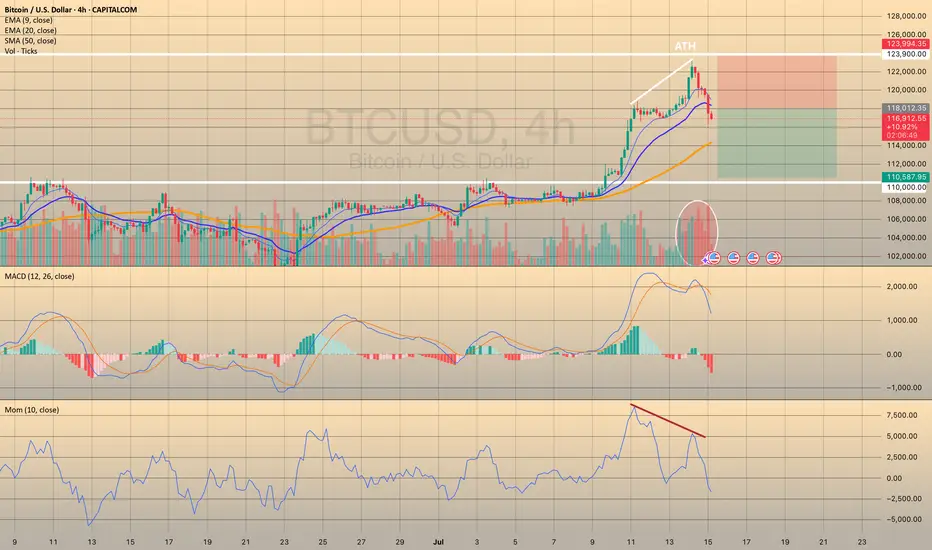
BTCUSD - REBOUND FROM ATHYesterday BTCUSD has reached new price level slightly above 123,000.00 and started to decline afterwards on big selling volume. Also we see some divergence on momentum oscillator and MACD has crossed into a red zone. I still think that bitcoin is overbought and needs the correction before next growth, so I decided to go short with
🔽 a market sell order at 117461.25 with
❌a stop loss at 123894.15 and
🤑a take profit at 110587.70
A stop loss is above the ATH, take profit just above the support level of 110,000.00. It is a counter-trend trade, so it's a bit more risky than usual.
Trade cautiously! Preserve your deposits!
NQ Power Range Report with FIB Ext - 7/15/2025 SessionCME_MINI:NQU2025
- PR High: 23036.00
- PR Low: 23000.00
- NZ Spread: 80.5
Key scheduled economic events:
08:30 | CPI (Core|MoM|YoY)
Asian hours vol spike breakout swing into new ATHs
Session Open Stats (As of 12:15 AM 7/15)
- Session Open ATR: 290.39
- Volume: 42K
- Open Int: 276K
- Trend Grade: Neutral
- From BA ATH: -0.3% (Rounded)
Key Levels (Rounded - Think of these as ranges)
- Long: 23239
- Mid: 21525
- Short: 20383
Keep in mind this is not speculation or a prediction. Only a report of the Power Range with Fib extensions for target hunting. Do your DD! You determine your risk tolerance. You are fully capable of making your own decisions.
BA: Back Adjusted
BuZ/BeZ: Bull Zone / Bear Zone
NZ: Neutral Zone
US 500 – A New Record Peak or Reversal in the Week AheadSo far in July, the US 500 has recorded multiple all-time highs on its way to an eventual peak of 6294 on Thursday (July 10th), from which it finally succumbed to some profit taking into the weekend, leading to a small Friday sell off to close at 6255 (-0.4%).
Along the way traders have ignored mixed US economic data, and more importantly they have, for the most part, shrugged off President Trump’s increasingly aggressive approach to tariffs, choosing instead to focus on economic resilience, renewed AI optimism and an improving outlook for the Q2 corporate earnings season that kicks fully into gear in the coming days.
In terms of tariffs, the fact that there is now a new August 1st deadline to concentrate on may be taking away some of the immediate urgency for the announcement of trade deals, although these issues still remain important and on-going, highlighted by President Trump's weekend social media announcement of 30% tariffs on the EU and Mexico, if a better deal cant be reached in the next 3 weeks.
With regard to corporate earnings, the major US banks like JP Morgan (Tuesday before the open) and Bank of America (Wednesday before the open) report this week. Both company’s share prices have seen strong gains since the April lows, so traders will be eagerly awaiting their actual numbers. They will also be keen to hear the thoughts of the bank CEOs on future earnings, bad debt provisions and the potential impact of Trump’s tariffs on the US economy moving forward. Only last week, Jamie Dimon, CEO of JP Morgan, warned market complacency towards potential tariff risks.
In terms of scheduled economic data. Tuesday’s US CPI (1330 BST) and Wednesday’s PPI release (1330 BST) stand out. Traders are sensitive to US inflation updates and have been watching over the last several months for signs that tariffs are pushing up prices. So far this hasn’t been the case but these new releases may tell a different story.
All of these issues could impact risk sentiment and the direction of the US 500 index in the next 5 trading days. Certainly, the early open has been impacted by President Trump's weekend tariff announcement, with the US 500 currently down 0.46% at 6227 (0800 BST).
The technical outlook could also be an important factor in determining price moves.
Technical Update: Assessing the Move to A New Record High
Last week appears to have seen a slowing in the speed of the recent price strength, but a new all-time high was still posted at 6294 on Thursday. It could be argued that this activity maintains what is still a more constructive pattern of higher price highs and higher price lows that have materialised since the April 7th downside extreme of 4799.
However, there is no guarantee this price activity will continue to see new all-time highs posted, so we need to be aware of potential support and resistance levels that may influence price activity.
Possible Support Levels:
If last week’s possible slowing in upside price momentum develops into a new phase of price weakness, a support level that traders might now be watching could be 6148.
This 6148 level is equal to both the 38.2% Fibonacci retracement of June 23rd to July 10th strength and the current level of the rising Bollinger mid-average. Closes below 6148 might suggest a more extended phase of weakness back to 6058, the lower 61.8% Fibonacci retracement, possibly further if this in turn gives way.
Possible Resistance Levels:
Having been capped by the 6294 all-time high last week, sellers may continue to be found at this level, so this might prove to be the first potential resistance if fresh attempts at price strength over the coming week develop.
Closing defence of 6294 may need to be watched if challenged, as successful breaks above this level might suggest an extension of the uptrend pattern currently evident in price activity. Such closing breaks higher may well suggest price strength towards 6418, the 200% Fibonacci extension level of the recent price decline.
The material provided here has not been prepared accordance with legal requirements designed to promote the independence of investment research and as such is considered to be a marketing communication. Whilst it is not subject to any prohibition on dealing ahead of the dissemination of investment research, we will not seek to take any advantage before providing it to our clients.
Pepperstone doesn’t represent that the material provided here is accurate, current or complete, and therefore shouldn’t be relied upon as such. The information, whether from a third party or not, isn’t to be considered as a recommendation; or an offer to buy or sell; or the solicitation of an offer to buy or sell any security, financial product or instrument; or to participate in any particular trading strategy. It does not take into account readers’ financial situation or investment objectives. We advise any readers of this content to seek their own advice. Without the approval of Pepperstone, reproduction or redistribution of this information isn’t permitted.

NQ Power Range Report with FIB Ext - 7/14/2025 SessionCME_MINI:NQU2025
- PR High: 22890.50
- PR Low: 22803.00
- NZ Spread: 195.0
No key scheduled economic events
0.33% weekend gap to previous week low, unfilled
Session Open Stats (As of 1:15 AM 7/14)
- Session Open ATR: 289.88
- Volume: 36K
- Open Int: 270K
- Trend Grade: Neutral
- From BA ATH: -1.0% (Rounded)
Key Levels (Rounded - Think of these as ranges)
- Long: 23239
- Mid: 21525
- Short: 20383
Keep in mind this is not speculation or a prediction. Only a report of the Power Range with Fib extensions for target hunting. Do your DD! You determine your risk tolerance. You are fully capable of making your own decisions.
BA: Back Adjusted
BuZ/BeZ: Bull Zone / Bear Zone
NZ: Neutral Zone
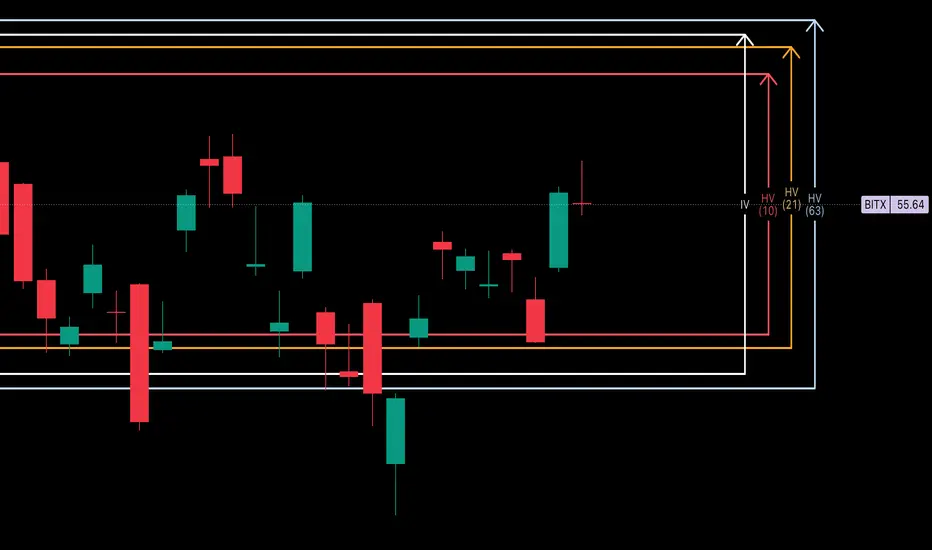
BITx -- Weekly Volatility SnapshotHello Bitcoin community 🤠👾🤑👾🤠
Good morning/Good afternoon, maybe goodnight to you pending where you are in the world!
Nonetheless, I'm glad you found me because here we are going to look over our weekly historical volatility ranges on CBOE:BITX and assess where IV is in perspective to what's trending. Then we will talk targets within my custom adjusted implied weekly ranges.
Entering the week, IV (76.86%) is projecting +17.74% more than what short-term trending markets are showing with HV10 (59.12%) holding a 'strength of IV' of only 76.91%. This is a price differential on the week of -$1.19. Our monthly values with HV21 (71.20%) are hinged slightly below IV, showing a 'strength of IV' slightly more at 92.64%.
In my opinion looking towards this week, IV may be painting the bigger picture of price distribution upwards towards quarterly trends. It is expansive from past weeks and above short-term trending markets with a wider range and with IV percentile slowly creeping up.
If the trend holds that started last week, my price target will be HV63 at $61.07 which draws confluence with the correction impulse wave top of $60.39 -- a price action to implied calculation difference of only +/-$0.69. Fantastic , right?!? This would take BTC approaching new ATHs again. If price action can find quarterly trends we will be seeing a 'strength of IV' of 108.44% -- only slight advantageous over IV premium.
In the end, markets are unpredictably wild and we can only assess and reduce our risk using the tools provided. Always remember your ABCs and to hedge your bias! Come back next week as we recap how the weekly volatility unfolded.
Cheers!
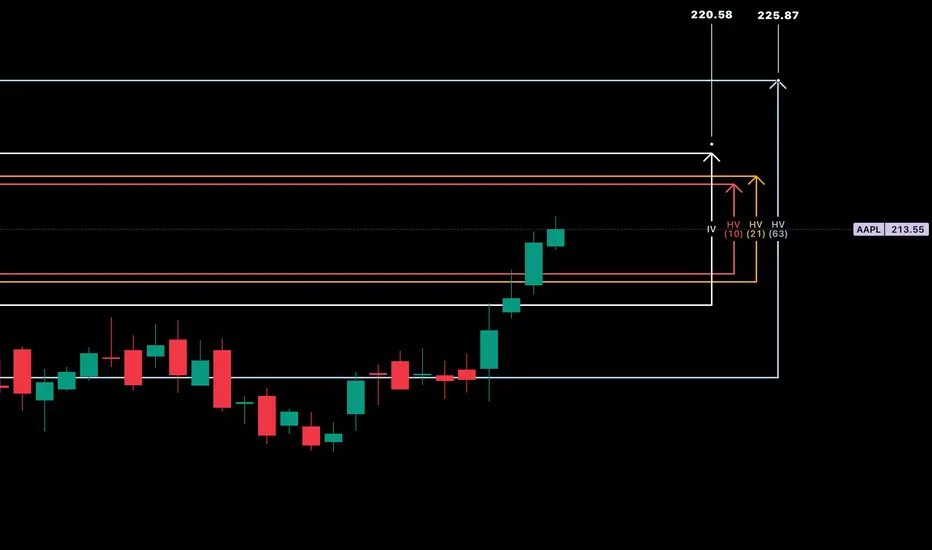
AAPL - Weekly HV/IV PerspectiveGood evening —
I wanted to do one more write up with that being on NASDAQ:AAPL as we enter the week with futures just opening.
HV10 (16.58%) is trending -11.56% below IV (28.14%) showing a weekly price gap differential of -$2.89 on the stated implied move to what trending markets are doing. This current IV value entering the week sits 69% within the sliding year spectrum.
Now, with Apple consolidating in range for almost eight weeks after selling off when it reached its 4T milestone in December of 2024, has now begun advancing back upwards in price. The strength here is obvious and the quality of company is well, Apple.
My price targets on the week is first the upper band of stated IV ($220.58) then moving on towards the upper implied range of HV63 ($225.87). I believe the markets are going to push apple higher while balancing the indices out selling off in other areas. This would start to accelerate HV10, as it is now 91.23% coiled to its yearly lows and needs to unwind. Hopefully with a few short-term trending days increasing we find our regression.
Please come back next week and see how our position and volatility progressed forward.
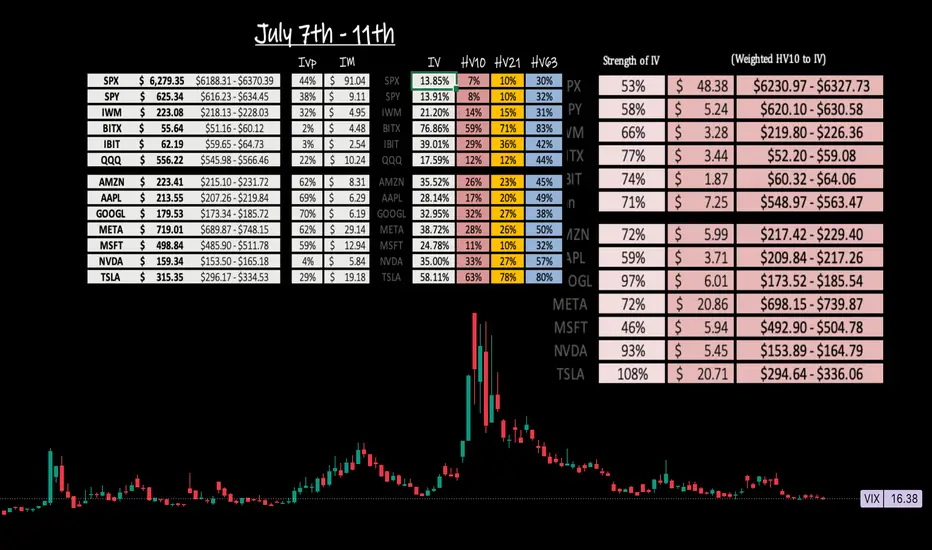
Weekly Volatility SnapshotGood Evening -- Happy July 4th to everyone
Let us review last week as we look towards the next in anticipation of the trade deal deadline that looms. I had a target on the SP:SPX of $6,253.59 and the weekly high was $6,284.65. The candle on the short week opened at its low of $6,019.21 and closed $6,233.08 making the weekly range +$213.87. This represents closest to HV63 over IV which stated +/-$253.26 and a 'strength of IV' that was 295% . Again the weekly high is above our range target, but my volatility will always be measured close-to-close.
Now as we look towards this week --
IV (13.85%) has shifted upwards slightly with HV10 (7.36%) hinged down and still lowering. In fact, I have bi-weekly volatility as 97.28% 'coiled' to it's sliding yearly low of 4.64% -- HV21 (9.92%) is closer to what IV states with it being 'coiled' 96.61% to it's respective sliding yearly lows.
In my opinion, volatility still has room to consolidate slightly as markets rotate higher. I think we can see upwards $6,327.73, but slowly over the course of the week with the last tariff uncertainty getting out of the way. From there, going into mid July we may need to see a volatility spike. The HV10 range I am watching holds a 'strength of IV' entering this week of only 53% -- this shows the price per move is expensive by almost twice as much.
Till next time, know your ABCs, have a great long weekend, and stay hedge!
CHEERS
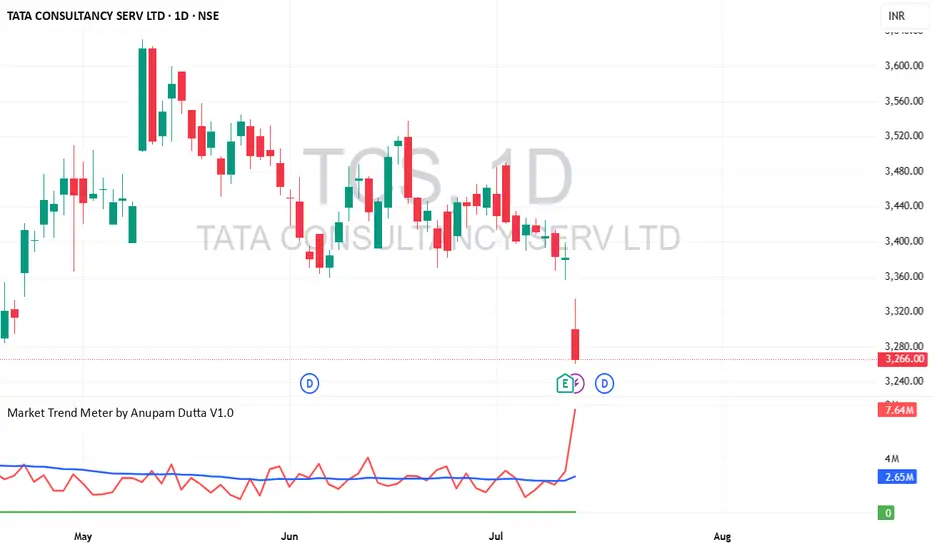
TCS Long Opportunity - Medium-Term Swing Trade📈 TCS Long Opportunity – Medium-Term Swing Trade
🔹 Entry : ₹3266 (Last Close)
🔹 Target : ₹3525
🔹 Qty : Up to 25 shares
🔹 Timeframe : ~6 months
🔹 Estimated ROI : ~16.49% annualized
A moderate-risk swing setup on Tata Consultancy Services . Technically and fundamentally aligned for gradual upside, assuming market conditions stay favorable. Entry near current levels with a well-defined target.
⚠️ Trade only if you're comfortable with the risk of capital loss. Position sizing is key.