Divergence into a Reversal?? - AUHere I have AUD/USD on the 1Hr Chart!
Our two current Lows @ ( .9498 ) on Wed. April 10th and ( .9456 ) on Fri. April 12th show an interesting underlying story when it comes to our indicators!
1) Looking to the RSI and comparing the Lows to Price on the chart, we can see that the RSI is showing a STRONG Divergence meaning Price could potentially be looking to move up now!
2) Our Momentum & Volatility indicators are showing Consolidation or Sideways movement meaning there is really no more trend left to be found.
Now this Divergence leads me to believe that if Price works back up to the CONFIRMATION of PATTERN @ .6545, we could see the VALIDATION of this PATTERN and look for trading opportunities!
CONFIRMATION of PATTERN @ .6545
INVALIDATION of PATTERN @ .6456
Volatility

PG slow and steady long term winner with earnings coming LONGPG on the weekly chart gained 15% in a year and had a dip in the past two weeks with earnings
at the end of this week. PG persistently and consistently beats earnings estimates and pays a
dividend. Moreover, it consistently has a bit of a surge after earnings. I see this as an
opportunity to get a good stock on a 4% dip of a discount and hold it through earnings for
perhaps a 10% profit in two weeks while also picking up the quarterly dividend. Some traders
including those institutionally based believe that buying near to the middle line of the Bollinger
Bands is a good entry for getting fair value. I am one of them.

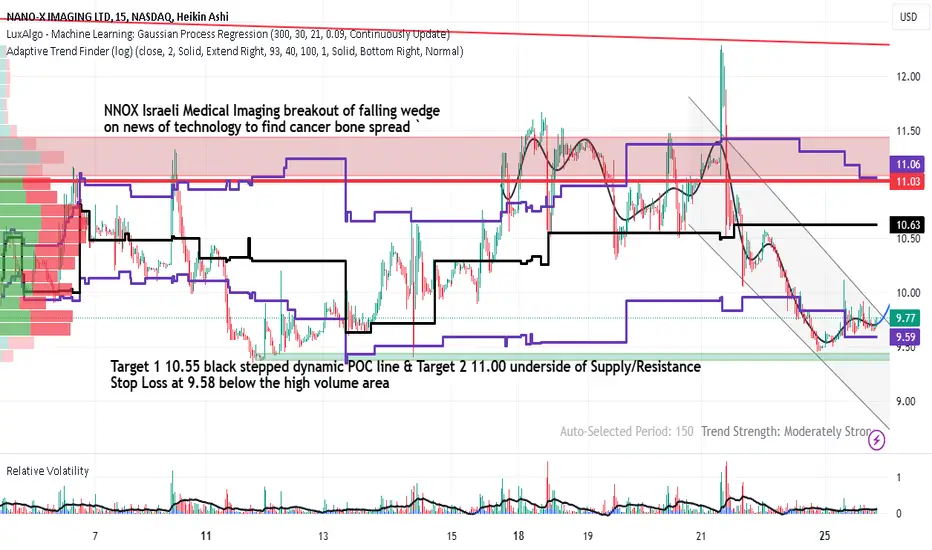
NNOX MedTech Company LONG on NewsNNOX is shown on the 15 minute chart along with word clips of the idea including entry and
exit parameters. NNOX is gaining growth from AI integration. What a surprise 😲
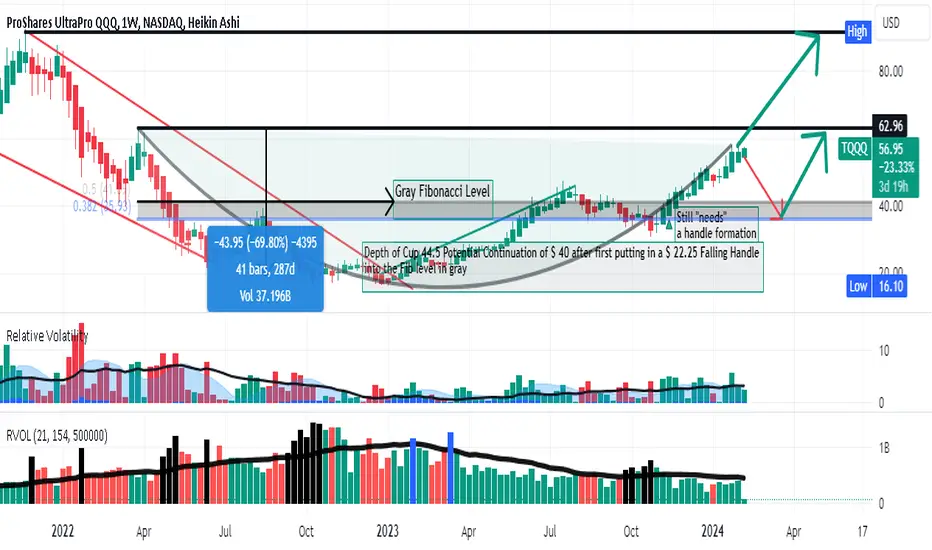
TQQQ - Cup awaiting Handle ?TQQQ on a weekly chart in 2021 ascended into a falling wedge. As part of the falling wedge,
it started the downside initial part of a cup and handle pattern. The reversal occurred 11
months ago with the upside completion of the cup back to 57.5 In the typical cup and handle,
the handle then forms in a 50% retracement of the height of the cup. the cup height measures
44.5 over a period of about 9 months. Notably relative volumes peaked at the bottom of the
pattern. Once the retracement is complete, bullish continuation should occur to the extent of
the height of the cup above the lip. That is to say an uptrend from 57.5 adding 44.5 to get to
102 more or less. But first the retracement and reversal must occur.
Accordingly, if this is an incomplete cup and handle, it forecasts a retracement of 44.5 divided
by 2 or to about 38 as shown by the Fib retracement tool. After that price must reverse
then overcome the resistance of the lip of the cup ( 57.5) and continue to 102.
Overall, this forecasts that a bearish crash is in store for TQQQ ( as well as QQQ from which
it is leveraged). Time will tell if this pattern has given an accurate forecast. In the meanwhile,
I will watch for signs of QQQ topping out on the weekly time frame after the same signs on
lower time frames. The alternative view is that TQQQ is building an even bigger cup
right now with the lip at about 88 when the price had a high pivot down on November 22, 2021.
So, do you see a bigger or smaller cup pattern or none at all?
LYFT rises on news of the MSP dispute potential resolution LONGLYFT was a recent idea upload. The news regarding MSP and the dispute resolution has helped
it rise off the ascending support trendline of the rising wedge pattern. The pattern may predict
decreasing volatility towards price consolidation and then a break out from the wedge.
In the meanwhile, I have added to my position since price is above the support trendline.
The PVT indicator shows a flip out on the pullback and I see this as a good add long entry. On a
low 1minute time frame. price gapped up with an engulfing candle with corresponding volume
at the opening bell today.
Importantly, a high volume spike also occurred in the after-market hours.
My recent previous idea long on LYFT is linked here.
The call option for $ 21.00 for April 19- 8DTE popped 140% today. I picked up a decent number of calls and will close them incrementally as they profit over the next week.

Waiting for the Bitcoin Bull Run: A Look at MDIAThe recent sideways movement in the Bitcoin market has many investors wondering when the next bull run will begin. Blockchain intelligence firm Santiment suggests a specific metric to watch: the Mean Dollar Invested Age (MDIA).
Understanding MDIA:
The MDIA tracks the average age of investments in Bitcoin held within the same wallet addresses. When the MDIA rises, it signifies that coins are being held for longer periods, with less movement or trading activity. This could indicate:
• Investor Stagnation: Existing holders are content with their positions and not actively buying or selling.
• Whales Holding: Large investors, often nicknamed "whales," might be accumulating or holding onto their Bitcoin, reducing overall market circulation.
MDIA and Bull Run Continuation:
According to Santiment, a falling MDIA suggests renewed movement from long-held coins. This could signal:
• Increased Investor Confidence: A drop in MDIA might indicate that major stakeholders (whales) are returning their Bitcoin to active circulation, potentially fueling a price increase.
• Fresh Investment: New investors entering the market with fresh capital could also contribute to a decline in MDIA.
Current Market Situation (as of April 13, 2024):
• Bitcoin is experiencing a price decline, potentially reflecting investor uncertainty.
• It's important to note that MDIA is just one indicator, and other factors can influence market movements.
Additional Considerations:
• Market Sentiment: Broader market sentiment and external factors can significantly impact Bitcoin's price. Analyzing news and economic data alongside MDIA can provide a more holistic view.
• Technical Analysis: Technical indicators like price charts and trading volume can offer further insights into potential price movements.
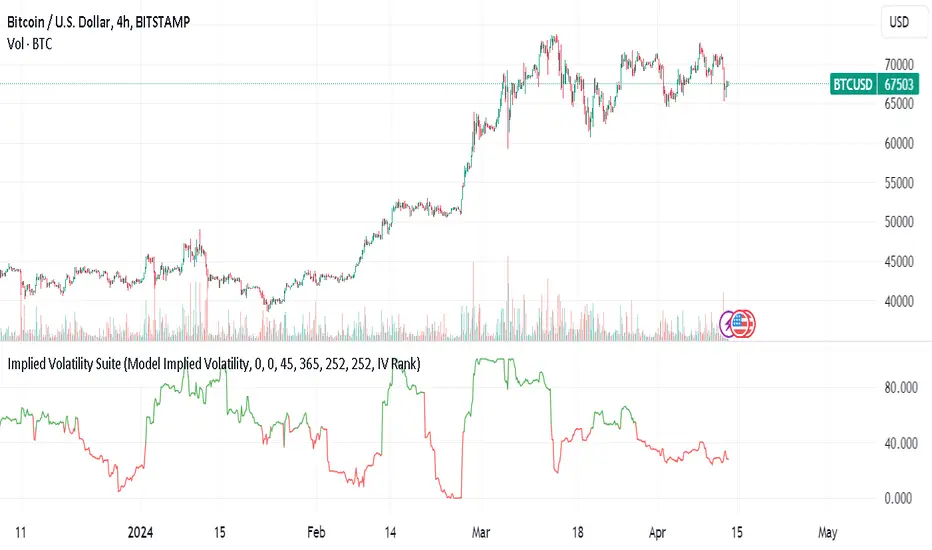
Beyond MDIA: Implied Volatility
The recent rise in implied volatility for Bitcoin options suggests increased market uncertainty. Implied volatility reflects the market's expectation of price fluctuations within a specific timeframe. A rise indicates:
• Investor Hesitation: Investors might be unsure about the future direction of Bitcoin's price.
• Increased Risk Premium: Option traders are demanding a higher premium to account for the perceived volatility.
Conclusion
The MDIA is a valuable tool for gauging investor behavior and potential shifts in the Bitcoin market. While a falling MDIA can be a bullish sign, it's crucial to consider other factors like implied volatility and broader market sentiment for a comprehensive understanding. By combining MDIA analysis with other technical and fundamental indicators, investors can make more informed decisions in the dynamic world of cryptocurrency.
Further Research:
• Santiment: santiment.net
• Implied Volatility: www.investopedia.com
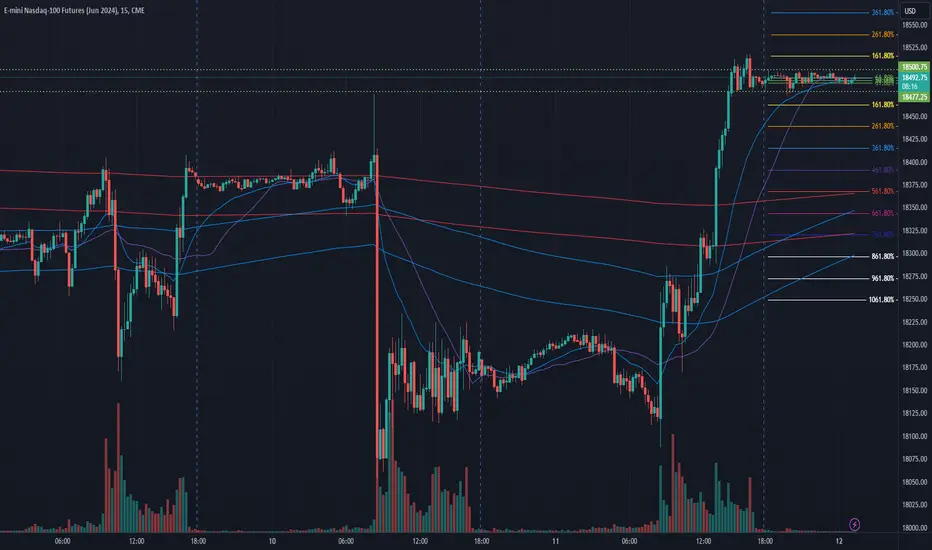
NQ Power Range Report with FIB Ext - 4/12/2024 SessionCME_MINI:NQM2024
- PR High: 18501.75
- PR Low: 18477.00
- NZ Spread: 55.25
No significant calendar events
Value back inside of range above 18400
- Prev session closed as engulfing bar
- Weekly high lift following widest session range of the week
- Holding value near prev session close, below the high
Evening Stats (As of 1:05 AM)
- Weekend Gap: +0.27% (filled)
- Gap 10/30 +0.47% (open < 14272)
- Session Open ATR: 260.80
- Volume: 16K
- Open Int: 261K
- Trend Grade: Bull
- From BA ATH: -1.0% (Rounded)
Key Levels (Rounded - Think of these as ranges)
- Long: 18675
- Mid: 18106
- Short: 16963
Keep in mind this is not speculation or a prediction. Only a report of the Power Range with Fib extensions for target hunting. Do your DD! You determine your risk tolerance. You are fully capable of making your own decisions.
BA: Back Adjusted
BuZ/BeZ: Bull Zone / Bear Zone
NZ: Neutral Zone
SOUN a small cap AI stock ready for a VWAP reversal LONGSOUN on the 15 minute chart as fallen again to the anchored mean VWAP. Each previous
time this has occurred in the past month, price has bounced into the second or third upper
VWAP band line for a bullish momentum move. The mean VWAP is where big players like
to pick up and drop off shares. Liquidity is at the highest. Teh Relative Trend Indicator will
show best entries where the trend is negative but the returns to the chop zone to climb
out of it and go positive. This indicator can function with alerts and notifications. SOUN
uses AI and voice control of it to make apps more user friendly and potent. A similiar stock
is DuoLingo ( DUOL) which also adds language translation into the functionality. Those on a
budget in their trading love the price. Those not on a budget make love the volatility and the
quick profits it can bring if traded properly.

NYCB could bounce back from the inflation report LONGNYCB on the 30 minute chart had an abrupt reaction to the inflation report. This is not a
surprise. Many traders and investors know that banks make more money when the prime rate
is lower because they do not need to pay much on savings accounts and deposit certificates.
NYCB has been challenged and is more volatile than the average bank stock being a penny
stock with hard fundamental issues. NYCB has reversed and the relative volume indicator
shows the flip. Price has climbed back into the lower part of the high volume area of the
profile which shows some bullish momentum.
I see this as a risky long trade but still take it for the quick 6-7% upside back to the POC line of
the volume profile. The stop loss will be the low pivot of the prior trading session.

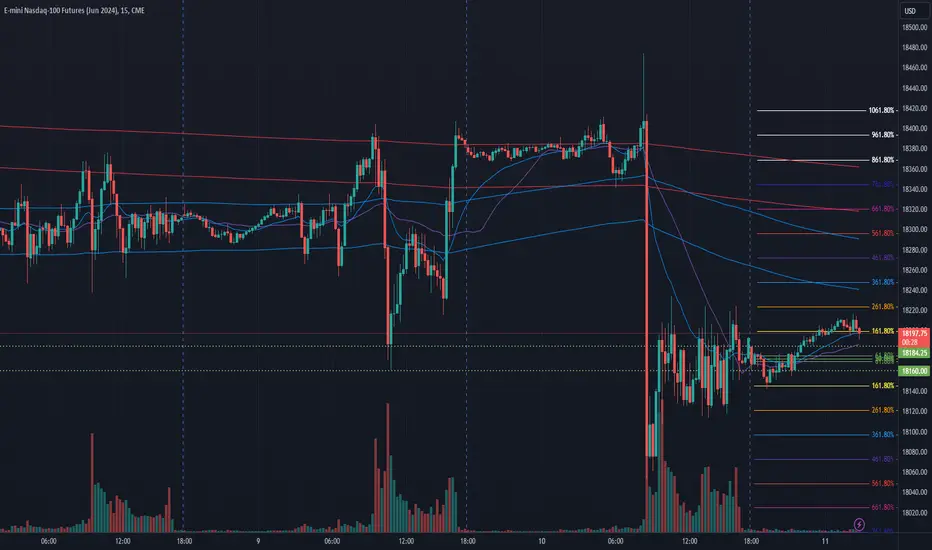
NQ Power Range Report with FIB Ext - 4/11/2024 SessionCME_MINI:NQM2024
- PR High: 18190.75
- PR Low: 18160.00
- NZ Spread: 68.75
Key economic calendar events
08:30 | Initial Jobless Claims
- PPI
13:00 | 30-Year Bond Auction
Another margin increase from AMP for expected vol spike
- Potential daily inside print
- Holding near prev session close
- >100 points from prev session low
Evening Stats (As of 12:05 AM)
- Weekend Gap: +0.27% (filled)
- Gap 10/30 +0.47% (open < 14272)
- Session Open ATR: 252.47
- Volume: 22K
- Open Int: 256K
- Trend Grade: Bull
- From BA ATH: -2.7% (Rounded)
Key Levels (Rounded - Think of these as ranges)
- Long: 18675
- Mid: 18106
- Short: 16963
Keep in mind this is not speculation or a prediction. Only a report of the Power Range with Fib extensions for target hunting. Do your DD! You determine your risk tolerance. You are fully capable of making your own decisions.
BA: Back Adjusted
BuZ/BeZ: Bull Zone / Bear Zone
NZ: Neutral Zone
NQ Power Range Report with FIB Ext - 4/10/2024 SessionCME_MINI:NQM2024
- PR High: 18384.25
- PR Low: 18370.75
- NZ Spread: 30.0
Key economic calendar events
08:30 | CPI (3x)
10:30 | Crude Oil Inventories
13:00 | 10-Year Note Auction
14:00 | FOMC Meeting Minutes
AMP margin increase for expected vol spike
Evening Stats (As of 12:05 AM)
- Weekend Gap: +0.27% (filled)
- Gap 10/30 +0.47% (open < 14272)
- Session Open ATR: 238.30
- Volume: 11K
- Open Int: 259K
- Trend Grade: Bull
- From BA ATH: -1.6% (Rounded)
Key Levels (Rounded - Think of these as ranges)
- Long: 18675
- Mid: 18106
- Short: 16963
Keep in mind this is not speculation or a prediction. Only a report of the Power Range with Fib extensions for target hunting. Do your DD! You determine your risk tolerance. You are fully capable of making your own decisions.
BA: Back Adjusted
BuZ/BeZ: Bull Zone / Bear Zone
NZ: Neutral Zone
VBIV is having an abnormal day in price and volumeBoth the price and the volume shows an Alpha characteristics. There is a potential.

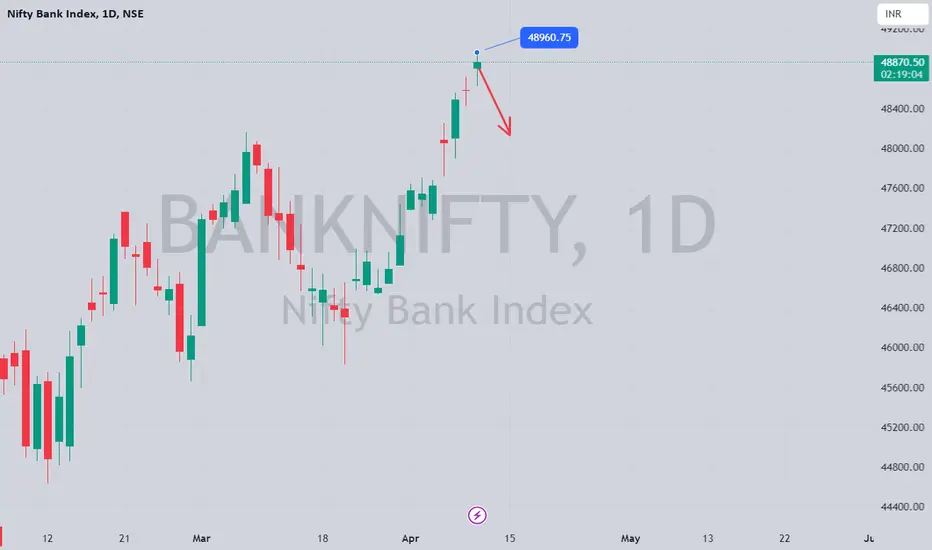
Bank Nifty Index: Will 48600 Level Hold for Weekly expiry?Today, on the 9th of April 2024, the Bank Nifty Index displayed notable price movements, reaching an intraday high of 48960.75 and a low of 48621.85. This suggests that the 48600 level is serving as a robust support. However, the crucial question remains: will this level maintain its strength leading up to tomorrow's weekly expiry (10th of April 2024)?
To delve into this inquiry, we must scrutinize the 48600 put option. As of the time of writing this post, the put option reached an intraday high of 206.40 and a low of 62.60. Notably, as long as this put option remains above 6.60, its probability of expiring in the money remains significantly high. Conversely, if it drops below 6.60, the likelihood of expiring in the money diminishes close to zero.
In conclusion, the analysis of the 48600 put option sheds light on the potential stability of the 48600 level as a support going into the Bank Nifty Index options weekly expiry tomorrow.
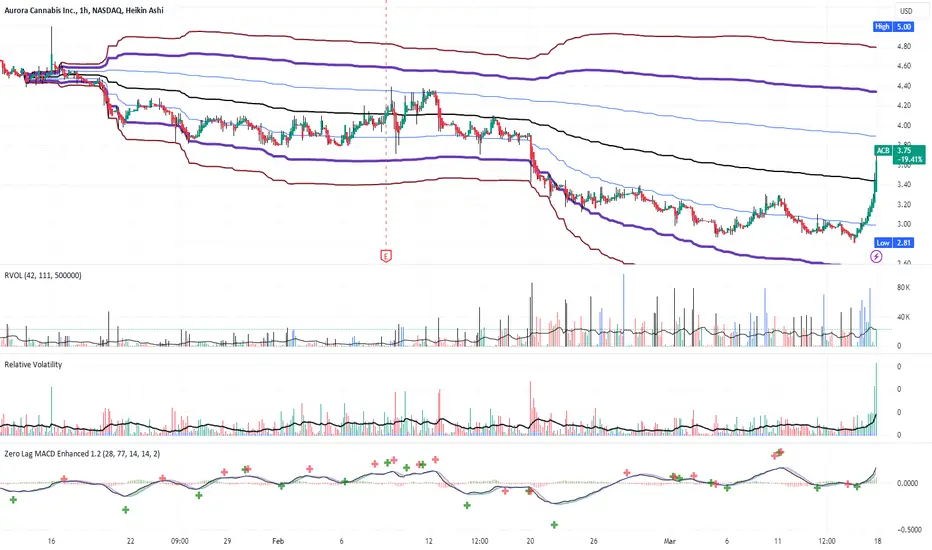
ACB Cannabais Peeny Stock with News LONGCannabis socks got a boost in the past day as the Biden administration seeks a reclassification
of cannabis with the Drug Enforcement Agency ( DEA) This will likely give the entire sector
some momentum. Here on a 60 minute chart, Aurora ACB is seen in a VWAP band breakout,
crossing over the fair vlaue area of the mean VWAP accompanied on the indicators with
confirmatory volume and volatility. On the zero lag MACD, the lines have crossed above the
zero horizontal and above the histogram. I see this as an excellent long entry targeting 4.35
which was the pivot high after the last earnings. This represents a conservative 17-20% upside
with potential upside beyond that price level given the potential impact of the federal news.
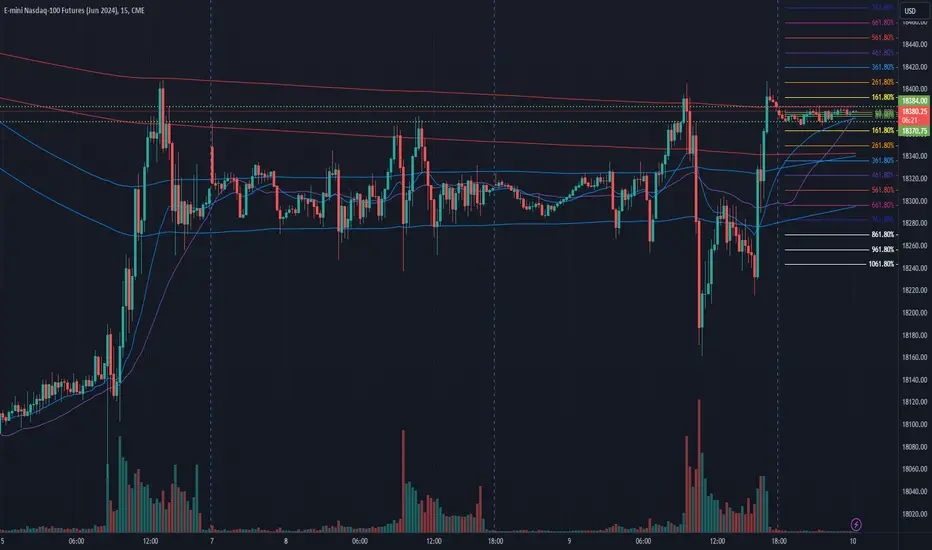
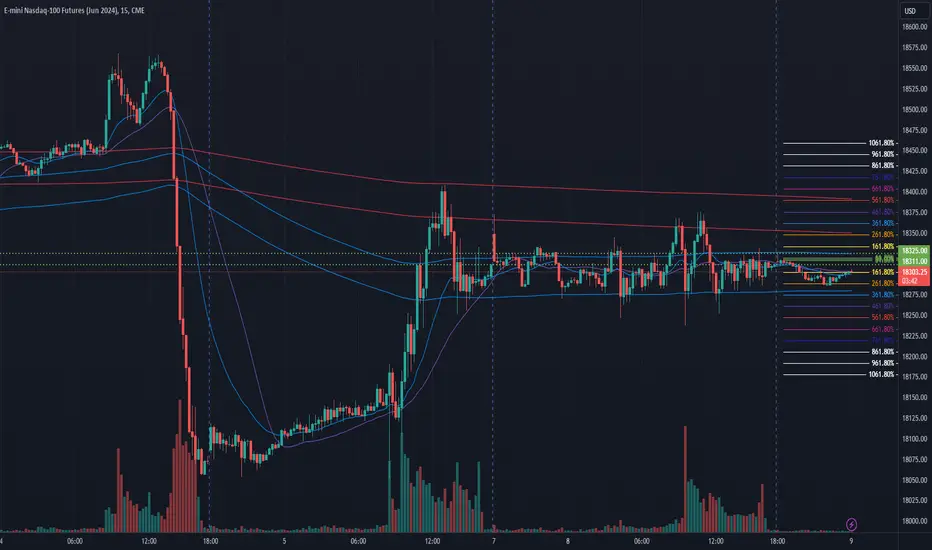
NQ Power Range Report with FIB Ext - 4/9/2024 SessionCME_MINI:NQM2024
- PR High: 18324.75
- PR Low: 18311.25
- NZ Spread: 30.0
No significant economic calendar events
Relatively tight range prev session
- Holding Friday's highs, above the close
- Relatively low volume
Evening Stats (As of 12:05 AM)
- Weekend Gap: +0.27% (filled)
- Gap 10/30 +0.47% (open < 14272)
- Session Open ATR: 240.45
- Volume: 12K
- Open Int: 261K
- Trend Grade: Bull
- From BA ATH: -2.0% (Rounded)
Key Levels (Rounded - Think of these as ranges)
- Long: 18675
- Mid: 18106
- Short: 16963
Keep in mind this is not speculation or a prediction. Only a report of the Power Range with Fib extensions for target hunting. Do your DD! You determine your risk tolerance. You are fully capable of making your own decisions.
BA: Back Adjusted
BuZ/BeZ: Bull Zone / Bear Zone
NZ: Neutral Zone
SMG- it's spring time for SMG to make some green LONGSMG has good reason to trend up- the spring brings out consumers looking to get their lawn
off to a good start and the rise in marijuana stocks on the run-up to April 20th and the recent
legislative catalysts in Germany and Florida bring Scott's into focus as cultivators often use
it in their soil-based and hydroponic grow operations. The indicators show price momentum
and adequate volume to support a move higher. The predictive algorithm forecasts that move.
I will take a long position here targeting 86, the pivot high of 11 months ago.

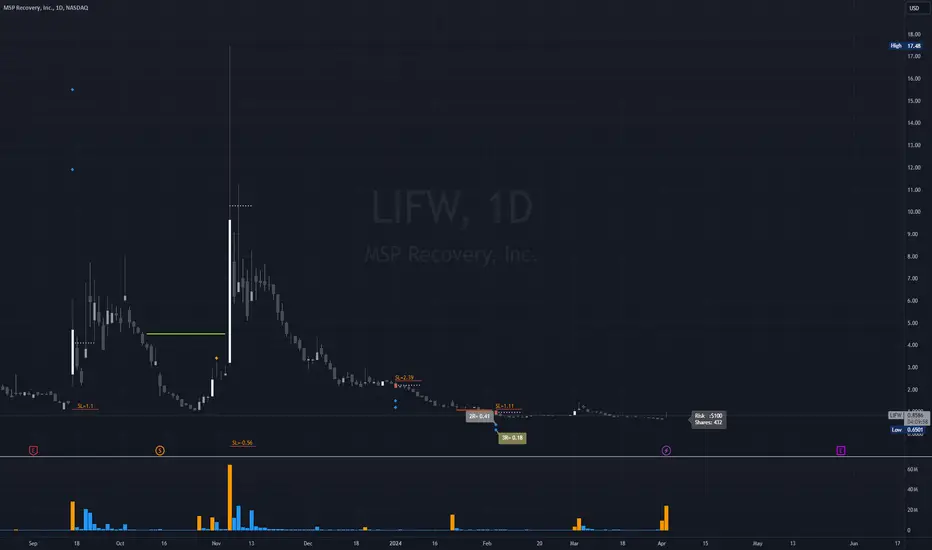
LIFW volume increase, upside potentialcurrently it is sitting at 0.86 and has a huge volume. Biting some, and see what happens. Way too early to predict, may be by the end of today, it might give an Alpha candle on the price.
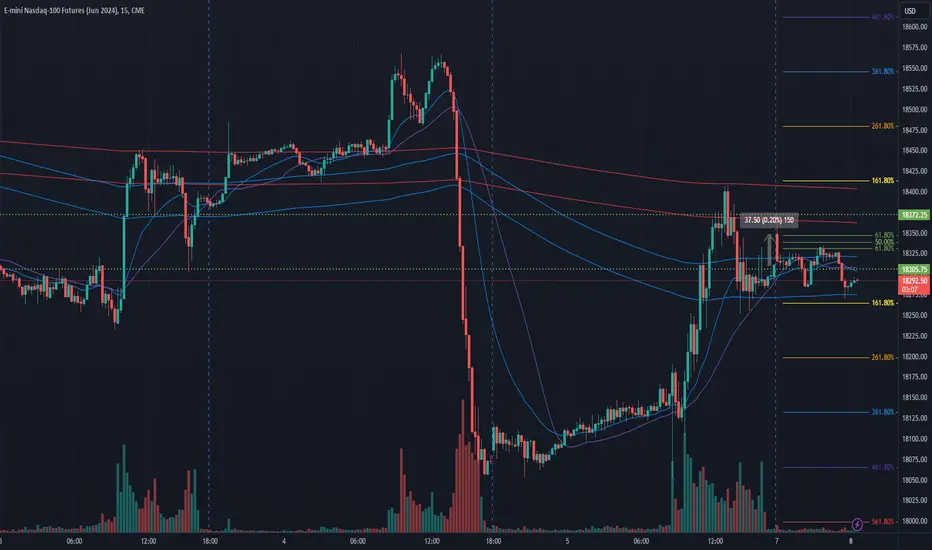
NQ Power Range Report with FIB Ext - 4/8/2024 SessionCME_MINI:NQM2024
- PR High: 18373.50
- PR Low: 18305.00
- NZ Spread: 153.0
No key economic calendar events
- low event week with bonds
Retraced roughly 50% of prev week range
- Holding Friday's highs
- Below Friday close following quick weekend gap fill
Evening Stats (As of 12:05 AM)
- Weekend Gap: +0.27% (filled)
- Gap 10/30 +0.47% (open < 14272)
- Session Open ATR: 253.27
- Volume: 28K
- Open Int: 261K
- Trend Grade: Bull
- From BA ATH: -2.2% (Rounded)
Key Levels (Rounded - Think of these as ranges)
- Long: 18675
- Mid: 18106
- Short: 16963
Keep in mind this is not speculation or a prediction. Only a report of the Power Range with Fib extensions for target hunting. Do your DD! You determine your risk tolerance. You are fully capable of making your own decisions.
BA: Back Adjusted
BuZ/BeZ: Bull Zone / Bear Zone
NZ: Neutral Zone
LITECOIN quick short in the next hours, 1:3 trade
huge volume void to target ,
bullish momentum is weakening,
lots of stop losses below the lows of past days
I expect a sharp drop, trailing stop every 2 consecutive buying candles (4h chart)

Quick Trade Idea for the next hours...We are consolidating around the 67 K, near the POC of the last days.
In order to take the trade I want to see a close below 69K in the next 8 hours.
Let's get a quick short

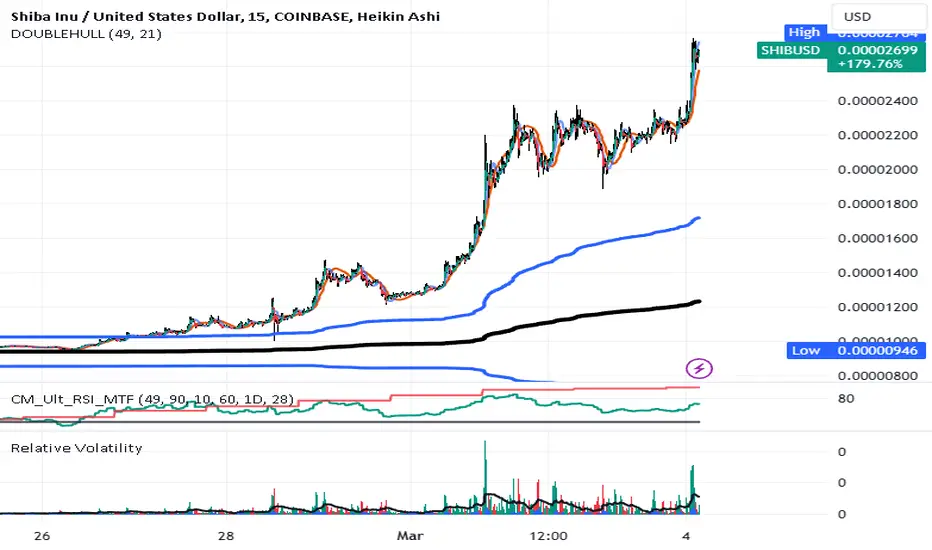
SHIBUSD need to rest LONG again laterShiba Inu has pushed quite hard. I can only think of sled dogs ona long marathon push over a
sun prepared snow trail. The ride might be frictionless but nonetheless grueling and perhaps
time for a rest. The chart shows the breakout and then extension above the VWAP lines that
are trying to catch up. In proper risk management. I will take half the position off here and
have it ready to add at least part of it back if the rest is a stable consolidation in the upcoming
day.
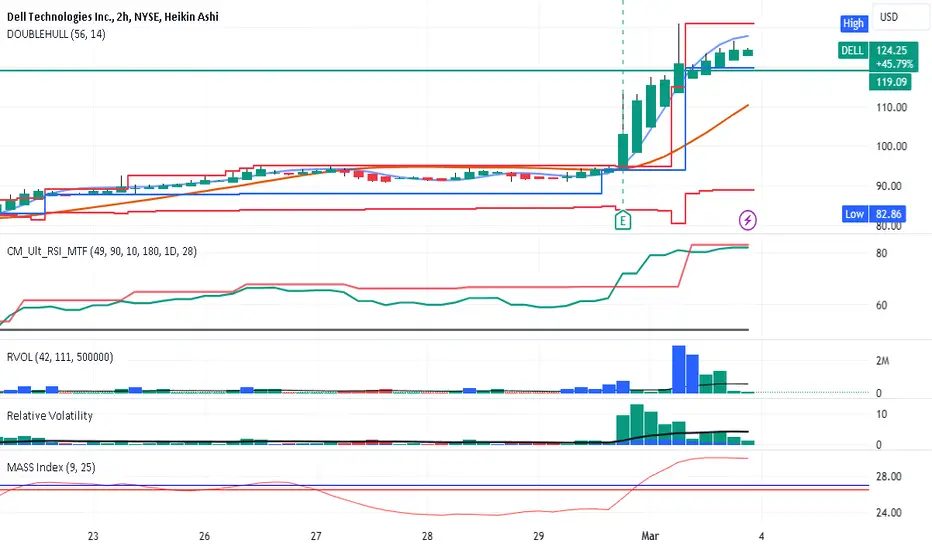
DELL pushes price with a big earnings beat LONGDELL reported earnings 27% beyond the estimates and traders reacted. The indicators show
that relative volume was about 10X the running moving average. The RSI dual time frame
indicator ( by Chris Moody) showed a 50-level cross-over on 2/22 one week before earnings.
That was the best early entry and price is up 20% higher since then. The question is whether
is is overextending and so will retrace. The mass index indicator is suggestive of a reversal.
Overall, I will watch price action for bullish continuation while considering the possibility
of a short sell into a retracement if it evolves. No matter volatility is increased I intend
to make the best possible trade in response to what develops.
NKTX: A technical perspectiveNASDAQ:NKTX is a clinical-stage biopharmaceutical company, develops and commercializes natural killer cell therapies for cancer and autoimmune disease treatment. While highly speculative, the daily charts have presented a purchasing opportunity after a stock offering to raise capital.
MACD and TTM Squeeze tend to be reversing, and selling pressure seems to slow. I expect price to bounce off of the critical support level around 8.47. A price below 8.47 justifies a premium valuation of the underlying.
Short-term price action appears to be slightly bearish, but the conditions are right for a reversal. Biotechnology stocks tend to be highly volatile, make sure to manage your risk correctly before making a trade. My R:R ratio is around 5:1 with a SL at 8.08.
