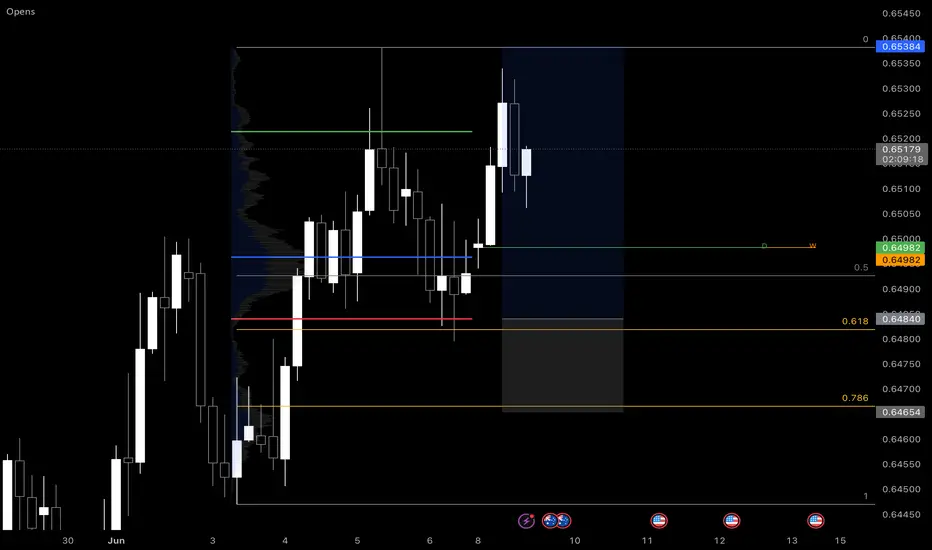
Pines-Capital Trade IdeaThe chart shows a bullish daily structure with a higher volume range and positive momentum. The first long idea is based on a pullback to the value area high or the 0.5 Fibonacci zone around 0.6498. Should the market test this area and show buyers there, this would be an opportunity for a long entry with a target in the area of the recent high at 0.6538. The stop can be placed slightly below the 0.618 level at 0.6484.
A second long opportunity arises on a breakout above the recent high at 0.6538. If the price breaks above this zone with volume and stabilizes there, a procyclical long can be entered with a target towards 0.6560+ (next psychological level). The stop should be placed just below the breakout level.
Volatility
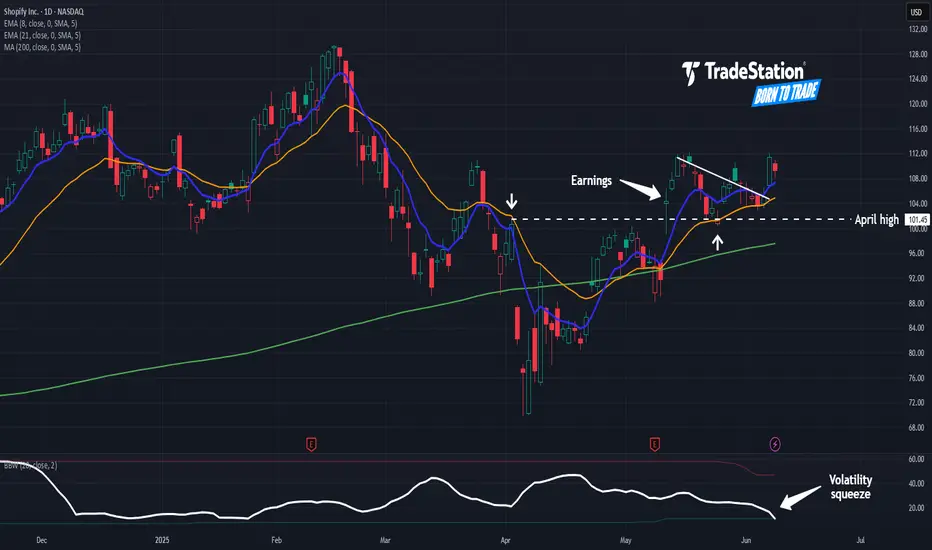
Shopify Escapes Tight ConsolidationShopify has been trapped in a tight range, but now the e-commerce stock may be breaking out.
The first pattern on today’s chart is the falling trendline since May 14 (based on closing prices). SHOP ended Friday above it, which may draw fence-sitters from the sidelines.
Second is the April high of $101.45. Prices tested below that level on May 23 but held. Has old resistance become new support?
Third is the narrowing Bollinger Band Width. Such a volatility squeeze may create potential for prices to expand following a period of compression.
Next, the 8-day exponential moving average (EMA) has stayed above the 21-day EMA. That may reflect short-term bullishness.
Finally, prices are near the rising 200-day simple moving average. That may suggest a longer-term uptrend is still in effect.
Check out TradingView's The Leap competition sponsored by TradeStation.
TradeStation has, for decades, advanced the trading industry, providing access to stocks, options and futures. If you're born to trade, we could be for you. See our Overview for more.
Past performance, whether actual or indicated by historical tests of strategies, is no guarantee of future performance or success. There is a possibility that you may sustain a loss equal to or greater than your entire investment regardless of which asset class you trade (equities, options or futures); therefore, you should not invest or risk money that you cannot afford to lose. Online trading is not suitable for all investors. View the document titled Characteristics and Risks of Standardized Options at www.TradeStation.com . Before trading any asset class, customers must read the relevant risk disclosure statements on www.TradeStation.com . System access and trade placement and execution may be delayed or fail due to market volatility and volume, quote delays, system and software errors, Internet traffic, outages and other factors.
Securities and futures trading is offered to self-directed customers by TradeStation Securities, Inc., a broker-dealer registered with the Securities and Exchange Commission and a futures commission merchant licensed with the Commodity Futures Trading Commission). TradeStation Securities is a member of the Financial Industry Regulatory Authority, the National Futures Association, and a number of exchanges.
TradeStation Securities, Inc. and TradeStation Technologies, Inc. are each wholly owned subsidiaries of TradeStation Group, Inc., both operating, and providing products and services, under the TradeStation brand and trademark. When applying for, or purchasing, accounts, subscriptions, products and services, it is important that you know which company you will be dealing with. Visit www.TradeStation.com for further important information explaining what this means.
Delta Air Lines: Potential BreakoutDelta Air Lines has squeezed into a tight range, and some traders may think it’s breaking out.
The first pattern on today’s chart is the series of lower highs since May 13. DAL closed above that falling trend line last Friday, which could mean the resistance has been overcome.
The move resulted in a bullish outside week, immediately after a bullish inside week. That’s potentially consistent with prices consolidating before moving again.
Bollinger Band Width compression in the lower study may substantiate that view. (Notice the potential volatility squeeze taking shape.)
Next, the airline held a 50 percent retracement of its surge between April 30 and May 12. Does that suggest movement is pointing higher?
Finally, the 8-day exponential moving average (EMA) has stayed above the 21-day EMA. That may also be consistent with a short-term uptrend.
Check out TradingView's The Leap competition sponsored by TradeStation.
TradeStation has, for decades, advanced the trading industry, providing access to stocks, options and futures. If you're born to trade, we could be for you. See our Overview for more.
Past performance, whether actual or indicated by historical tests of strategies, is no guarantee of future performance or success. There is a possibility that you may sustain a loss equal to or greater than your entire investment regardless of which asset class you trade (equities, options or futures); therefore, you should not invest or risk money that you cannot afford to lose. Online trading is not suitable for all investors. View the document titled Characteristics and Risks of Standardized Options at www.TradeStation.com . Before trading any asset class, customers must read the relevant risk disclosure statements on www.TradeStation.com . System access and trade placement and execution may be delayed or fail due to market volatility and volume, quote delays, system and software errors, Internet traffic, outages and other factors.
Securities and futures trading is offered to self-directed customers by TradeStation Securities, Inc., a broker-dealer registered with the Securities and Exchange Commission and a futures commission merchant licensed with the Commodity Futures Trading Commission). TradeStation Securities is a member of the Financial Industry Regulatory Authority, the National Futures Association, and a number of exchanges.
TradeStation Securities, Inc. and TradeStation Technologies, Inc. are each wholly owned subsidiaries of TradeStation Group, Inc., both operating, and providing products and services, under the TradeStation brand and trademark. When applying for, or purchasing, accounts, subscriptions, products and services, it is important that you know which company you will be dealing with. Visit www.TradeStation.com for further important information explaining what this means.

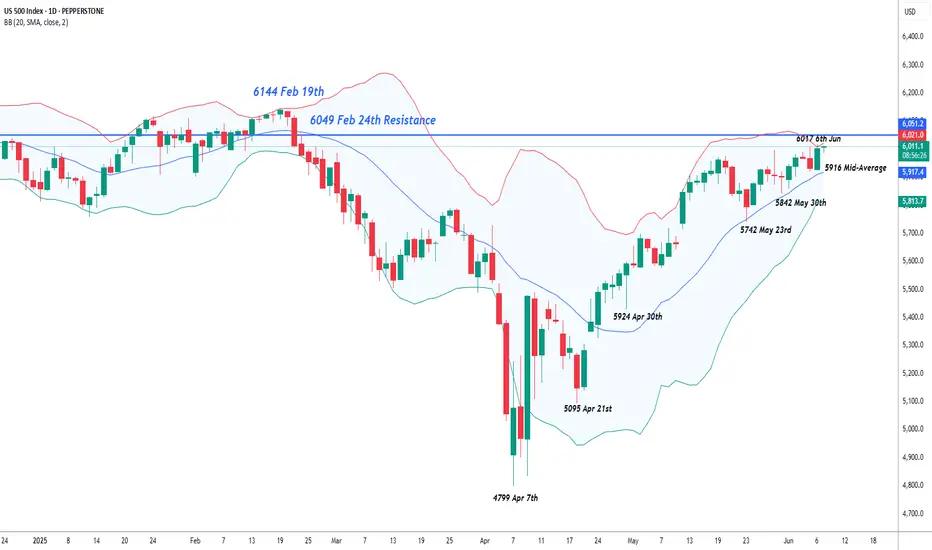
US 500 Index – All Time Highs Back in SightFresh optimism regarding trade negotiations between the US and China, coupled with confirmation on Friday that the US labour market is cooling down slowly and not indicating an imminent US recession, has seen the US 500 index open this morning at 4 month highs, bumping up against the psychological 6000 again, with its all time peak of 6144 (February 19th) back in sight.
Looking forward, this could be a pivotal week for the US 500, with a variety of risk events for traders to consider, all of which may have the potential to impact the direction of risk sentiment into the Friday close.
First up, later today, traders will be eagerly awaiting updates from the second round of trade talks between US and Chinese trade teams, who are tasked with defusing tensions regarding the supply of rare earth minerals and advanced technology.
Then, on Wednesday (CPI 1330 BST) and Thursday (PPI 1330 BST) the next round of US inflation updates for May are released. These could be relevant to traders who have become more sensitive to potential price rises due to the impact of President Trump's trade tariffs. Any surprise deviations from expectations in either of these releases could see an increase in US 500 index volatility.
Putting this all together with any fresh reports outlining progress on trade deals between the US and Japan or the EU, and it could be a volatile week in store. With this in mind, it can be helpful to consider the technical indicators and trends.
Technical Update: Focus on the Bollinger Mid Average
While some may have argued for a slowing in upside momentum of the recent US 500 index advance, price weakness has continued to be limited in both time and extent.
Importantly, as the chart above shows, when short term setbacks in price have recently materialised, it has been the rising Bollinger mid-average that has marked a support focus.
This maintains the potential of a more constructive picture and positive price trend, where buyers have been happy to pay a higher price each time that weakness is seen, and have been able to push the index above previous peaks in price, to new recovery highs.
Of course, there is no guarantee this pattern of higher highs and higher lows in price will extend further, but traders may well be focusing on this type of pattern as having the potential to lead to a more sustained phase of price strength.
What are the potential support and resistance levels that traders may be watching this week for clues to the direction of the next possible price move?
Potential Resistance Levels:
Further evidence that a positive trend in price could still be in place came on Friday, as a new recovery price high at 6017 was posted.
Traders may now be watching how a previous price high at 6049, which was posted on February 24th is defended, as closing breaks may see further attempts to push to higher levels. Such moves could then lead to further price strength towards 6144, the February 19th all-time high.
Potential Support Levels:
Having held and turned price activity higher over previous tests, it may well still be the rising Bollinger mid-average, which currently stands at 5916 that represents a possible support focus this week.
Closes below this level while not confirmation of a more extended phase of price weakness, may see a deeper decline to test 5842, the May 30th session low, even on to the 5742 level, which is equal to the low posted on May 23rd.
The material provided here has not been prepared in accordance with legal requirements designed to promote the independence of investment research and as such is considered to be a marketing communication. Whilst it is not subject to any prohibition on dealing ahead of the dissemination of investment research, we will not seek to take any advantage before providing it to our clients.
Pepperstone doesn’t represent that the material provided here is accurate, current or complete, and therefore shouldn’t be relied upon as such. The information, whether from a third party or not, isn’t to be considered as a recommendation; or an offer to buy or sell; or the solicitation of an offer to buy or sell any security, financial product or instrument; or to participate in any particular trading strategy. It does not take into account readers’ financial situation or investment objectives. We advise any readers of this content to seek their own advice. Without the approval of Pepperstone, reproduction or redistribution of this information isn’t permitted.
NQ Power Range Report with FIB Ext - 6/9/2025 SessionCME_MINI:NQM2025
- PR High: 21820.75
- PR Low: 21730.25
- NZ Spread: 202.25
No key scheduled economic events
Session Open Stats (As of 12:15 AM 6/9)
- Session Open ATR: 406.53
- Volume: 25K
- Open Int: 272K
- Trend Grade: Neutral
- From BA ATH: -4.0% (Rounded)
Key Levels (Rounded - Think of these as ranges)
- Long: 22096
- Mid: 20383
- Short: 19246
Keep in mind this is not speculation or a prediction. Only a report of the Power Range with Fib extensions for target hunting. Do your DD! You determine your risk tolerance. You are fully capable of making your own decisions.
BA: Back Adjusted
BuZ/BeZ: Bull Zone / Bear Zone
NZ: Neutral Zone
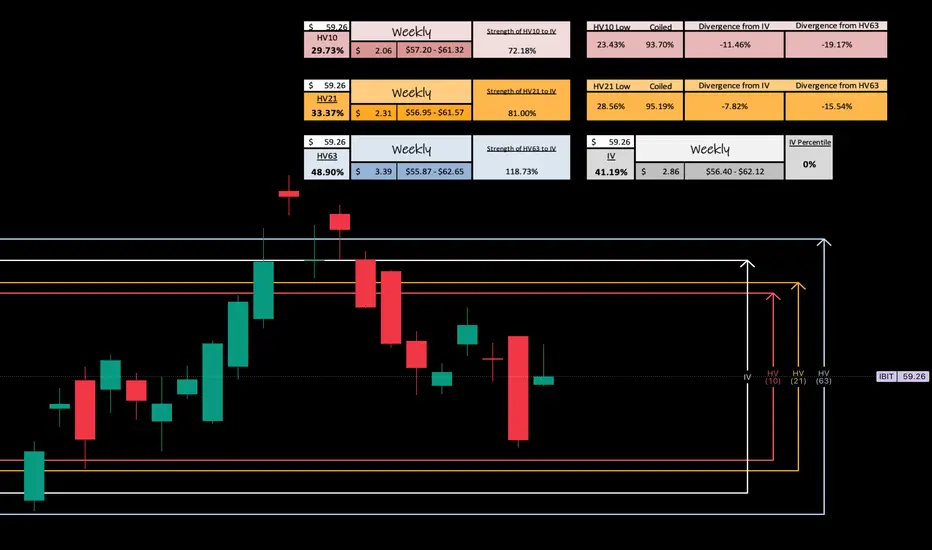
iBIT - Weekly Volatility PotentialGood Morning!
Here is my weekly perspective for NASDAQ:IBIT
From when we reviewed last weekend, IV (41.19%) has lowered -2.23% and is entering the week with a 0% IVp. We have been in this pattern of rotating IV and Bi-Weekly volatility trends back and forth as HV10 (29.73%) entering the week has increased +1.49% from it's respective level entering last week. The prediction of what is to happen is contracting as what is actually happening in the short-term is trending up.
Bi-Weekly and Monthly volatility values after being 100% coiled and both putting in new yearly lows a month ago are starting to unwind as they create distance from those exact lows.
Could long-term trending means be on the horizon with quarterly values?
Bi-weekly trends will eventually find it's way back there with monthly not far behind, question is when. Our best advantage is to continue to track the data and ebb and flow with the markets and macro news as it is released.
Looking towards this next week, Our HV10 (29.73%) trending values are still contracting under our monthly HV21 (33.37%) trends, but IV (41.19%) although lowering beyond yearly lows, is reflecting future expansion.
Only time will tell, I think we will see another volume push into this week -- Remember to always be hedged and come back to join me next weekend as we review the charts for what happened VS our expectation!
CHEERS
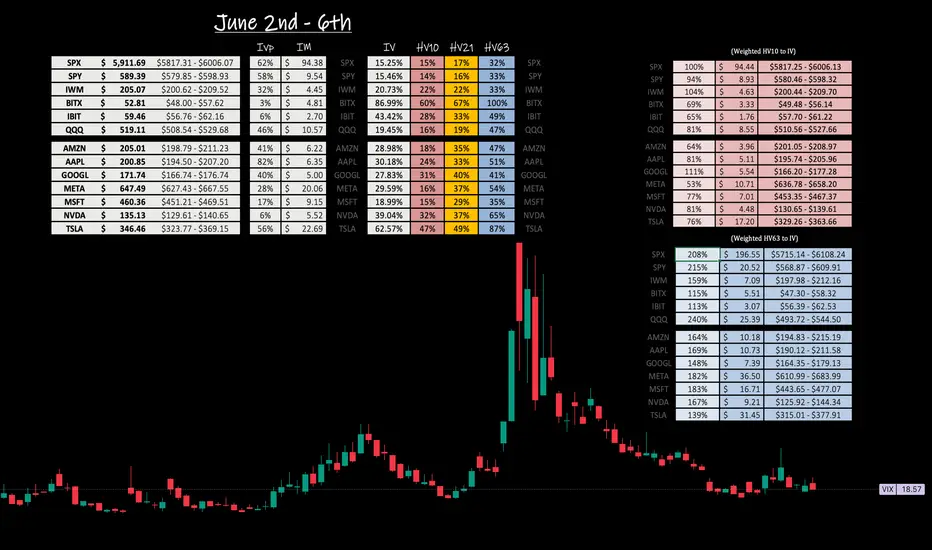
Weekly Volatility Snapshot Volatility, as measured by standard deviation, quantifies market elasticity and provides a level of probability and precision to trade within, that humbles us all.
Last week, the TVC:VIX opened above $21.00 and closed just under $19.00 for a near flat week even for all the eventful action that took place. That being once again, tariff related news with the court of international trade overriding Trump's liberation day, only to have the administration appeal, and the tariffs to be reinstated the following day.
This provided for quite a volatile move, mostly in after hours with everything closing strong to end the month.
As we look towards June starting with next week, just about all indices I track and the magnificent seven are showing near term trending volatility contracting under stated IV, as IV is melting across the board. Notable mention to NASDAQ:NVDA NASDAQ:MSFT NASDAQ:IBIT and CBOE:BITX for all entering the week with great IV value, now let's compare them to their respective trending bi-weekly values to observe what is being predicted to what is happening with near term trending volatility.
NASDAQ:NVDA at a 6% IVp enters the week with an IV of 39.04% -- HV10 (31.70%) is 81% strength of current IV and resonating under monthly values. When you see a large move, that being from the earnings report last week, you will see a massive IV melt to save premium against the PA move due to the beats or misses. With that said, bi-weekly values are just off yearly lows (25.74%) as IV chases it down and i see the underlying as 94.03% coiled for a volatility swing.
NASDAQ:MSFT at a 17% IVp enters the week with an IV of 18.99% -- HV10 (14.55%) is 77% strength of current IV and resonating deeply under monthly values. Bi-weekly yearly lows of 8.56% reflect a coiling of 90.03% at current values.
With both of these, I am looking for a volatility bounce, and regression back to quarterly means. That's where the real fun is and if played right provide excellent opportunity. For further discussion around BITSTAMP:BTCUSD within the funds NASDAQ:IBIT and CBOE:BITX look for my more dedicated posts this weekend.
For those interested in volatility analysis and the application of weighted HV ranges to IV, I encourage you to BOOST and share this post, leave a comment, or follow me to join me on this journey.
We will weekly analyze our ranges under the year-to-date VIX chart and engage in discussions as people please. So hop on board and come along for the ride!
iBIT - Weekly Volatility Snapshot Good afternoon -- Here is my weekly perspective for NASDAQ:IBIT
IV (43.42%) entering the week sits in the 6th percentile for the year. HV10 (28.24%) has been lowering towards it's yearly lows of 23.43% showing a coiling of bi-weekly values at 95.19% from this -- and a divergence from IV of -15.81% . IV is chasing the sinking bi-weekly volatility trends. We generally could see a volatility bounce within this range or continue to grind to new volatility lows.
I always expect and prepare for both, Lewis Pastor once said, "in a scientific setting, chance favors the prepared mind". I hold that true in a lot of situational settings not just scientific, but find it to be very true with BITSTAMP:BTCUSD volatility and risk management.
Moving deeper into the week; what can we expect?
Well, I think that the final shakeout may be here as we consolidate more into the beginning of the week finalizing on Tuesday, June 3rd. I find significance on this date being the extension in time from selling off for 45 days after the initial 'W' distribution off the top -- potentially the start of the volatility swing back towards long-term trending means and maybe the start of another impulse run to track into..stay tuned to find out in observation.
If this week we find regression to HV63 (49.26%), it will be a swift and quick move showing lots of strength. The ability to capture premium between the difference of stated IV from lowering HV10 values to the volatility swing back up above IV to quarterly means, is what it is all about ! This capture can be upwards 5.84% as a volatility metric read and beyond, because when a volatility regression occurs, it moves past means until having to consolidate back downwards again. Rinse and repeat.
For those interested in volatility analysis and the application of weighted HV ranges to IV, I encourage you to BOOST and share this post, leave a comment, or follow me to join me on this journey.

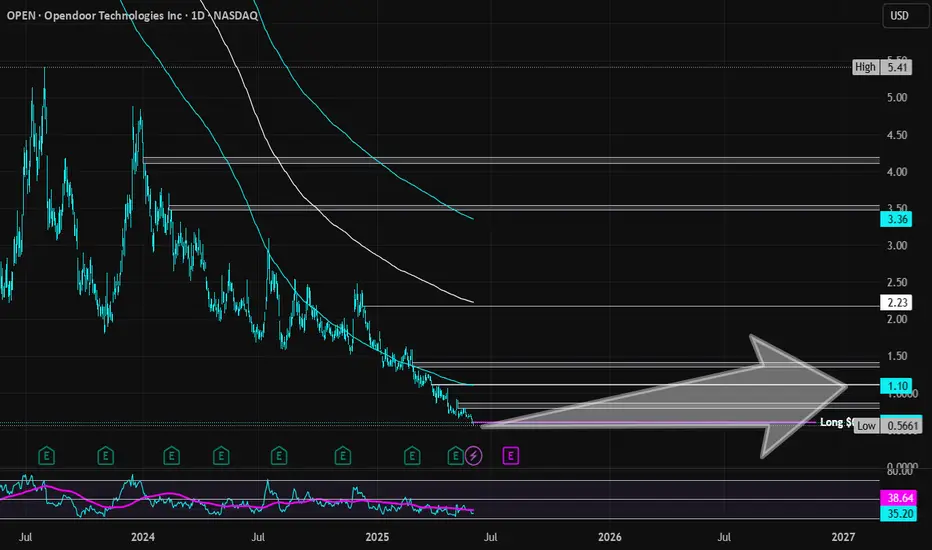
Opendoor Technologies | OPEN | Long at $0.60Opendoor Technologies $NASDAQ:OPEN. This is purely a swing trade for a company that has been posting declining earnings and revenue since 2022 and does not anticipate becoming profitable in the next 3 years. Since the stock is now under $1, it's at-risk of being delisted from the Nasdaq. I am entering this play because there is a chance the recent price hit near $0.50 may be a temporary bottom and there is enough short interest (near 18%) for a spike near its book value of $1.00. Quick ratio is 0.75 (i.e. company may have difficulty meeting its short-term obligations without selling inventory or acquiring additional financing). While the company may be forced to do a split (a major risk for this purchase), I can see other eyes viewing this as a potential "quick play" for a reversal near its book value.
At $0.60, NASDAQ:OPEN is in a personal buy zone for a swing trade.
Targets:
$0.87 (+45%)
$1.00 (+66.7%)
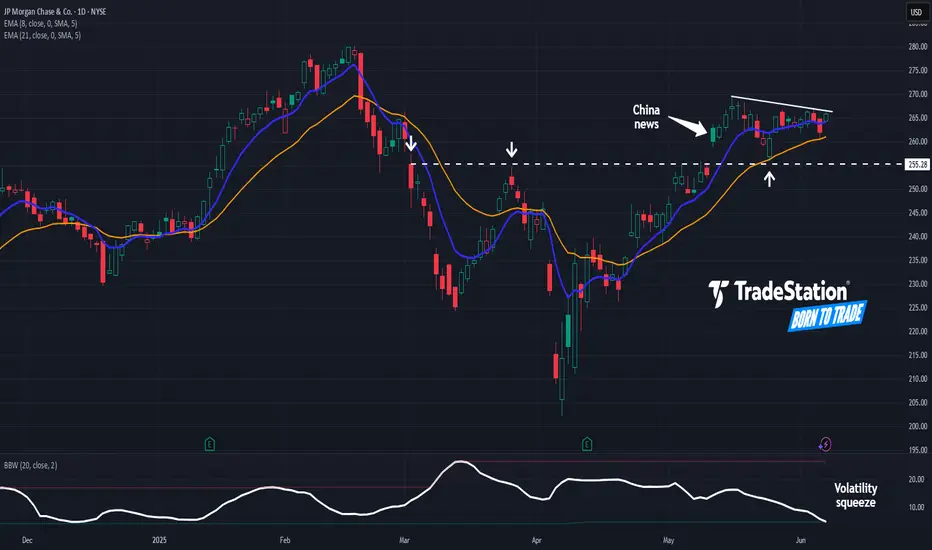
JPMorgan’s Tight ActionJPMorgan Chase has been consolidating for weeks, and some traders may expect resolution to the upside.
The first pattern on today’s chart is the gap on May 12 after Treasury Secretary Scott Bessent signaled progress in trade talks with China. The news pushed JPM above $263, and the stock has chopped on either side of that level since.
In the process, Bollinger Bandwidth has narrowed to the bottom of its longer-term history. Could that tight price action give way to expansion?
Third, the megabank stalled around $255 in early March and late March. The current consolidation has occurred above that level, potentially suggesting that old resistance has become new support.
Next, the series of lower highs since May 15 has created a falling trendline. That resistance may provide a reference point for a potential breakout.
Finally, the 8-day exponential moving average (EMA) has remained above the 21-day EMA.
TradeStation has, for decades, advanced the trading industry, providing access to stocks, options and futures. If you're born to trade, we could be for you. See our Overview for more.
Past performance, whether actual or indicated by historical tests of strategies, is no guarantee of future performance or success. There is a possibility that you may sustain a loss equal to or greater than your entire investment regardless of which asset class you trade (equities, options or futures); therefore, you should not invest or risk money that you cannot afford to lose. Online trading is not suitable for all investors. View the document titled Characteristics and Risks of Standardized Options at www.TradeStation.com . Before trading any asset class, customers must read the relevant risk disclosure statements on www.TradeStation.com . System access and trade placement and execution may be delayed or fail due to market volatility and volume, quote delays, system and software errors, Internet traffic, outages and other factors.
Securities and futures trading is offered to self-directed customers by TradeStation Securities, Inc., a broker-dealer registered with the Securities and Exchange Commission and a futures commission merchant licensed with the Commodity Futures Trading Commission). TradeStation Securities is a member of the Financial Industry Regulatory Authority, the National Futures Association, and a number of exchanges.
TradeStation Securities, Inc. and TradeStation Technologies, Inc. are each wholly owned subsidiaries of TradeStation Group, Inc., both operating, and providing products and services, under the TradeStation brand and trademark. When applying for, or purchasing, accounts, subscriptions, products and services, it is important that you know which company you will be dealing with. Visit www.TradeStation.com for further important information explaining what this means.
$SPX trying to break out of the range$ SPX is trying to break out the range, having tested both sides with upside and downside false breakouts.
Choppy action till a decisive breakout happens
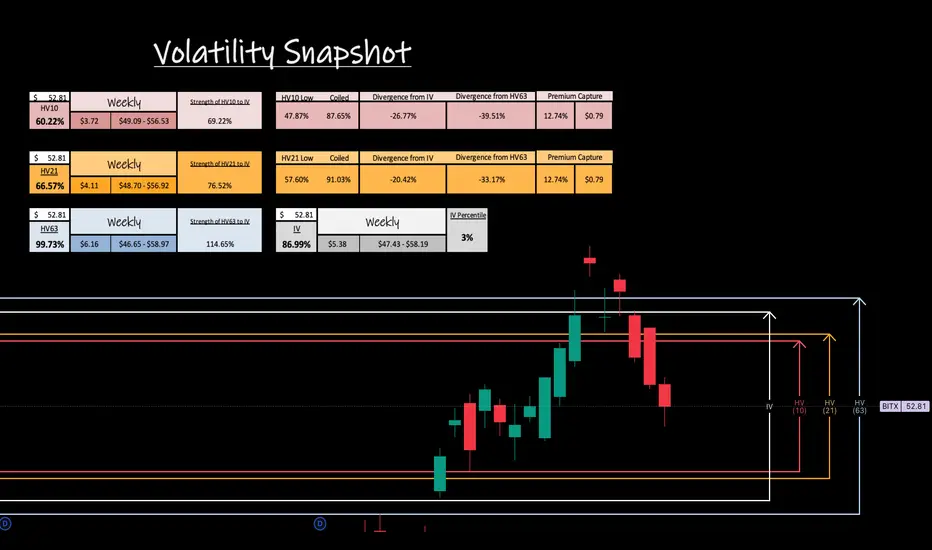
BITx - Weekly Volatility SnapshotGood afternoon -- Here is my weekly perspective for CBOE:BITX
IV (86.99%) entering the week sits in the 3rd percentile for the year. HV10 (60.22%) has been lowering towards it's yearly lows of 47.87% showing a coiling of bi-weekly values at 87.65% from this -- and a divergence from IV of -26.77% . IV is chasing the sinking bi-weekly volatility trends. We generally could see a volatility bounce within this range or continue to grind to new volatility lows.
I always expect and prepare for both, Lewis Pastor once said, "in a scientific setting, chance favors the prepared mind". I hold that true in a lot of situational settings not just scientific, but find it to be very true with BITSTAMP:BTCUSD volatility and risk management.
Moving deeper into the week; what can we expect?
Well, I think that the final shakeout may be here as we consolidate more into the beginning of the week finalizing on Tuesday, June 3rd. I find significance on this date being the extension in time from selling off for 45 days after the initial 'W' distribution off the top -- potentially the start of the volatility swing back towards long-term trending means and maybe the start of another impulse run to track into..stay tuned to find out in observation.
If this week we find regression to HV63 (99.73%), it will be a swift and quick move showing lots of strength. The ability to capture premium between the difference of stated IV from lowering HV10 values to the volatility swing back up above IV to quarterly means, is what it is all about! This capture can be upwards 12.74% as a volatility metric read and beyond, because when a volatility regression occurs, it moves past means until having to consolidate back downwards again. Rinse and repeat.
For those interested in volatility analysis and the application of weighted HV ranges to IV, I encourage you to BOOST and share this post, leave a comment, or follow me to join me on this journey.
Key Levels in Focus: Can Gold Push Through 2340 Resistance?XAU/USD Analysis:
Gold initially attempted to break above the current 1-hour supply zone but failed to sustain momentum, leading to a retracement back into the 4-hour demand area. The weekly open was relatively strong, with price tapping into the previous daily candle’s body low and showing early signs of rejection — a signal that could be more meaningful once volume increases during the London session.
If price action can decisively close above the 2340 level with supporting volume, we could see a push toward the 2344 region either before the weekly close or shortly after the market reopens next week.

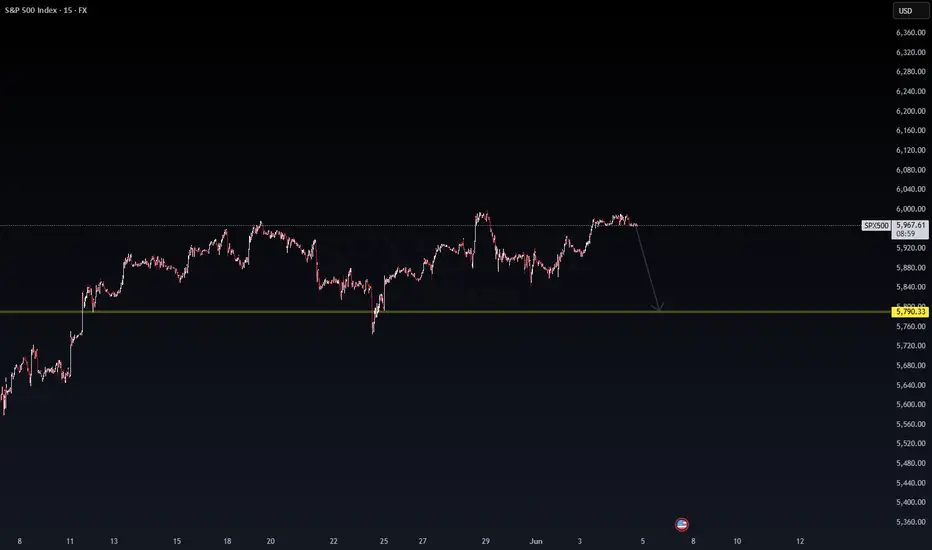
SPX500 — Structural Weakness Emerging on the 15-Min ChartWe may be approaching a critical inflection point.
Price action is showing signs of exhaustion after multiple failed attempts to break higher. The market structure is compressing beneath resistance, setting the stage for a potential breakdown.
🧭 Key Level to Watch:
Support at 5,790.33 aligns with previous liquidity sweeps and demand zones. A move toward this level could reflect rotation from short-term bullish euphoria into a broader correction cycle.
⚠️ Institutional traders, are you watching the same tape?
This isn’t just about price—it’s about positioning.
Market signals:
Distribution pattern forming
Liquidity void below current level
Compression likely to result in expansion (downside bias)
In markets like these, timing is everything.
Capital flows speak louder than sentiment.
#SP500 #MarketStructure #InstitutionalTrading #TechnicalAnalysis #SmartMoney #LiquidityZones #MacroStrategy #WaverVanir #RiskManagement
Many Market Maker OpportunitiesSame as Nasdaq, no one realize the perfect condition in silver. Another beautiful road home to the take profit line in the selling direction for the month.

Beautiful Market Maker on the Nasdaq this early morning.This will be an entire move downward that no one is picking up on right now. With price in the perfect sell position, we're looking to collect on the spread between greed and far like a true market maker
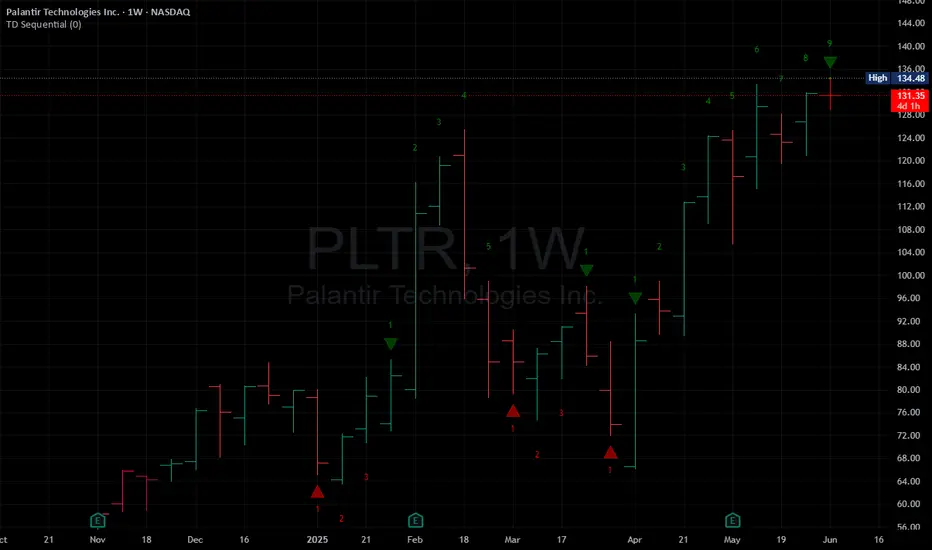
TD Sell setup 9 on weeklydouble down on short side. Avg price 125. High chance of 1-4 week lower price
NQ Power Range Report with FIB Ext - 6/2/2025 SessionCME_MINI:NQM2025
- PR High: 21348.50
- PR Low: 21295.25
- NZ Spread: 119.25
Key scheduled economic events:
09:45 | S&P Global Manufacturing PMI
10:00 | ISM Manufacturing PMI
- ISM Manufacturing Prices
13:00 | Fed Chair Powell Speaks
Holding inside Friday's range
Session Open Stats (As of 12:15 AM 6/2)
- Session Open ATR: 440.37
- Volume: 29K
- Open Int: 267K
- Trend Grade: Neutral
- From BA ATH: -6.2% (Rounded)
Key Levels (Rounded - Think of these as ranges)
- Long: 22096
- Mid: 20383
- Short: 19246
Keep in mind this is not speculation or a prediction. Only a report of the Power Range with Fib extensions for target hunting. Do your DD! You determine your risk tolerance. You are fully capable of making your own decisions.
BA: Back Adjusted
BuZ/BeZ: Bull Zone / Bear Zone
NZ: Neutral Zone
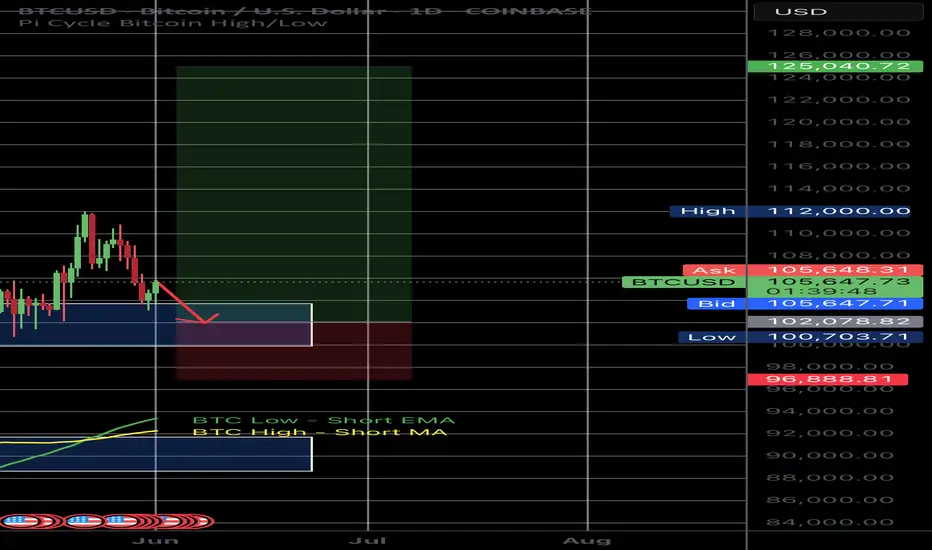
Bitcoin analysis based on market liquidity and M2 money supply This trade enters Bitcoin in the $101,500–$102,200 zone, aiming to capture a high-probability bounce from a dense liquidity pocket formed by recent long liquidations. This region has historically acted as a bull market reaccumulation zone, typically holding after 5–8% drawdowns during major trend continuations.
The trade is structured to ride a macro continuation leg toward $125,000, targeting the next major expansion phase driven by both short squeezes (clustered above $106K) and a broader surge in demand following increasing M2 money supply and institutional inflows.
The stop-loss is placed at $97,000, a deliberate distance below local support but above the deeper liquidity sweep zone at $89K–$92K. That level is unlikely to be reached unless the market undergoes a full liquidation cascade, which would likely bypass $97K altogether in a fast move. This stop protects against structural failure while avoiding premature exits in normal volatility.
The setup is designed for maximum reward with acceptable risk, offering a risk-reward ratio of over 4:1, and aligns with the thesis that Bitcoin is entering its final acceleration phase toward a new macro high.
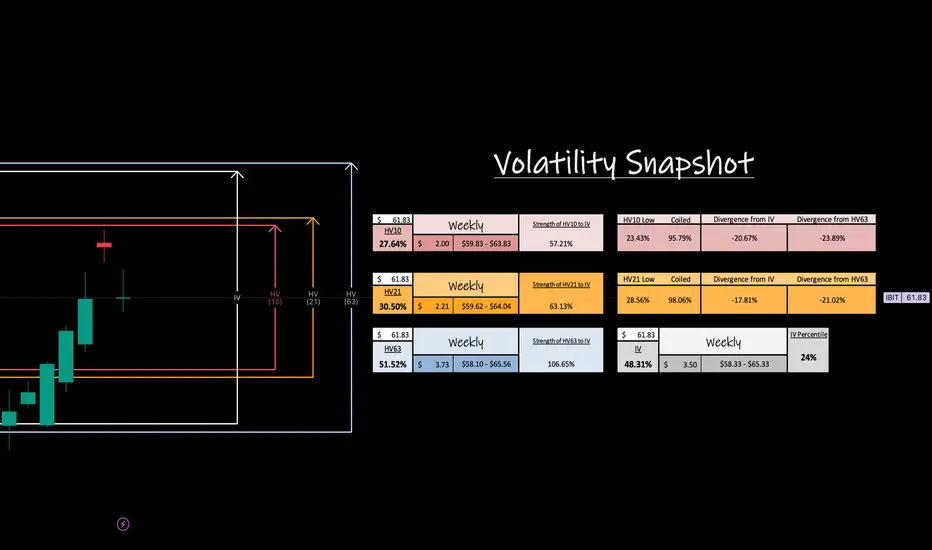
iBIT - Weekly Volatility SnapshotGood Afternoon,
Here is my weekly perspective for NASDAQ:IBIT ---
IV (48.31%) entering this week is holding in the 24th percent range for the year and has been climbing weekly from putting in new lows at the beginning of the year. We essentially have been seeing rising IV with rising price action, the best of the best. Premium increases from price action climbing and IV rising affects Vega positively increasing premium too.
Bi-weekly trends (27.64%) show a cooling off entering the week and contraction under IV, but it might not last long as there could be major macro news in the crypto world at any moment. This could be a big week on continued regression towards quarterly means (51.52%).
If this happens the range will continue to expand in my option and hold a +3.21% value per move on premium over stated IV, but weekly trends would be expanding 23.89% -- A huge move.
As always --
For those interested in volatility analysis and the application of weighted HV ranges to IV, I encourage you to BOOST and share this post, leave a comment, or follow me to join me on this journey.
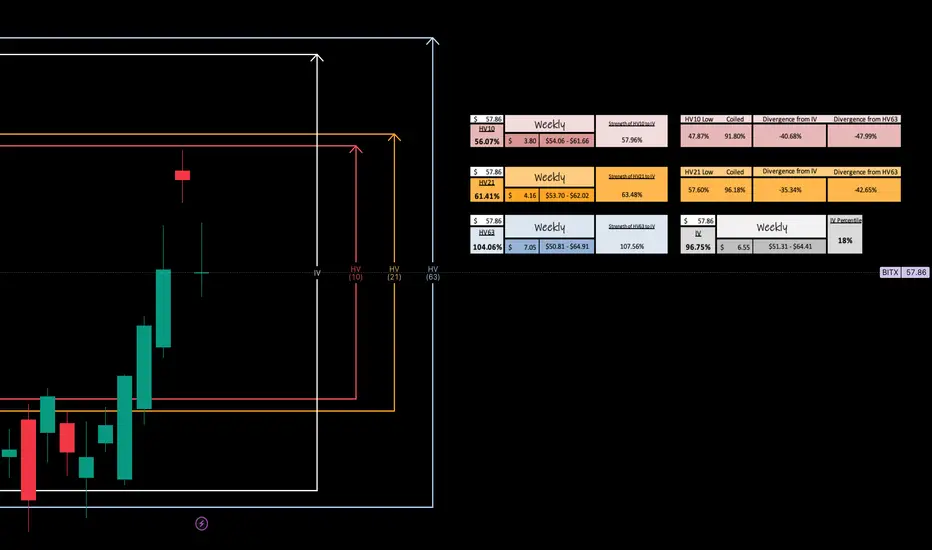
BITx - Weekly Volatility SnapshotGood Afternoon,
Here is my weekly perspective for CBOE:BITX
IV (96.75%) entering this week is holding in the 18th percent range for the year and has been climbing weekly from putting in new lows at the beginning of the year. We essentially have been seeing rising IV with rising price action, the best of the best. Premium increases from price action climbing and IV rising affects Vega positively increasing premium too.
Bi-weekly trends (56.07%) show a cooling off entering the week and contraction under IV, but it might not last long as there could be major macro news in the crypto world at any moment. This could be a big week on continued regression towards quarterly means (104.06%).
If this happens the range will continue to expand in my option and hold a +7.31% value per move on premium over stated IV, but weekly trends would be expanding 47.99% -- A huge move.
As always --
For those interested in volatility analysis and the application of weighted HV ranges to IV, I encourage you to BOOST and share this post, leave a comment, or follow me to join me on this journey.
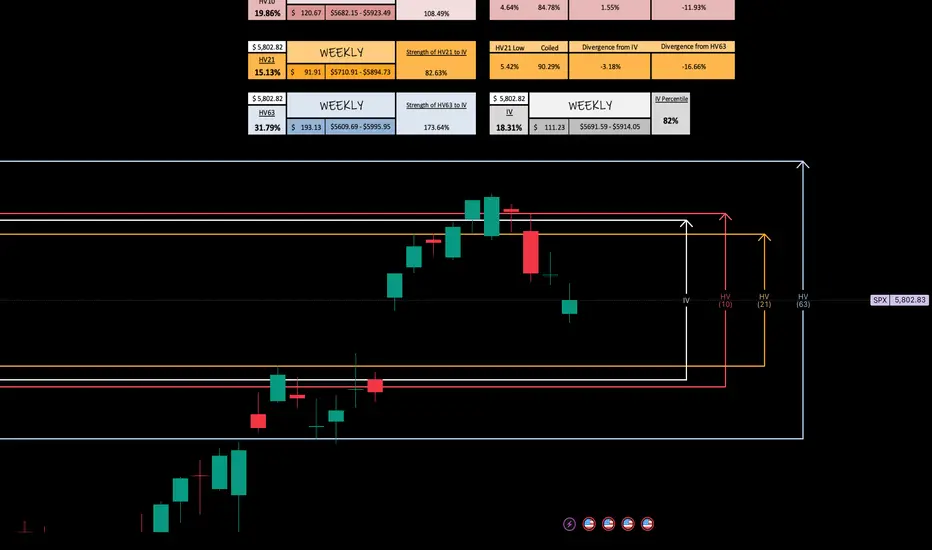
S&P 500 Index -- Weekly Volatility Potential Good Afternoon!
This week, I want to talk about the CBOE:SPX and its weekly potential for how I read historical volatility to weight it then to implied volatility -- this creates my custom trading ranges.
Implied ranges for this week are calculated at 4 DTE using my strength of IV method. You can find out more how I do this over at my highlights page on 'X' - Find me @askHVtobidIV
We are entering a short week, with IV currently in the 89th percentile for the year ( 18.31% ) and resonating between bi-weekly ( 19.36% ) and monthly ( 15.13% ) historical values. Quarterly volatility trends ( 31.79% ) have risen more than 10% this year alone due to macro concerns and increased news from tariff uncertainties. This is creating a volatile environment that, in turn, only increases our trading ranges. Something I personally like.
Near-term trends are above the currently high IV environment, suggesting further expansion. This provides premium value on what is happening to what is projected to happen and a “strength of IV” of >100% indicating rising volatility, slowly towards quarterly means, while resonating around monthly trends.
If price action drives downwards, our gap from May 16th could fill around $5,692.56 with confluence of HV21 trends at $5,710.91.
Conversely, I can see HV10 ranges with rising pricing action and good macro news with EU tariffs breaking $5,971.33—Expanding to the price of $5,995.95 with continuing expansion and regression towards means.
Come back next weekend as I will review the chart to see how we developed!
For those interested in volatility analysis and the application of weighted HV ranges to IV, I encourage you to BOOST and share this post, leave a comment, or follow me to join me on this journey.
NQ Power Range Report with FIB Ext - 5/30/2025 SessionCME_MINI:NQM2025
- PR High: 21395.25
- PR Low: 21335.25
- NZ Spread: 134.0
Key scheduled economic events:
08:30 | Core PCE Price Index (YoY|MoM)
09:45 | Chicago PMI
Rotation off 21850
- Previous session print advertising decline back to week low
Session Open Stats (As of 1:25 AM 5/30)
- Session Open ATR: 446.48
- Volume: 33K
- Open Int: 267K
- Trend Grade: Neutral
- From BA ATH: -5.6% (Rounded)
Key Levels (Rounded - Think of these as ranges)
- Long: 22096
- Mid: 20383
- Short: 19246
Keep in mind this is not speculation or a prediction. Only a report of the Power Range with Fib extensions for target hunting. Do your DD! You determine your risk tolerance. You are fully capable of making your own decisions.
BA: Back Adjusted
BuZ/BeZ: Bull Zone / Bear Zone
NZ: Neutral Zone
